| Param | Original file | Final file |
|---|---|---|
| Filename | modeM0/AS1A04_230T01_9000002374_16074cztM0_level2.evt | modeM0/AS1A04_230T01_9000002374_16074cztM0_level2_quad_clean.evt |
| Size (bytes) | 832,464,000 | 152,141,760 |
| Size | 793.9 MB | 145.1 MB |
| Events in quadrant A | 6,412,731 | 965,150 |
| Events in quadrant B | 6,238,103 | 966,010 |
| Events in quadrant C | 5,863,016 | 931,759 |
| Events in quadrant D | 5,893,595 | 923,608 |
| Mode M9 | |||
|---|---|---|---|
| Quadrant | BADHDUFLAG | Total packets | Discarded packets |
| A | 0 | 9 | 0 |
| B | 0 | 9 | 0 |
| C | 0 | 9 | 0 |
| D | 0 | 9 | 0 |
| Mode SS | |||
|---|---|---|---|
| Quadrant | BADHDUFLAG | Total packets | Discarded packets |
| A | 0 | 242 | 0 |
| B | 0 | 242 | 0 |
| C | 0 | 242 | 0 |
| D | 0 | 242 | 0 |
| Mode M0 | |||
|---|---|---|---|
| Quadrant | BADHDUFLAG | Total packets | Discarded packets |
| A | 0 | 26922 | 3 |
| B | 0 | 26226 | 2 |
| C | 0 | 24922 | 2 |
| D | 0 | 25565 | 2 |
| Quadrant | Total seconds | Saturated seconds | Saturation percentage |
|---|---|---|---|
| A | 11871 | 119 | 1.002443% |
| B | 11871 | 193 | 1.625811% |
| C | 11871 | 153 | 1.288855% |
| D | 11871 | 74 | 0.623368% |
Noise dominated data is calculated using 1-second bins in cleaned event files. If a bin has >2000 counts, and if more than 50% of those come from <1% of pixels, then it is considered to be noise-dominated and hence unusable.
| Quadrant | # 1 sec bins | Bins with >0 counts | Bins with >2000 counts | High rate bins dominated by noise | Noise dominated (total time) | Noise dominated (detector-on time) | Marked lightcurve |
|---|---|---|---|---|---|---|---|
| A | 12772 | 11872 | 5 | 5 | 0.04% | 0.04% | 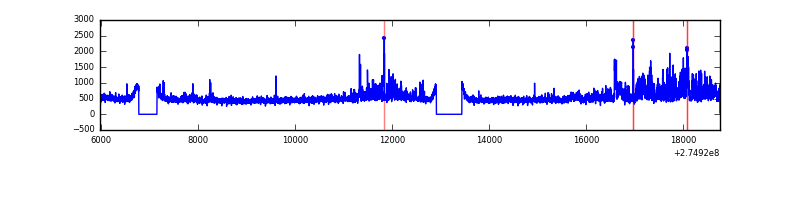 |
| B | 12772 | 11872 | 33 | 33 | 0.26% | 0.28% | 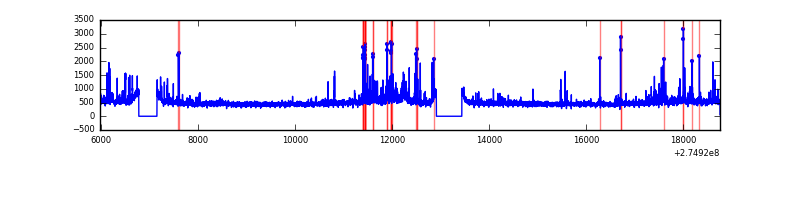 |
| C | 12772 | 11872 | 5 | 5 | 0.04% | 0.04% | 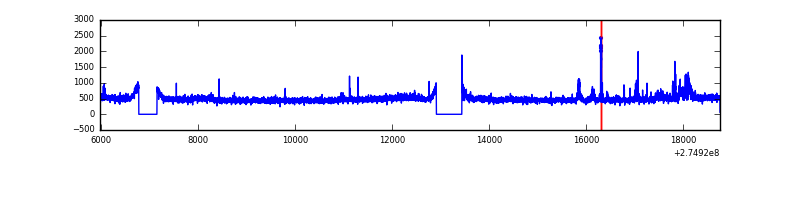 |
| D | 12772 | 11872 | 14 | 14 | 0.11% | 0.12% | 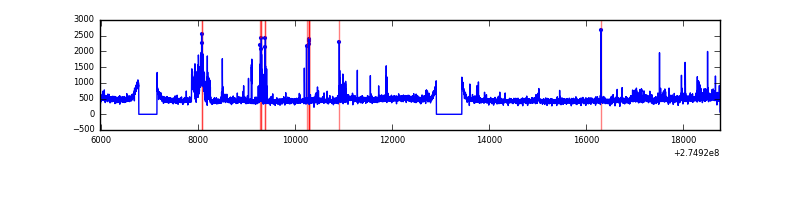 |
Top three noisy pixels from each quadrant. If the there are fewer than three noisy pixels in the level2.evt file, extra rows are filled as -1
| Pixel properties | Quadrant properties | ||||||
|---|---|---|---|---|---|---|---|
| Quadrant | DetID | PixID | Counts | Sigma | Mean | Median | Sigma |
| A | 3 | 80 | 885154 | 3065.42 | 1419 | 1386 | 288.3 |
| A | 9 | 143 | 28229 | 93.11 | 1419 | 1386 | 288.3 |
| A | 15 | 69 | 15857 | 50.19 | 1419 | 1386 | 288.3 |
| B | 0 | 189 | 196978 | 712.75 | 1419 | 1381 | 274.4 |
| B | 7 | 220 | 153193 | 553.2 | 1419 | 1381 | 274.4 |
| B | 0 | 190 | 72705 | 259.9 | 1419 | 1381 | 274.4 |
| C | 3 | 233 | 279920 | 870.99 | 1366 | 1378 | 319.8 |
| C | 14 | 238 | 205073 | 636.95 | 1366 | 1378 | 319.8 |
| C | 10 | 22 | 32452 | 97.17 | 1366 | 1378 | 319.8 |
| D | 1 | 52 | 493231 | 1443.22 | 1390 | 1353 | 340.8 |
| D | 2 | 152 | 59669 | 171.1 | 1390 | 1353 | 340.8 |
| D | 2 | 234 | 51952 | 148.46 | 1390 | 1353 | 340.8 |
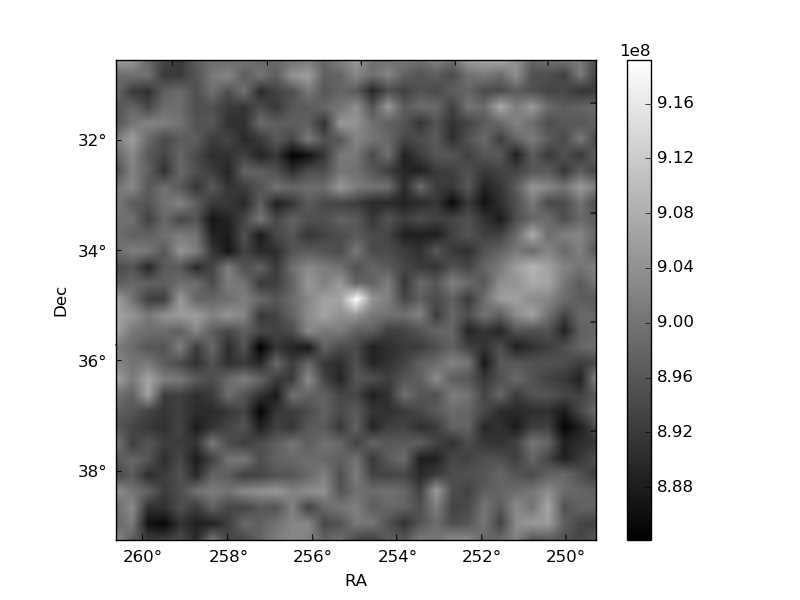
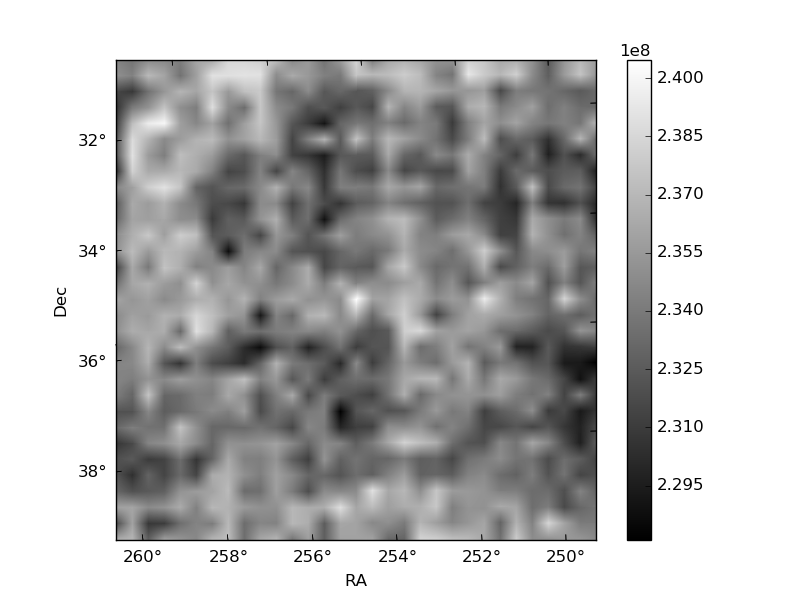
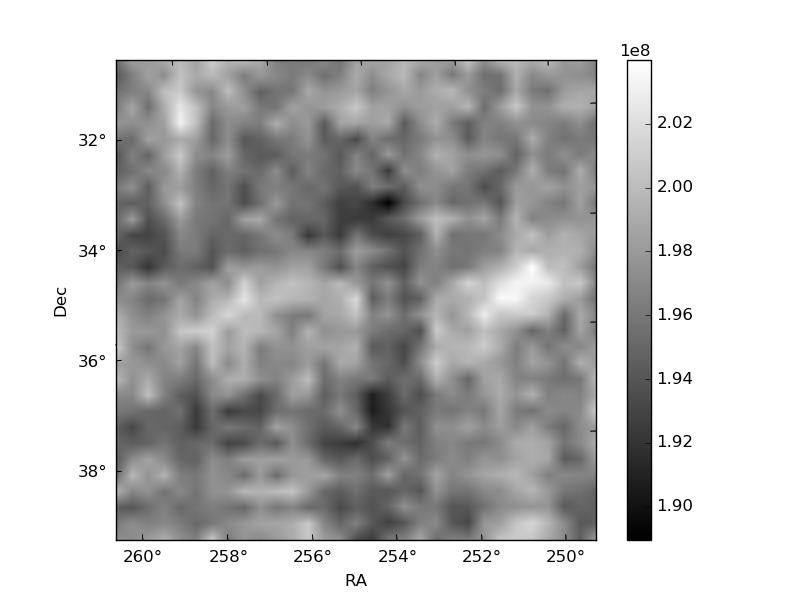
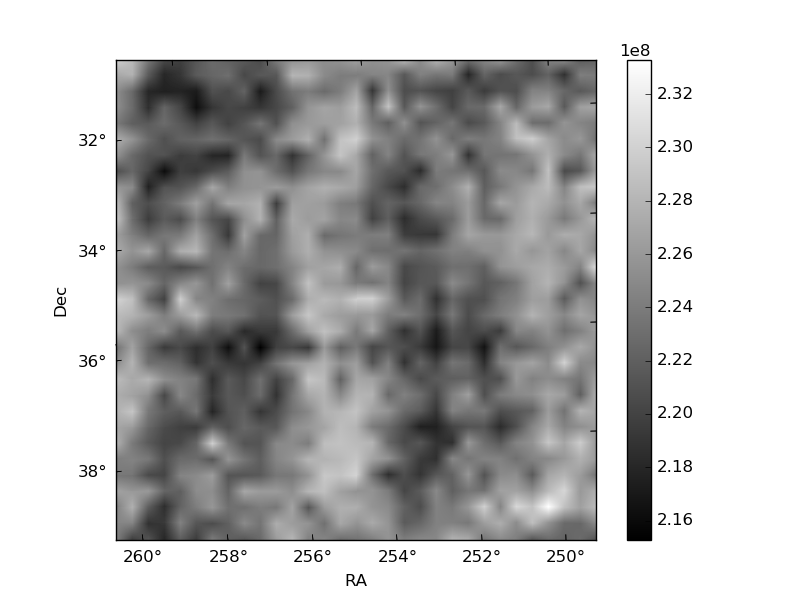
Histogram calculated using DETX and DETY for each event in the final _common_clean file
| Quadrant A | 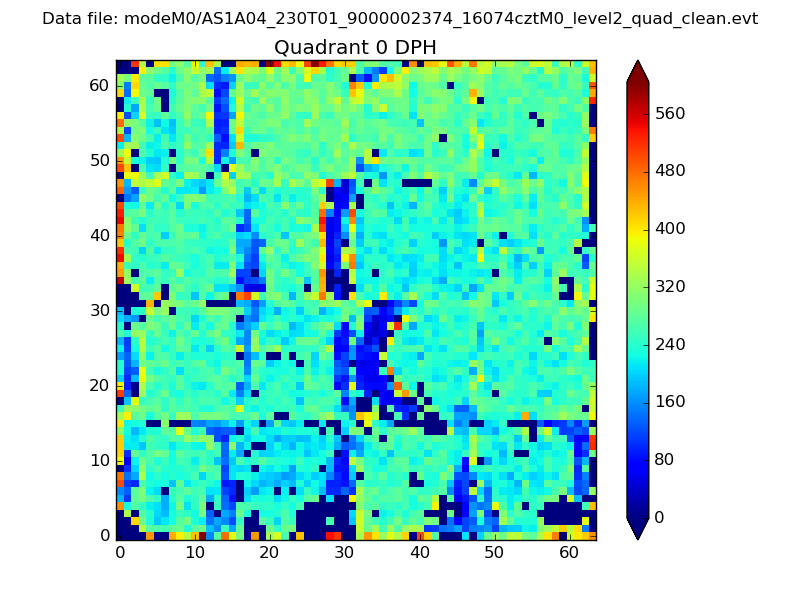 |
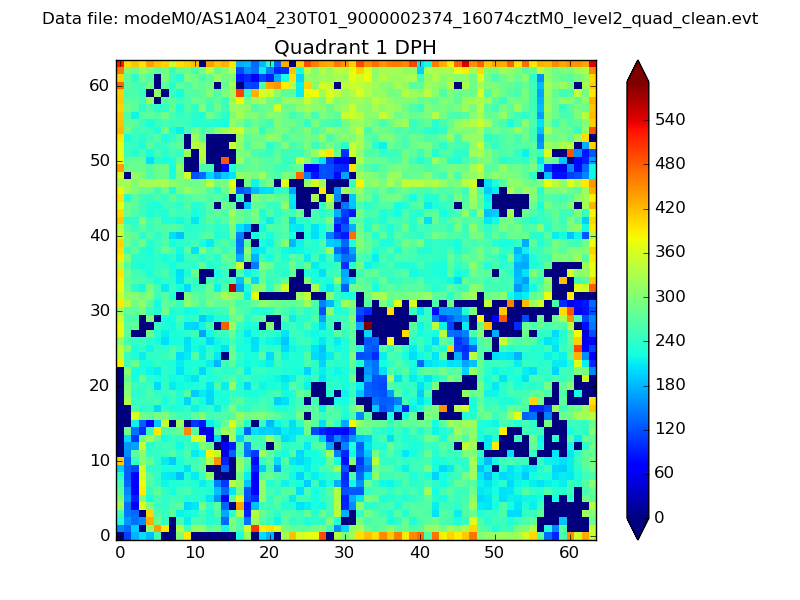 |
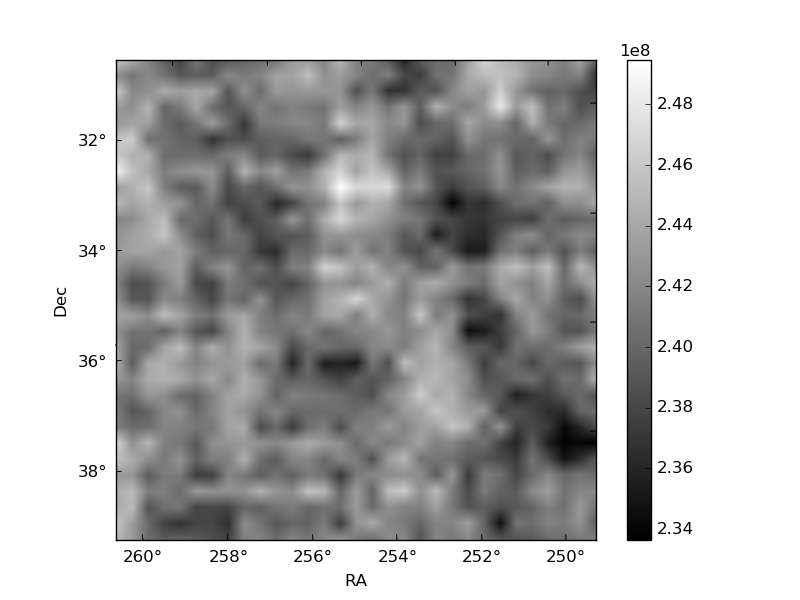
Quadrant B |
|---|---|---|---|
| Quadrant D | 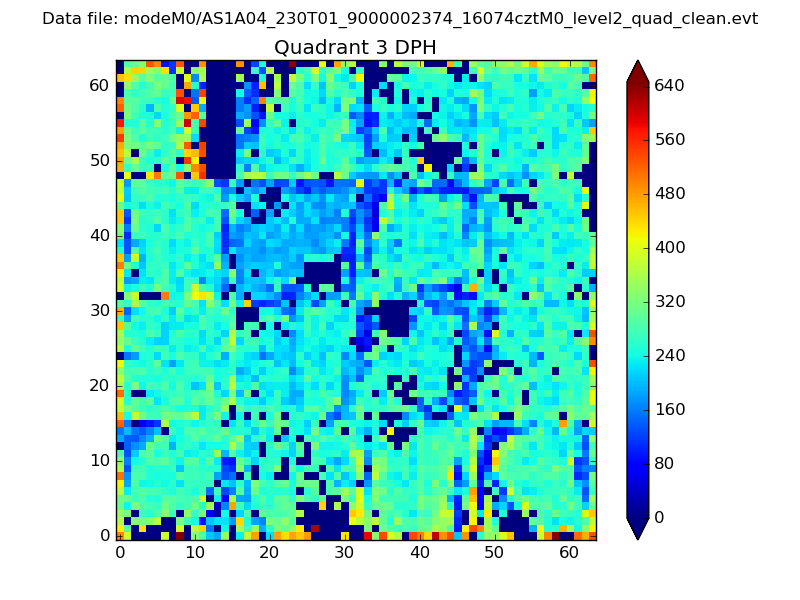 |
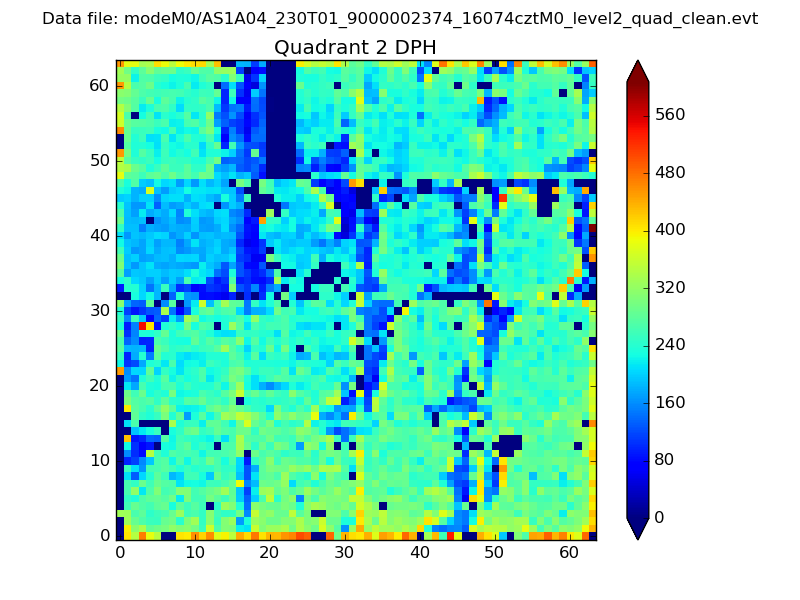 |
Quadrant C |
| Plot type | Count rate plots | Images |
|---|---|---|
| Comparison with Poisson distribution Blue bars denote a histogram of data divided into 1 sec bins. Red curve is a Poisson curve with rate = median count rate of data. |
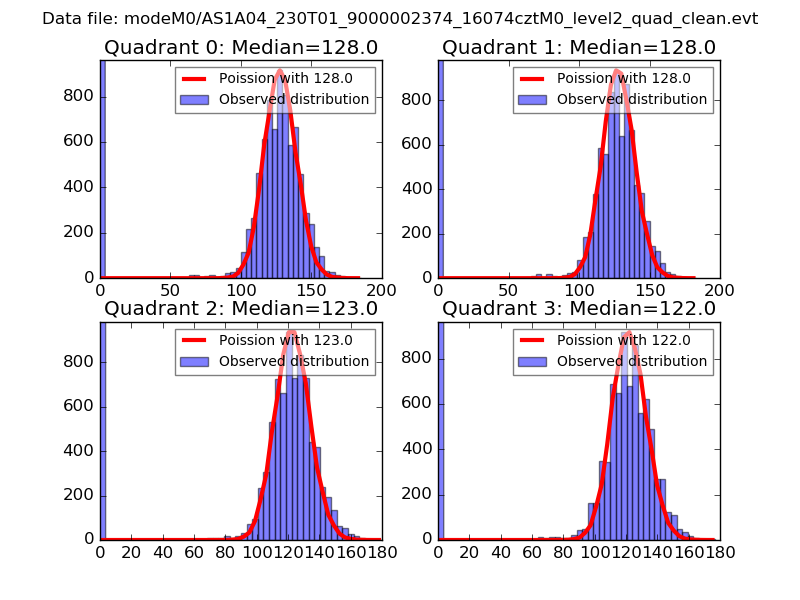 |
 |
| Quadrant-wise count rates Data is divided into 100 sec bins |
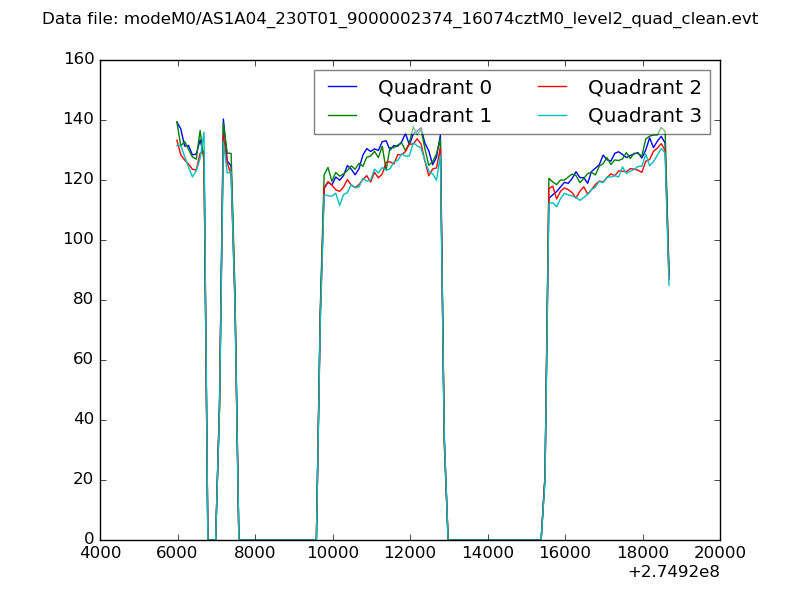 |
|
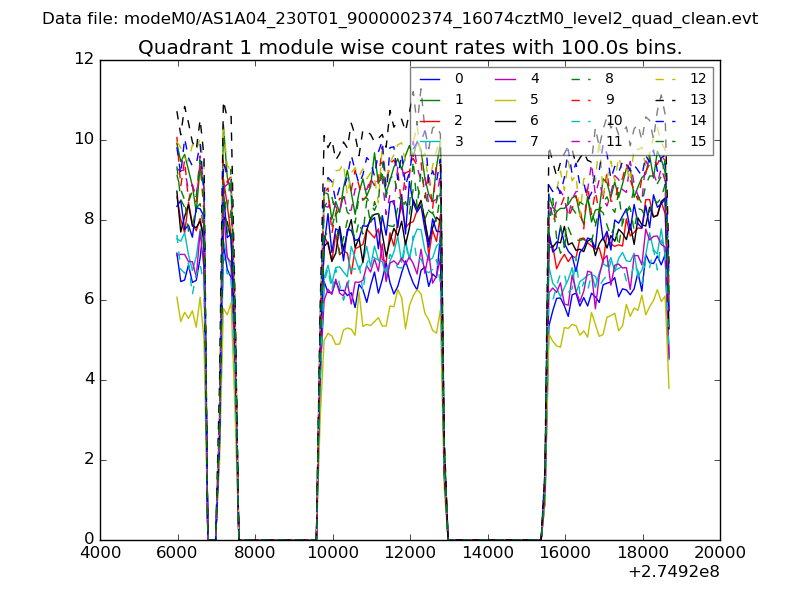
| Module-wise count rates for Quadrant A Data is divided into 100 sec bins |
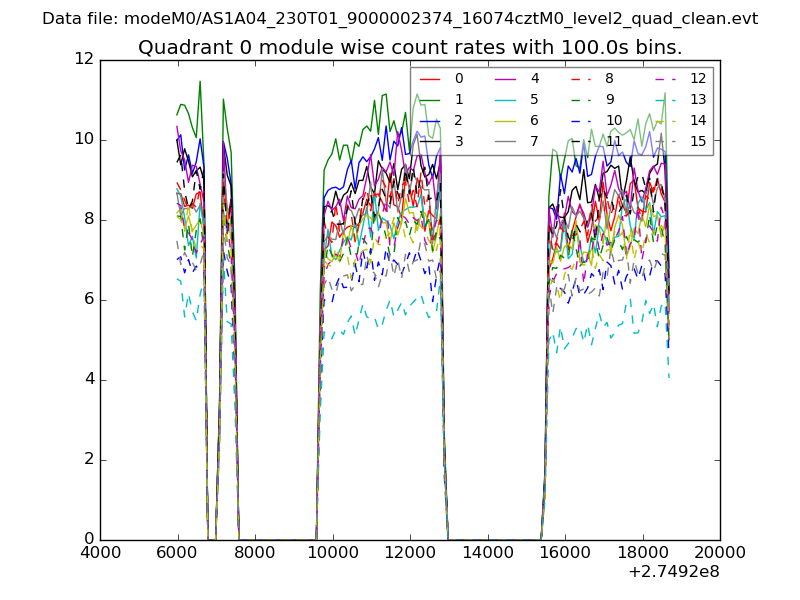 |
 |
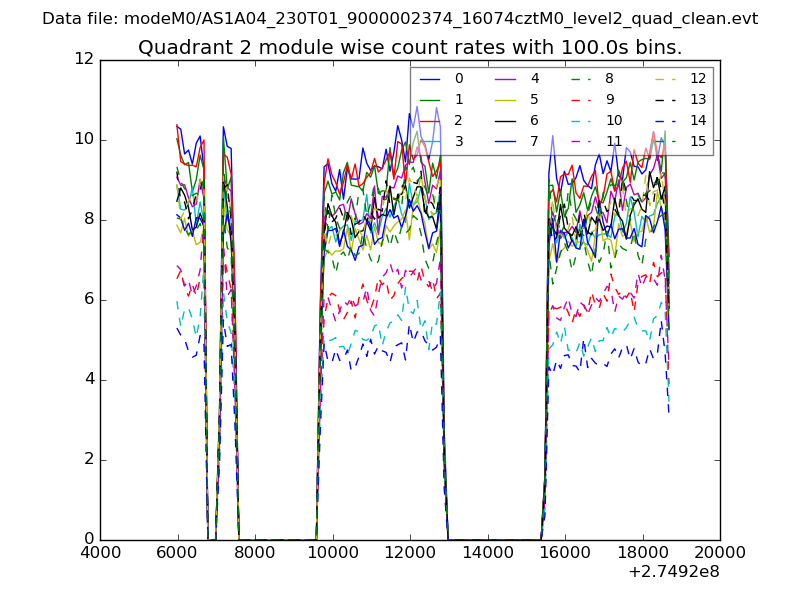
| Module-wise count rates for Quadrant B Data is divided into 100 sec bins |
 |
 |
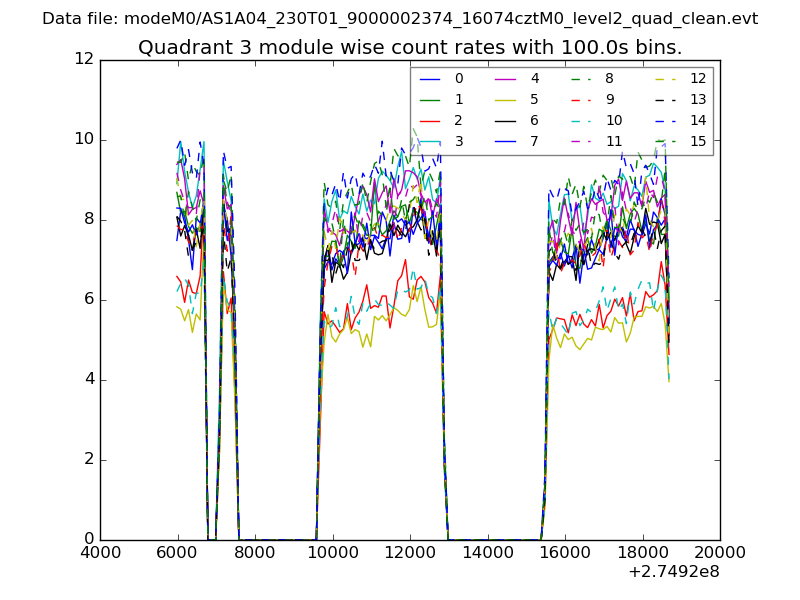
| Module-wise count rates for Quadrant C Data is divided into 100 sec bins |
 |
 |
| Module-wise count rates for Quadrant D Data is divided into 100 sec bins |
 |
 |
| Parameter | Plot |
|---|---|
| CZT HV Monitor | 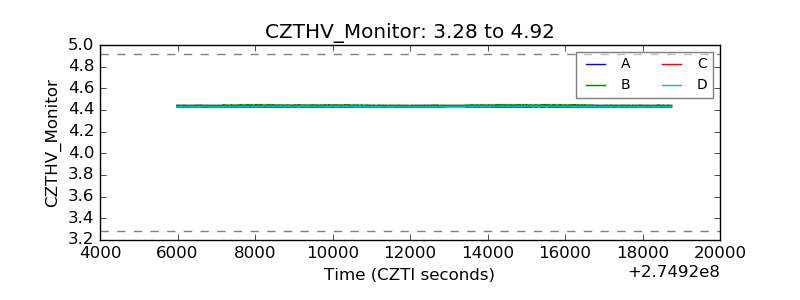 |
| D_VDD | 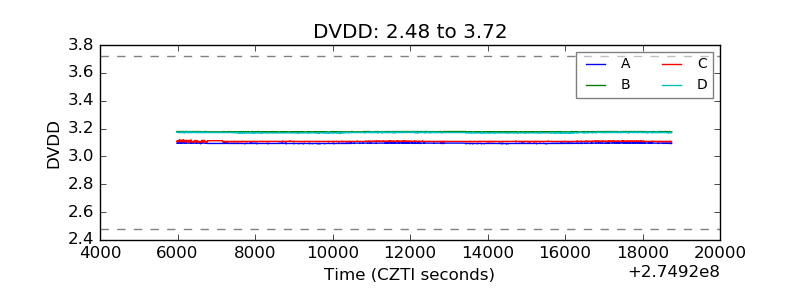 |
| Temperature 1 | 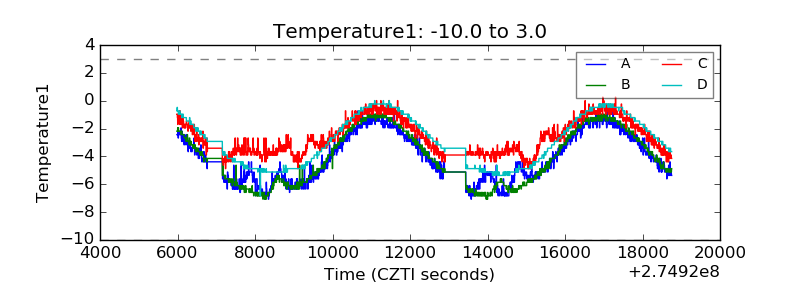 |
| Veto HV Monitor | 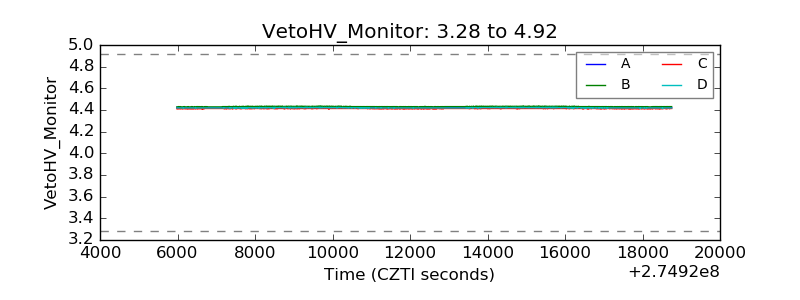 |
| Veto LLD | 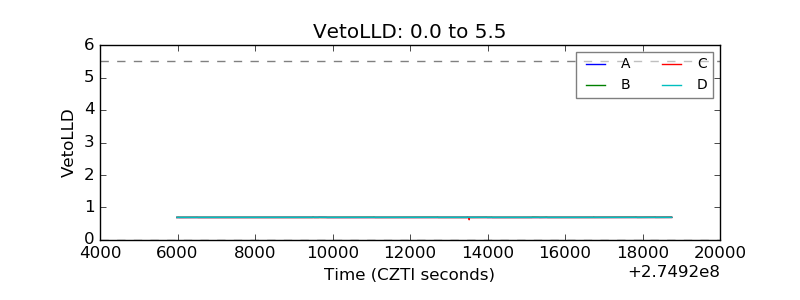 |
| Alpha Counter | 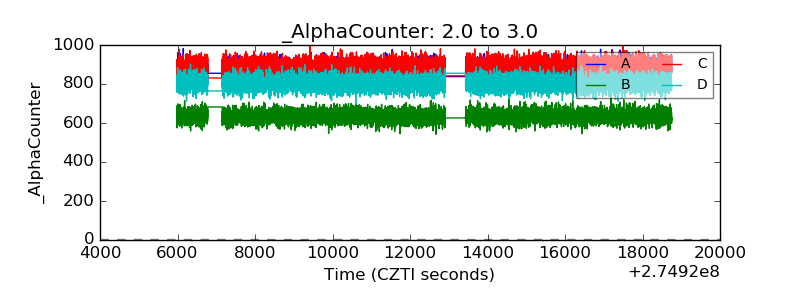 |
| _CPM_Rate | 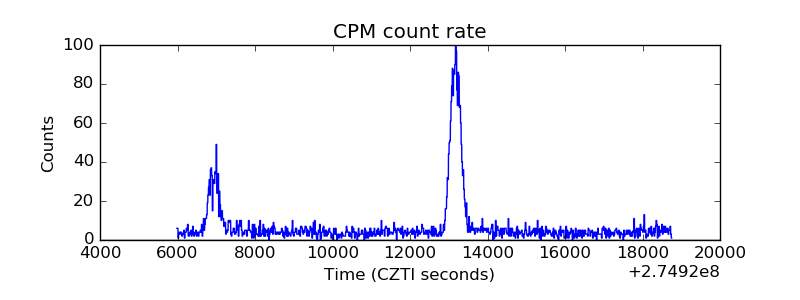 |
| CZT Counter | 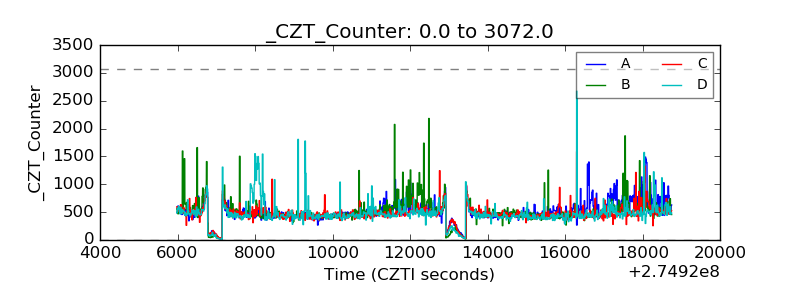 |
| +2.5 Volts monitor | 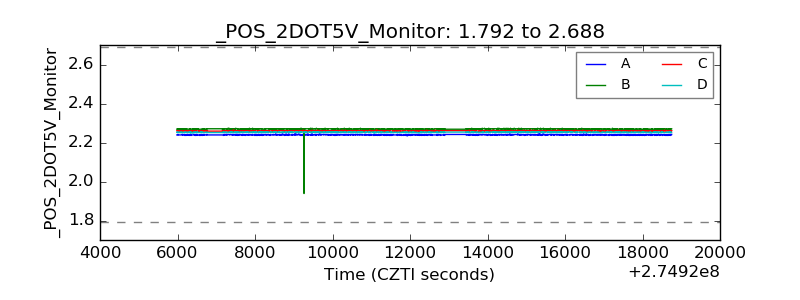 |
| +5 Volts monitor |  |
| _ROLL_ROT | 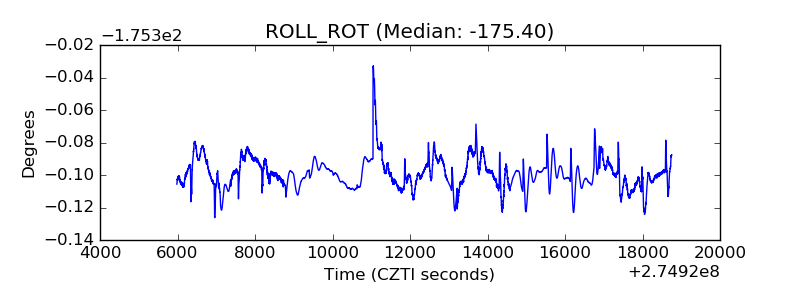 |
| _Roll_DEC | 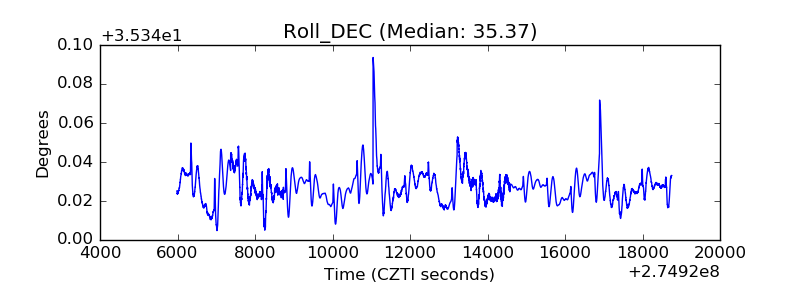 |
| _Roll_RA | 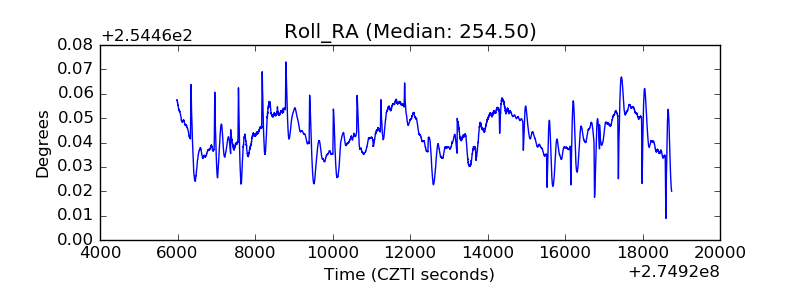 |
| Veto Counter | 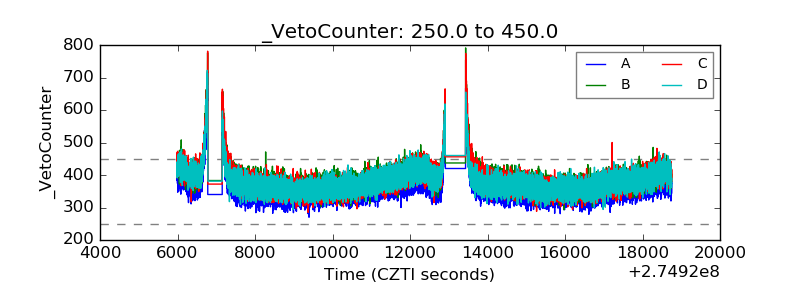 |