| Param | Original file | Final file |
|---|---|---|
| Filename | modeM0/AS1A04_230T01_9000002374_16075cztM0_level2.evt | modeM0/AS1A04_230T01_9000002374_16075cztM0_level2_quad_clean.evt |
| Size (bytes) | 517,559,040 | 89,023,680 |
| Size | 493.6 MB | 84.9 MB |
| Events in quadrant A | 4,016,960 | 553,641 |
| Events in quadrant B | 3,818,995 | 557,596 |
| Events in quadrant C | 3,587,603 | 537,993 |
| Events in quadrant D | 3,747,133 | 530,411 |
| Mode M9 | |||
|---|---|---|---|
| Quadrant | BADHDUFLAG | Total packets | Discarded packets |
| A | 0 | 15 | 0 |
| B | 0 | 15 | 0 |
| C | 0 | 15 | 0 |
| D | 0 | 15 | 0 |
| Mode SS | |||
|---|---|---|---|
| Quadrant | BADHDUFLAG | Total packets | Discarded packets |
| A | 0 | 154 | 0 |
| B | 0 | 154 | 0 |
| C | 0 | 154 | 0 |
| D | 0 | 154 | 0 |
| Mode M0 | |||
|---|---|---|---|
| Quadrant | BADHDUFLAG | Total packets | Discarded packets |
| A | 0 | 16475 | 3 |
| B | 0 | 15875 | 2 |
| C | 0 | 15236 | 2 |
| D | 0 | 16029 | 2 |
| Quadrant | Total seconds | Saturated seconds | Saturation percentage |
|---|---|---|---|
| A | 7412 | 118 | 1.592013% |
| B | 7412 | 164 | 2.212628% |
| C | 7412 | 135 | 1.821371% |
| D | 7412 | 75 | 1.011873% |
Noise dominated data is calculated using 1-second bins in cleaned event files. If a bin has >2000 counts, and if more than 50% of those come from <1% of pixels, then it is considered to be noise-dominated and hence unusable.
| Quadrant | # 1 sec bins | Bins with >0 counts | Bins with >2000 counts | High rate bins dominated by noise | Noise dominated (total time) | Noise dominated (detector-on time) | Marked lightcurve |
|---|---|---|---|---|---|---|---|
| A | 8933 | 7413 | 17 | 17 | 0.19% | 0.23% | 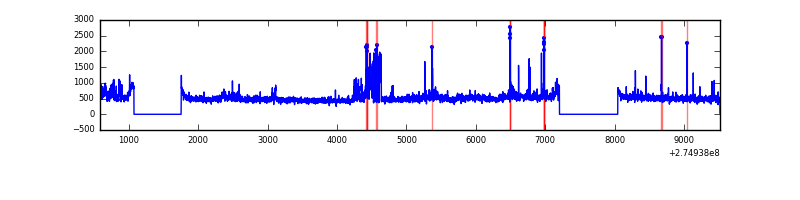 |
| B | 8933 | 7413 | 37 | 37 | 0.41% | 0.50% | 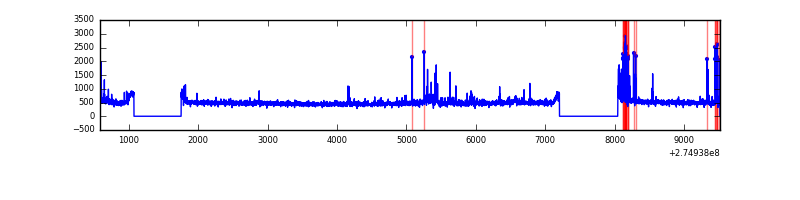 |
| C | 8933 | 7413 | 4 | 4 | 0.04% | 0.05% | 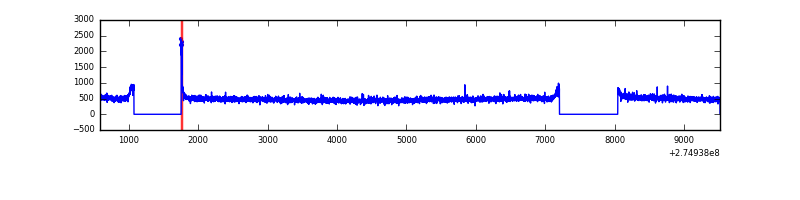 |
| D | 8933 | 7413 | 1 | 1 | 0.01% | 0.01% | 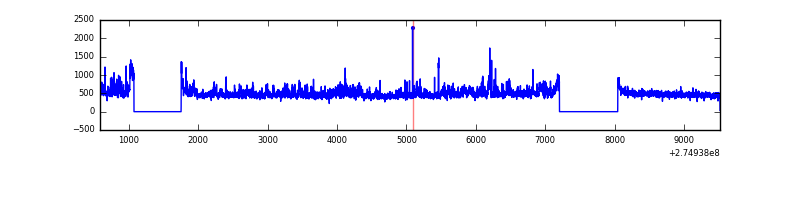 |
Top three noisy pixels from each quadrant. If the there are fewer than three noisy pixels in the level2.evt file, extra rows are filled as -1
| Pixel properties | Quadrant properties | ||||||
|---|---|---|---|---|---|---|---|
| Quadrant | DetID | PixID | Counts | Sigma | Mean | Median | Sigma |
| A | 3 | 80 | 451387 | 2457.97 | 905 | 883 | 183.3 |
| A | 9 | 143 | 33071 | 175.62 | 905 | 883 | 183.3 |
| A | 15 | 174 | 23990 | 126.07 | 905 | 883 | 183.3 |
| B | 4 | 173 | 140984 | 802.14 | 903 | 880 | 174.7 |
| B | 7 | 220 | 29894 | 166.11 | 903 | 880 | 174.7 |
| B | 4 | 216 | 29255 | 162.46 | 903 | 880 | 174.7 |
| C | 14 | 238 | 132092 | 639.71 | 866 | 873 | 205.1 |
| C | 3 | 233 | 45663 | 218.36 | 866 | 873 | 205.1 |
| C | 0 | 207 | 16347 | 75.44 | 866 | 873 | 205.1 |
| D | 1 | 52 | 344821 | 1593.16 | 881 | 856 | 215.9 |
| D | 2 | 152 | 56621 | 258.29 | 881 | 856 | 215.9 |
| D | 2 | 234 | 26605 | 119.26 | 881 | 856 | 215.9 |
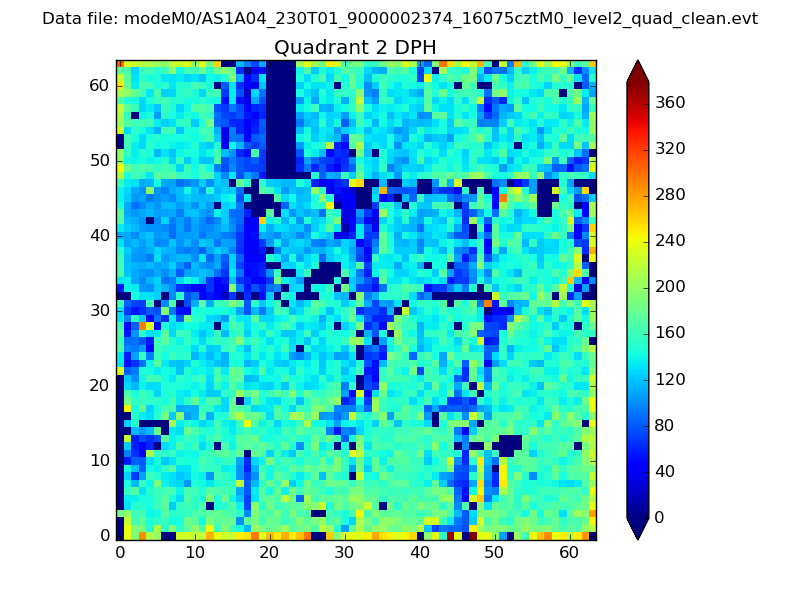
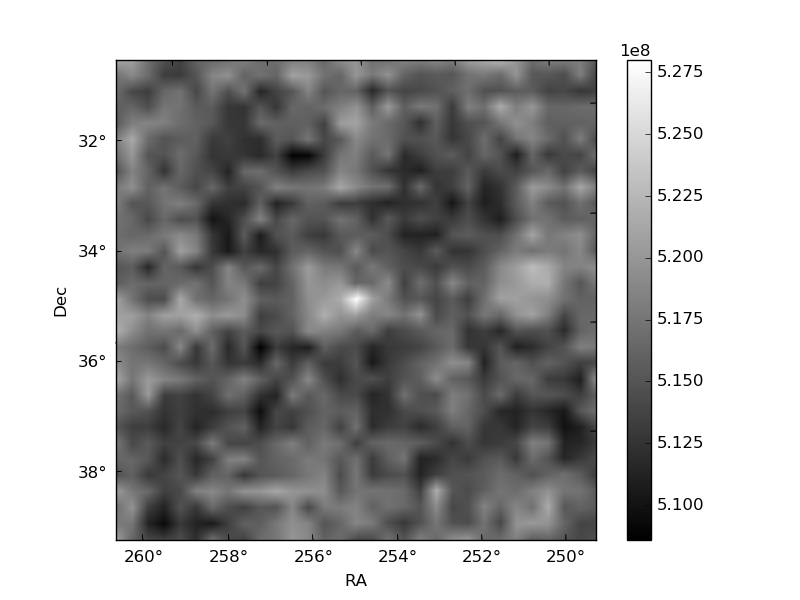
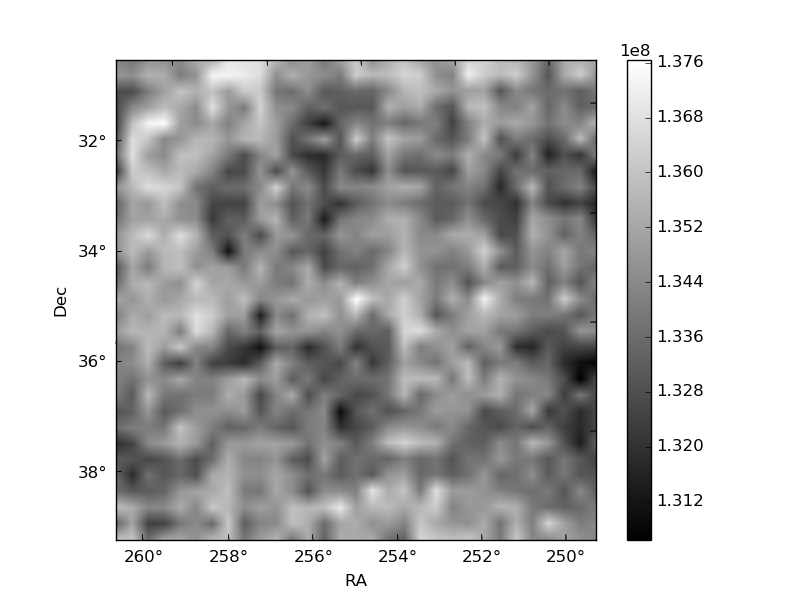
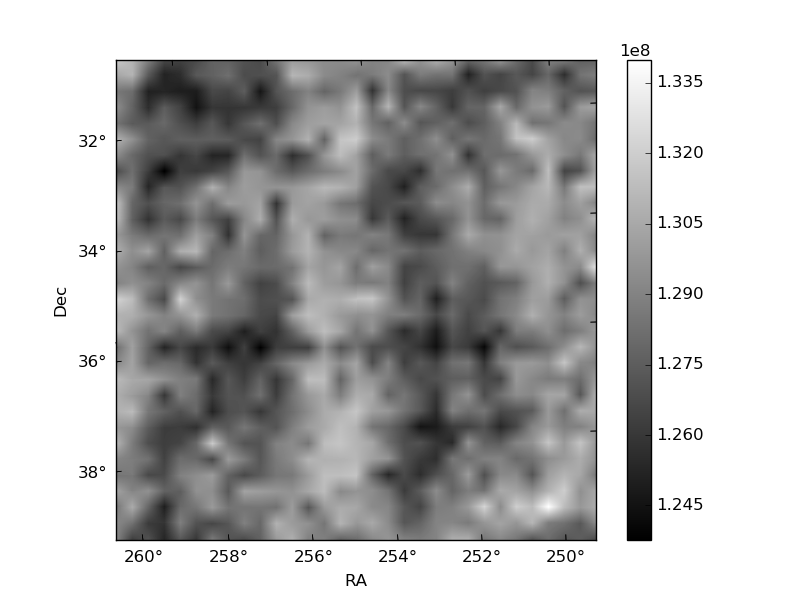
Histogram calculated using DETX and DETY for each event in the final _common_clean file
| Quadrant A | 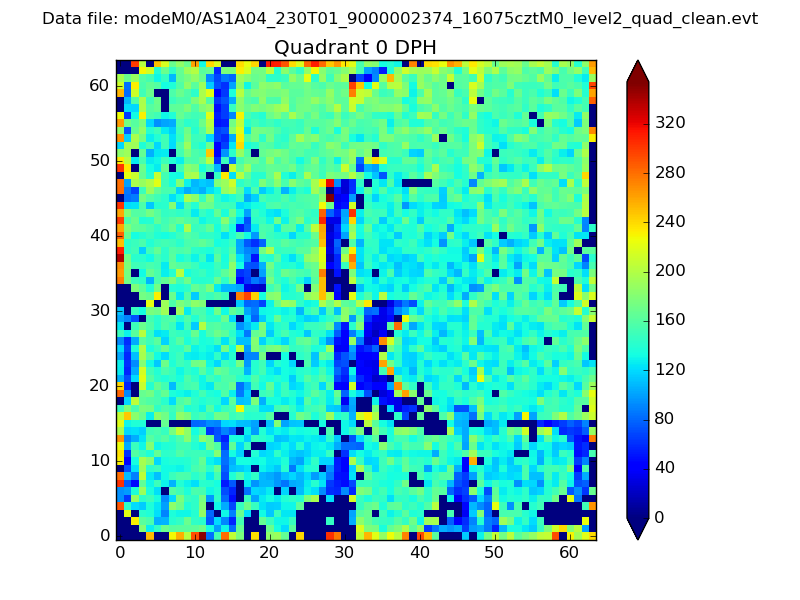 |
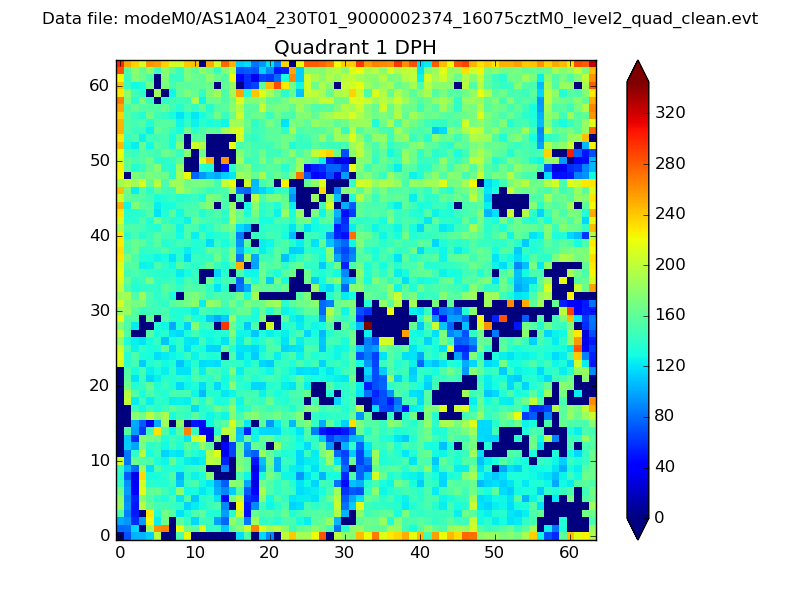 |
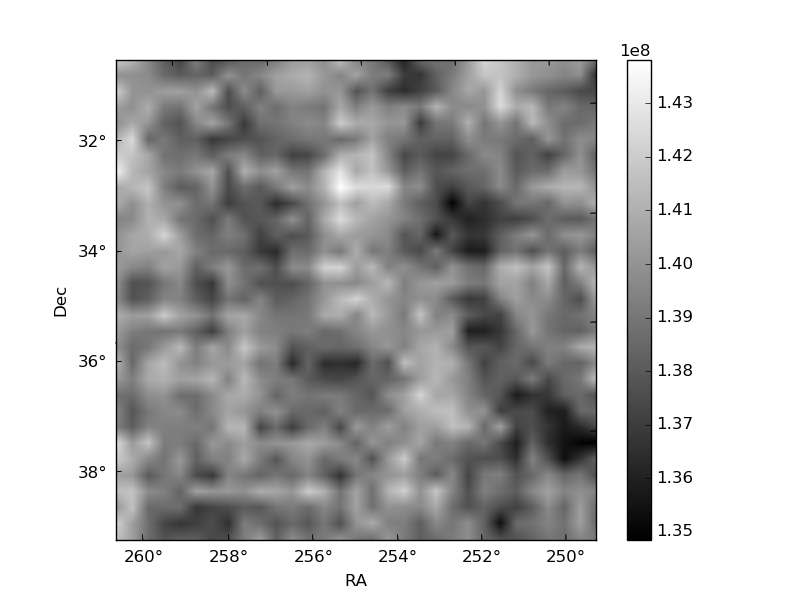
Quadrant B |
|---|---|---|---|
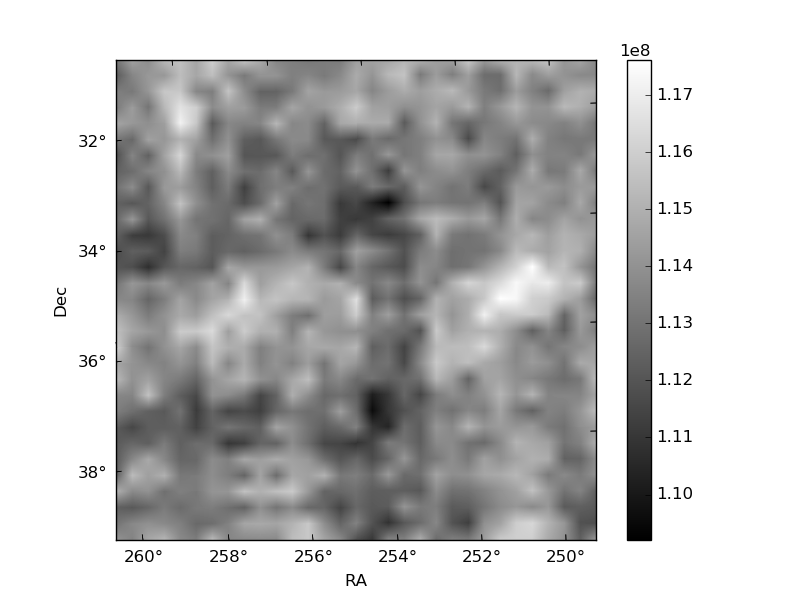
| Quadrant D | 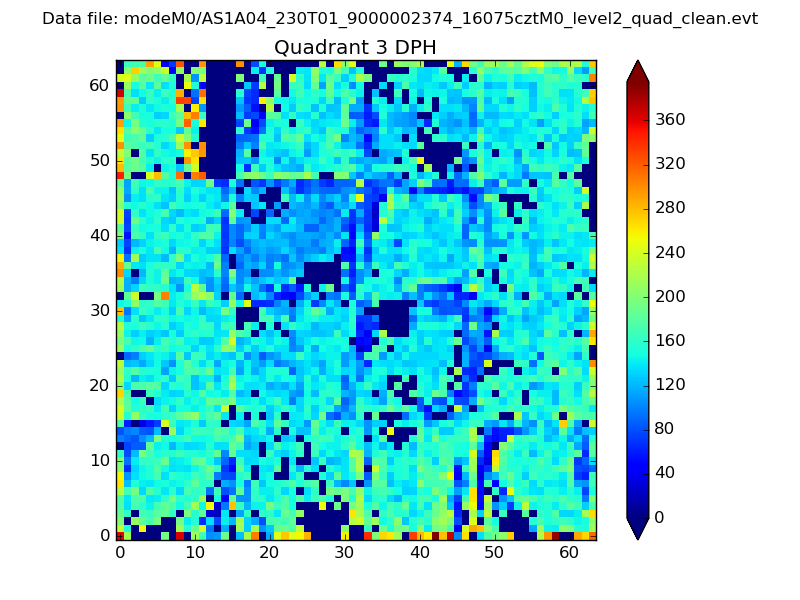 |
 |
Quadrant C |
| Plot type | Count rate plots | Images |
|---|---|---|
| Comparison with Poisson distribution Blue bars denote a histogram of data divided into 1 sec bins. Red curve is a Poisson curve with rate = median count rate of data. |
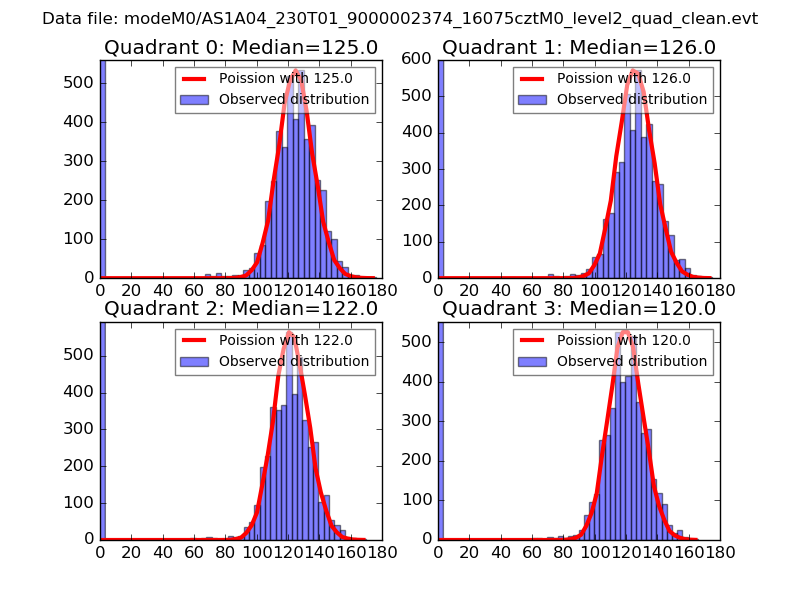 |
 |
| Quadrant-wise count rates Data is divided into 100 sec bins |
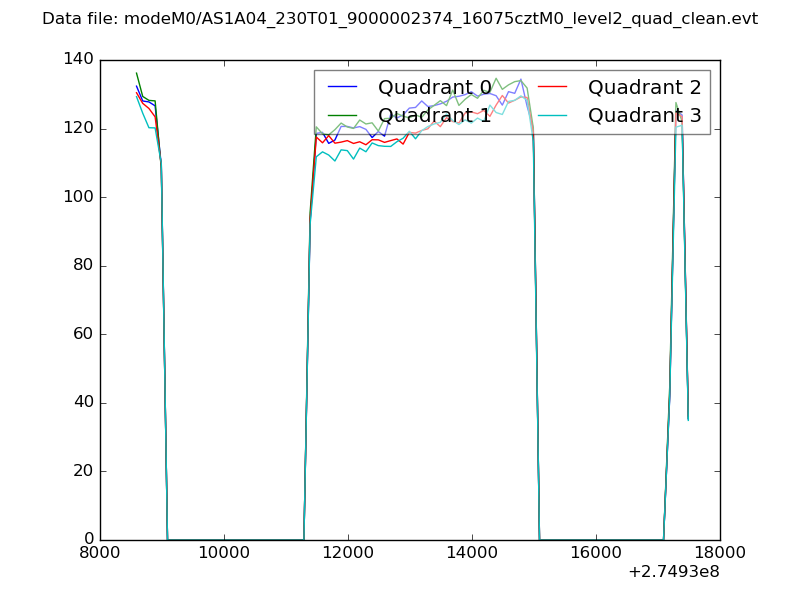 |
|
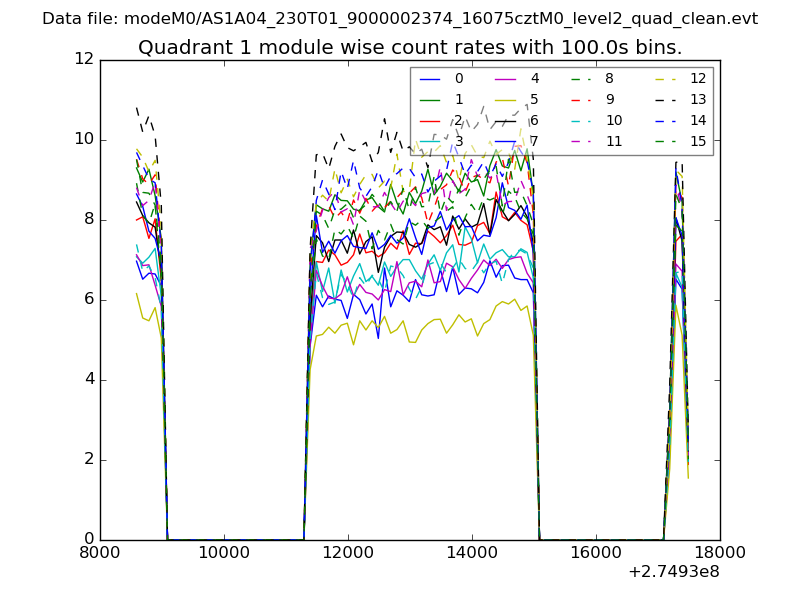
| Module-wise count rates for Quadrant A Data is divided into 100 sec bins |
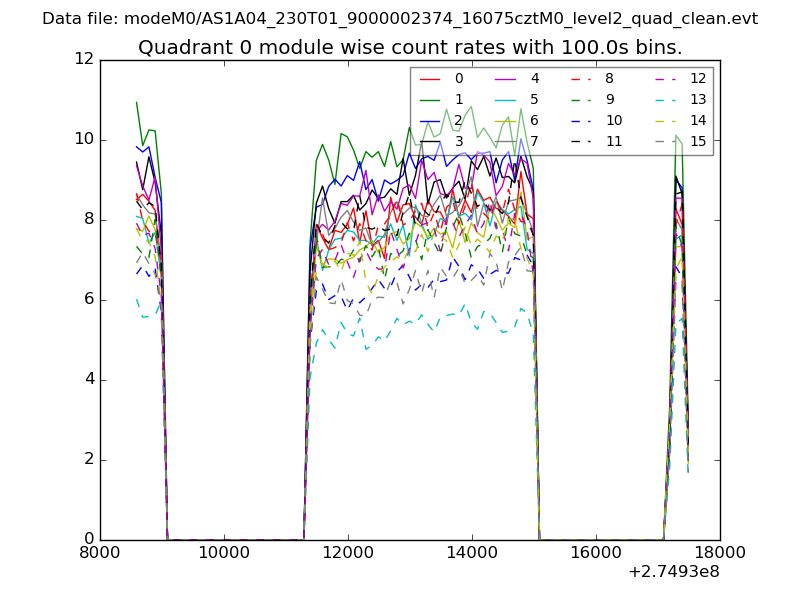 |
 |
| Module-wise count rates for Quadrant B Data is divided into 100 sec bins |
 |
 |
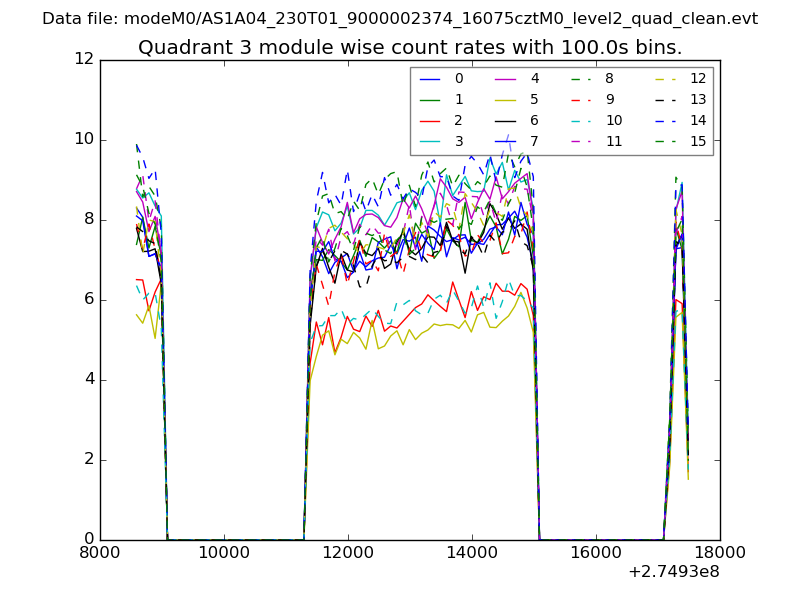
| Module-wise count rates for Quadrant C Data is divided into 100 sec bins |
 |
 |
| Module-wise count rates for Quadrant D Data is divided into 100 sec bins |
 |
 |
| Parameter | Plot |
|---|---|
| CZT HV Monitor | 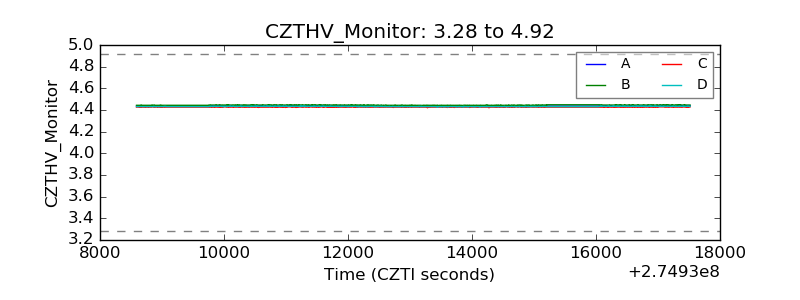 |
| D_VDD | 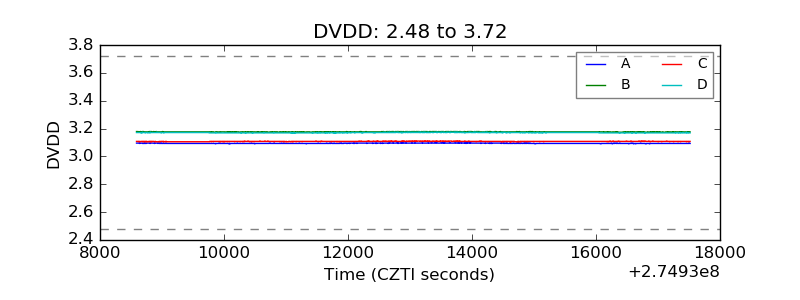 |
| Temperature 1 | 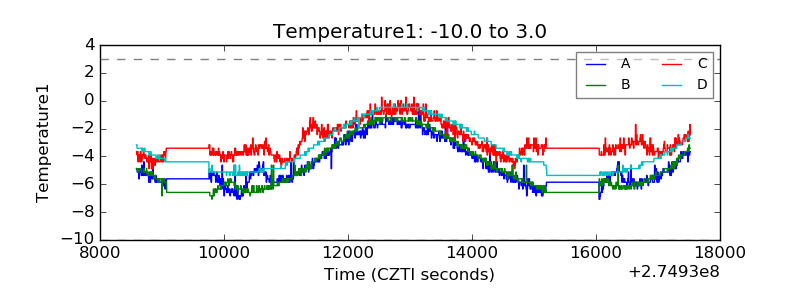 |
| Veto HV Monitor | 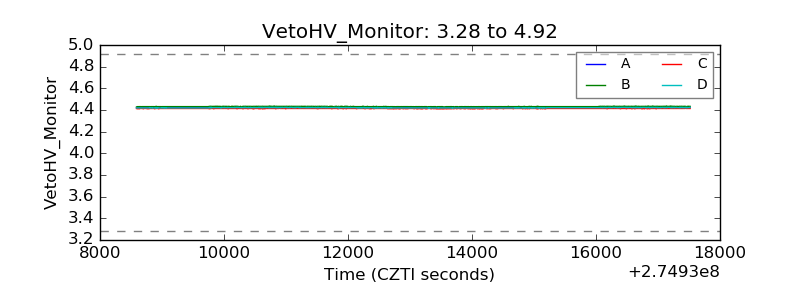 |
| Veto LLD | 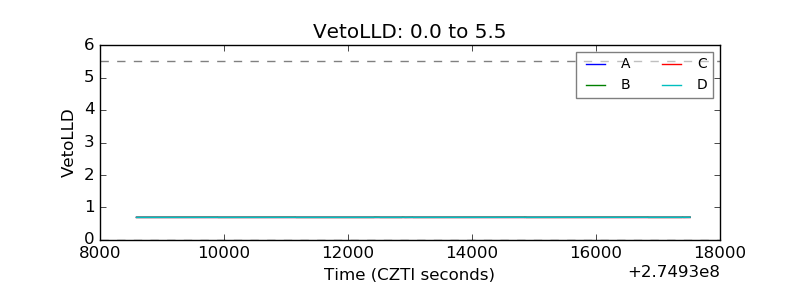 |
| Alpha Counter | 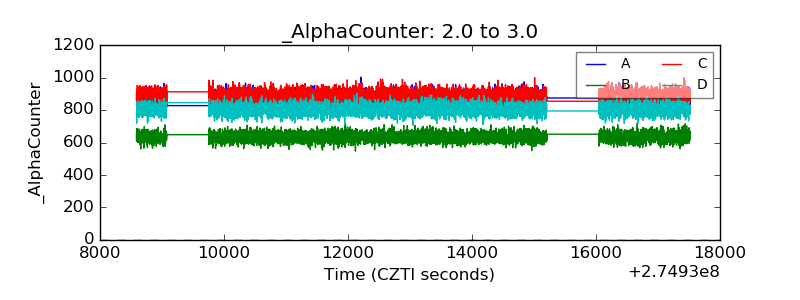 |
| _CPM_Rate | 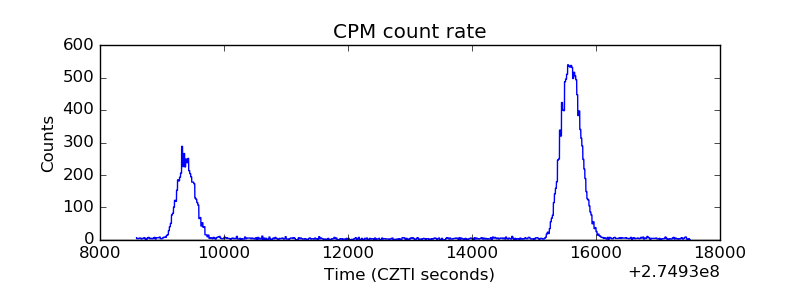 |
| CZT Counter | 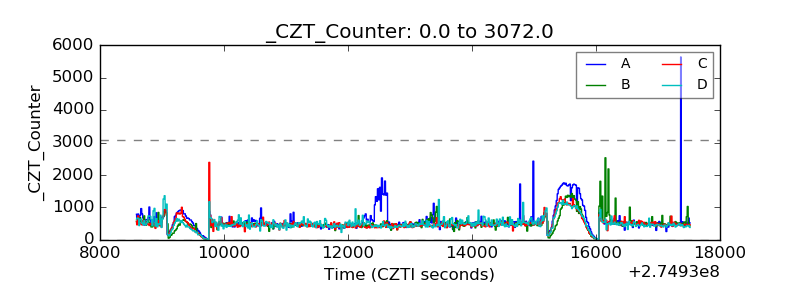 |
| +2.5 Volts monitor | 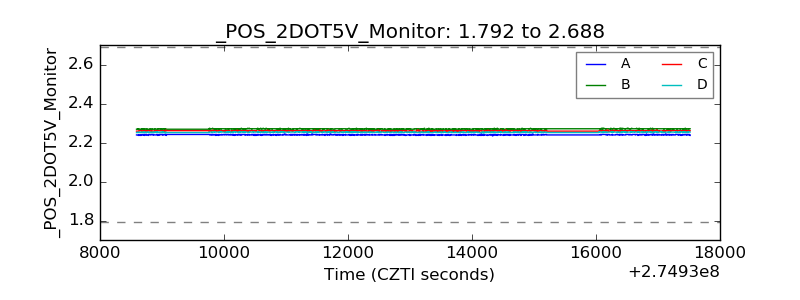 |
| +5 Volts monitor |  |
| _ROLL_ROT | 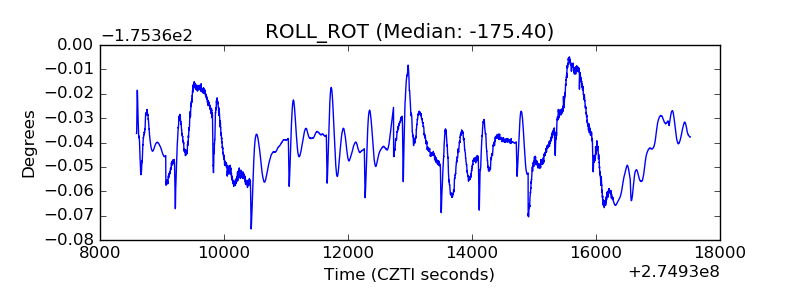 |
| _Roll_DEC | 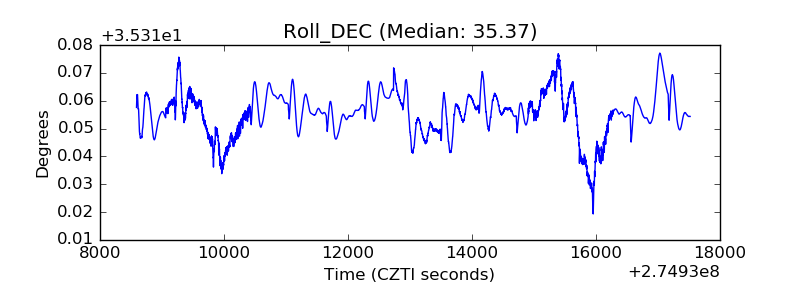 |
| _Roll_RA | 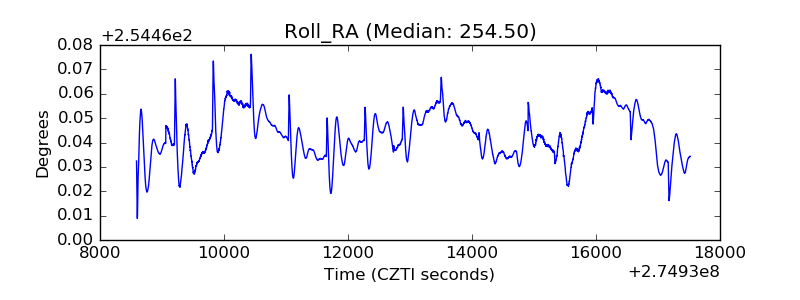 |
| Veto Counter | 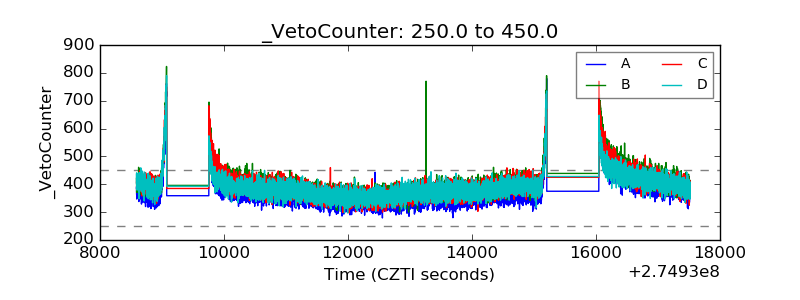 |