| Param | Original file | Final file |
|---|---|---|
| Filename | modeM0/AS1A04_230T01_9000002374_16078cztM0_level2.evt | modeM0/AS1A04_230T01_9000002374_16078cztM0_level2_quad_clean.evt |
| Size (bytes) | 413,078,400 | 96,448,320 |
| Size | 393.9 MB | 92.0 MB |
| Events in quadrant A | 3,017,199 | 645,153 |
| Events in quadrant B | 3,099,517 | 641,881 |
| Events in quadrant C | 2,965,693 | 605,403 |
| Events in quadrant D | 3,013,865 | 603,610 |
| Mode M9 | |||
|---|---|---|---|
| Quadrant | BADHDUFLAG | Total packets | Discarded packets |
| A | 0 | 11 | 0 |
| B | 0 | 11 | 0 |
| C | 0 | 11 | 0 |
| D | 0 | 11 | 0 |
| Mode SS | |||
|---|---|---|---|
| Quadrant | BADHDUFLAG | Total packets | Discarded packets |
| A | 0 | 122 | 0 |
| B | 0 | 122 | 0 |
| C | 0 | 122 | 0 |
| D | 0 | 122 | 0 |
| Mode M0 | |||
|---|---|---|---|
| Quadrant | BADHDUFLAG | Total packets | Discarded packets |
| A | 0 | 12873 | 2 |
| B | 0 | 12924 | 1 |
| C | 0 | 12660 | 1 |
| D | 0 | 13024 | 1 |
| Quadrant | Total seconds | Saturated seconds | Saturation percentage |
|---|---|---|---|
| A | 6085 | 43 | 0.706656% |
| B | 6085 | 50 | 0.821693% |
| C | 6085 | 57 | 0.936730% |
| D | 6085 | 31 | 0.509449% |
Noise dominated data is calculated using 1-second bins in cleaned event files. If a bin has >2000 counts, and if more than 50% of those come from <1% of pixels, then it is considered to be noise-dominated and hence unusable.
| Quadrant | # 1 sec bins | Bins with >0 counts | Bins with >2000 counts | High rate bins dominated by noise | Noise dominated (total time) | Noise dominated (detector-on time) | Marked lightcurve |
|---|---|---|---|---|---|---|---|
| A | 7206 | 6086 | 4 | 4 | 0.06% | 0.07% | 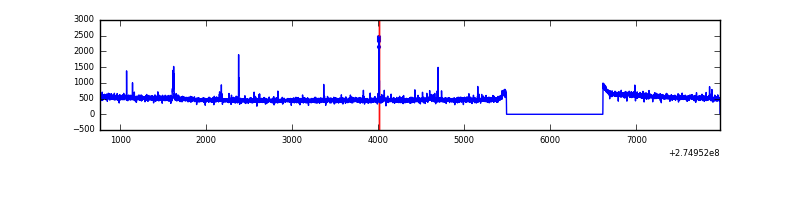 |
| B | 7206 | 6086 | 4 | 4 | 0.06% | 0.07% | 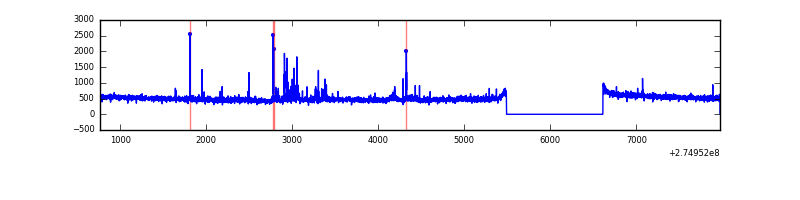 |
| C | 7206 | 6086 | 0 | 0 | 0.00% | 0.00% | 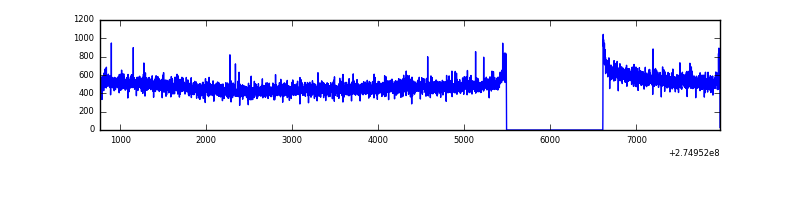 |
| D | 7206 | 6086 | 6 | 6 | 0.08% | 0.10% | 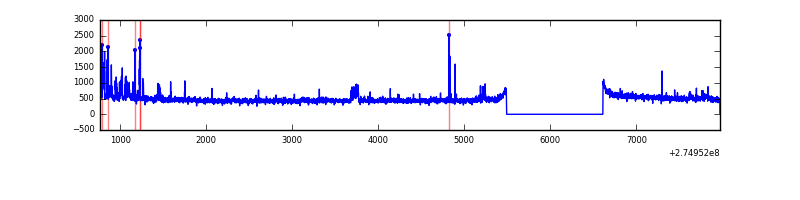 |
Top three noisy pixels from each quadrant. If the there are fewer than three noisy pixels in the level2.evt file, extra rows are filled as -1
| Pixel properties | Quadrant properties | ||||||
|---|---|---|---|---|---|---|---|
| Quadrant | DetID | PixID | Counts | Sigma | Mean | Median | Sigma |
| A | 15 | 174 | 25745 | 160.63 | 771 | 755 | 155.6 |
| A | 9 | 143 | 24428 | 152.17 | 771 | 755 | 155.6 |
| A | 0 | 226 | 6985 | 40.05 | 771 | 755 | 155.6 |
| B | 0 | 190 | 32239 | 217.64 | 761 | 743 | 144.7 |
| B | 7 | 220 | 31534 | 212.77 | 761 | 743 | 144.7 |
| B | 12 | 111 | 16102 | 106.13 | 761 | 743 | 144.7 |
| C | 14 | 238 | 112481 | 662.98 | 722 | 730 | 168.6 |
| C | 3 | 233 | 24937 | 143.61 | 722 | 730 | 168.6 |
| C | 10 | 22 | 6685 | 35.33 | 722 | 730 | 168.6 |
| D | 13 | 104 | 137142 | 753.23 | 744 | 722 | 181.1 |
| D | 2 | 234 | 25837 | 138.67 | 744 | 722 | 181.1 |
| D | 12 | 110 | 22748 | 121.61 | 744 | 722 | 181.1 |
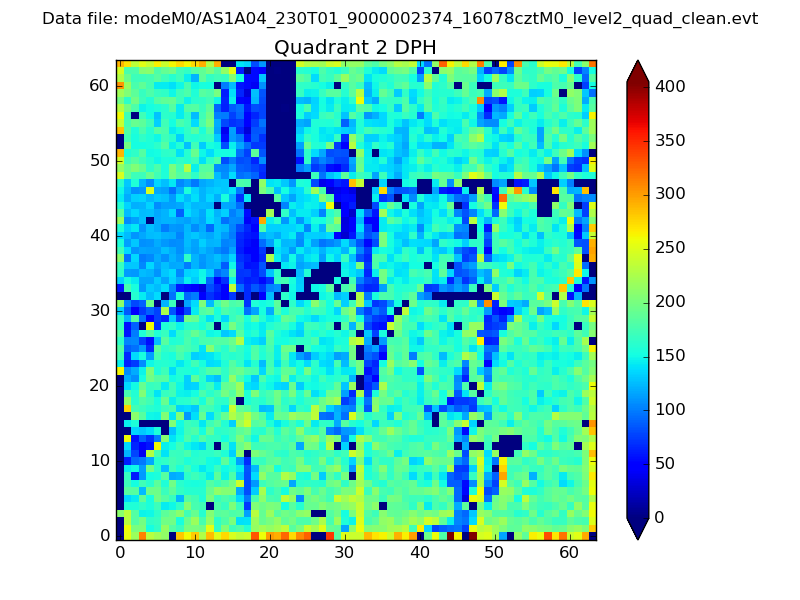
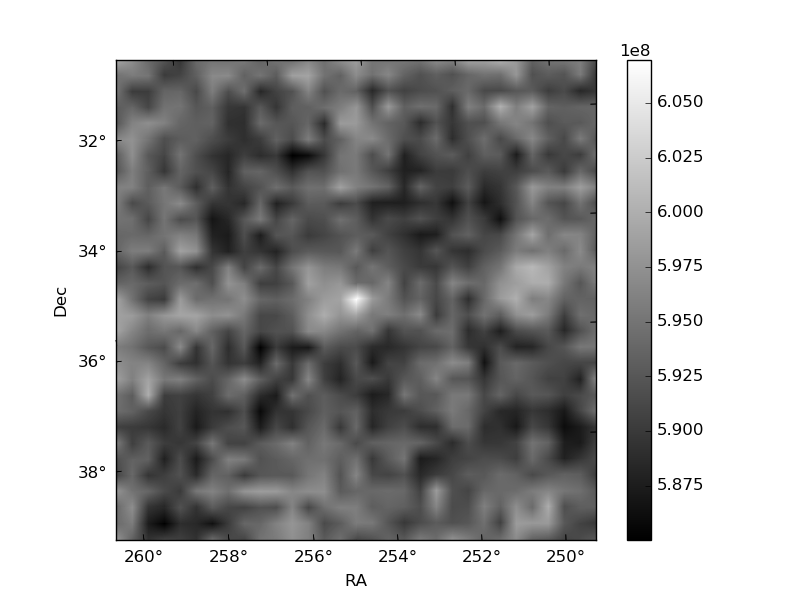
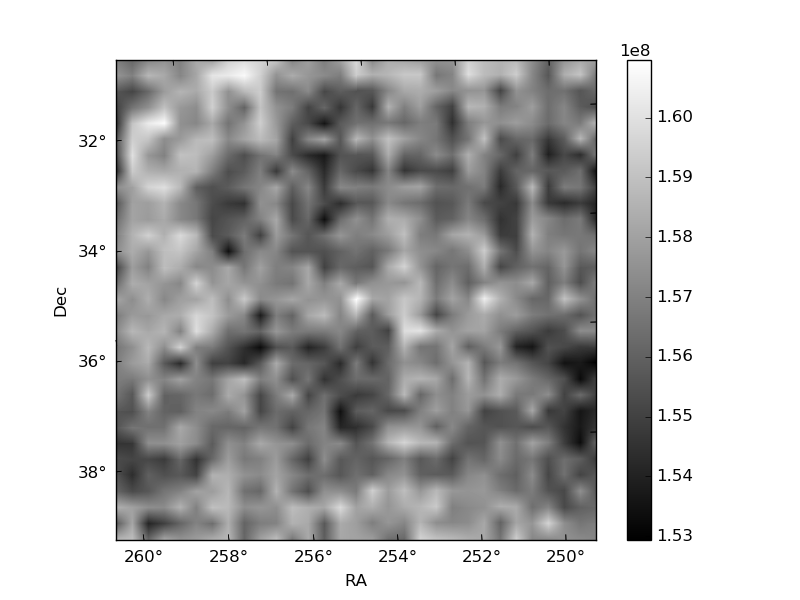
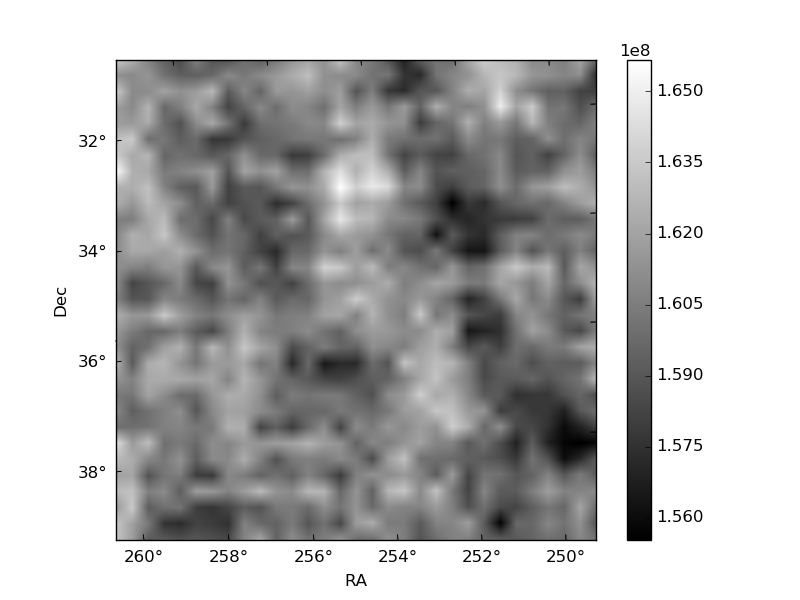
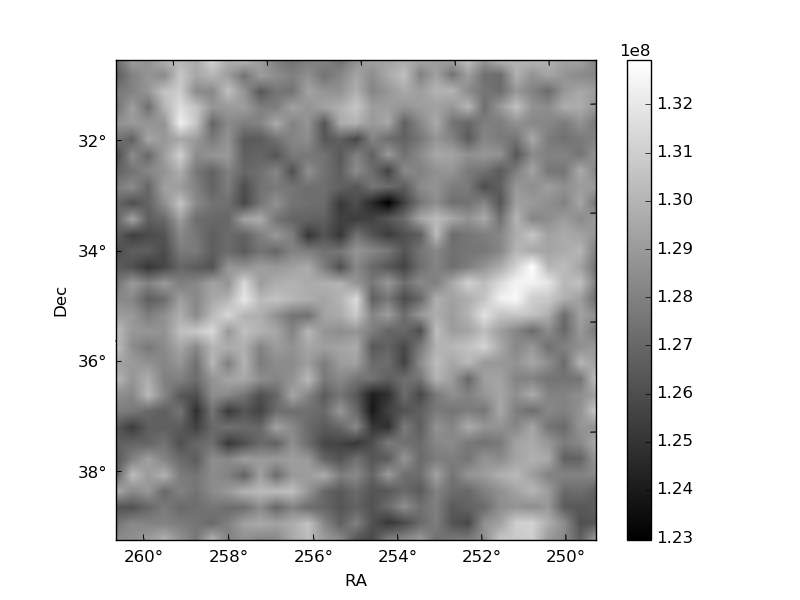
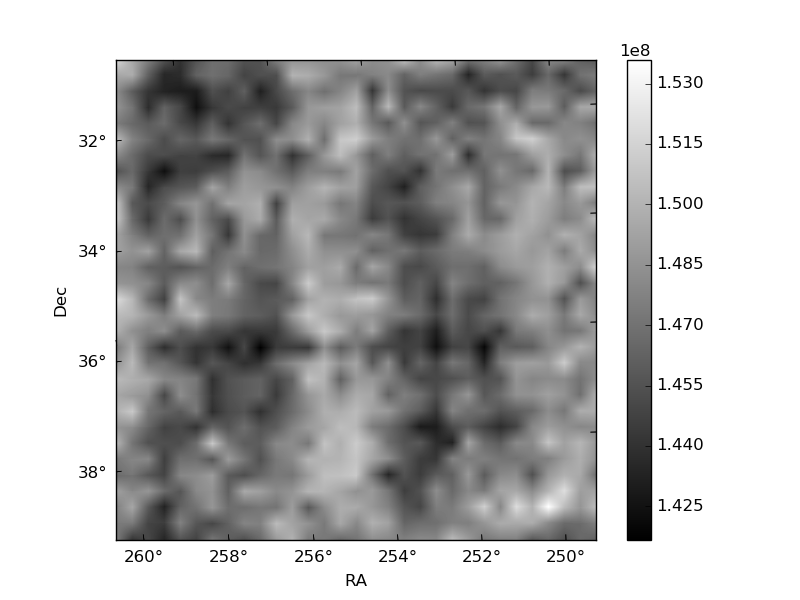
Histogram calculated using DETX and DETY for each event in the final _common_clean file
| Quadrant A | 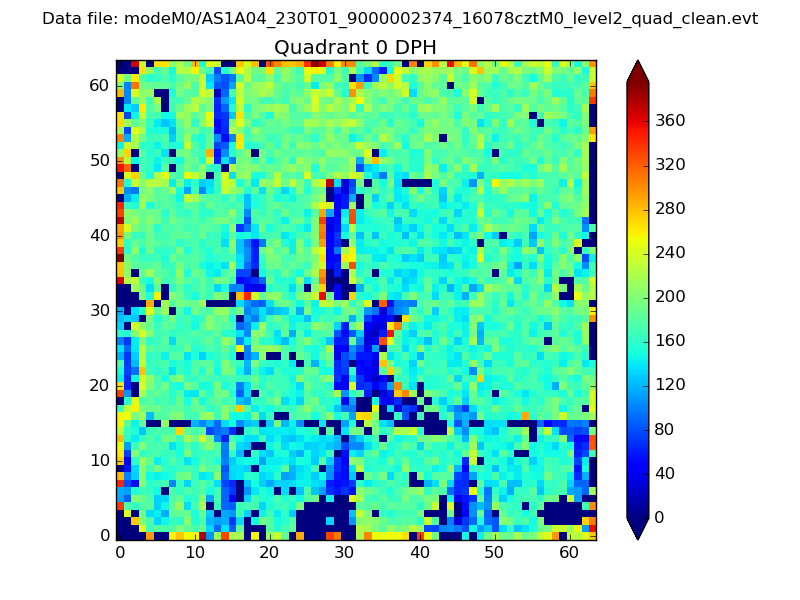 |
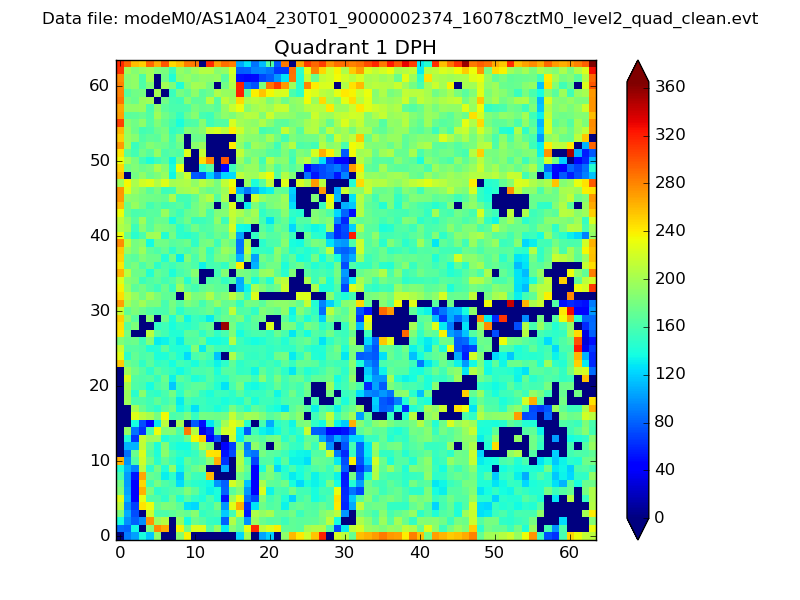 |
Quadrant B |
|---|---|---|---|
| Quadrant D | 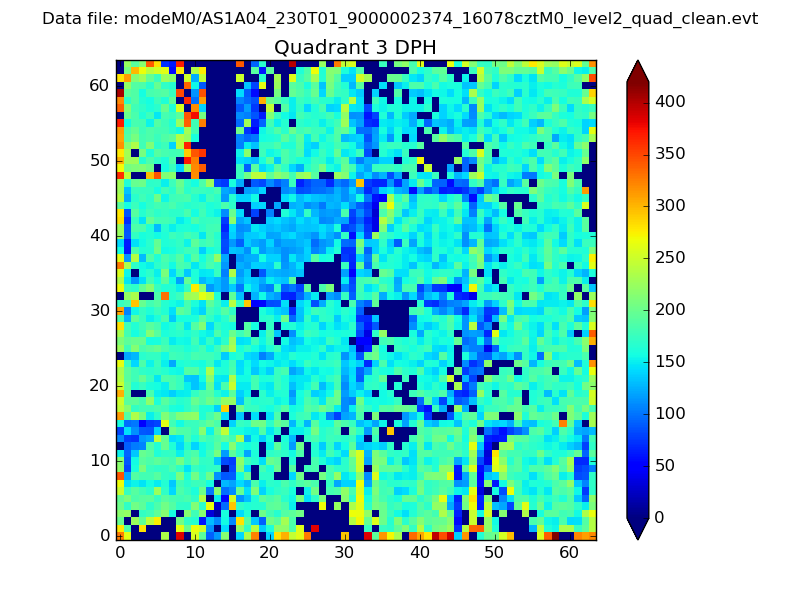 |
 |
Quadrant C |
| Plot type | Count rate plots | Images |
|---|---|---|
| Comparison with Poisson distribution Blue bars denote a histogram of data divided into 1 sec bins. Red curve is a Poisson curve with rate = median count rate of data. |
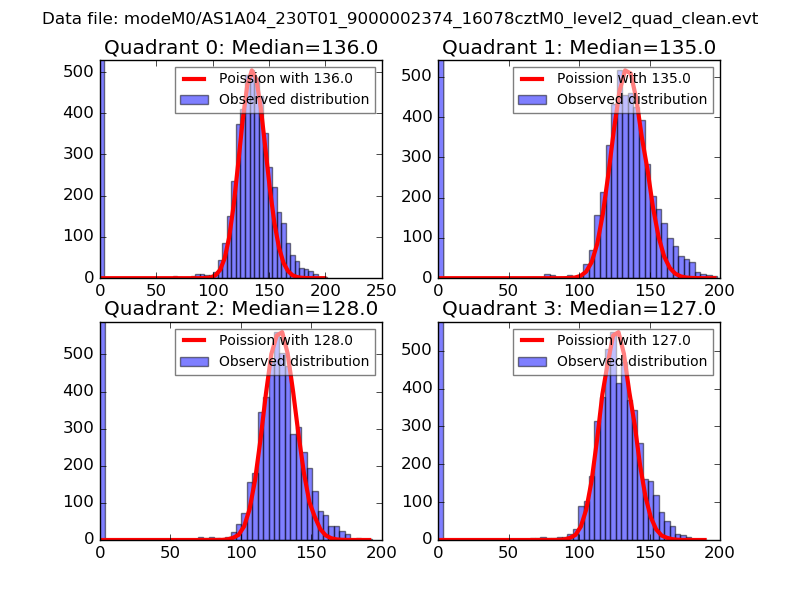 |
 |
| Quadrant-wise count rates Data is divided into 100 sec bins |
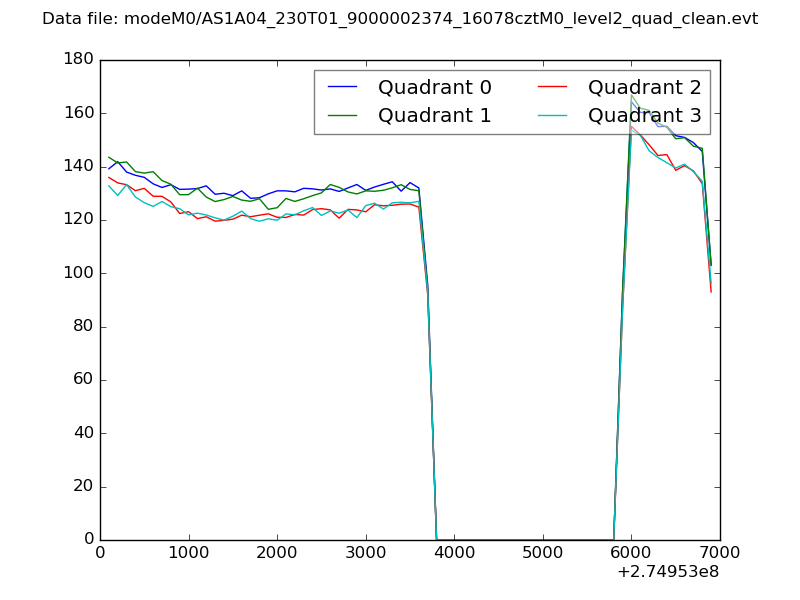 |
|
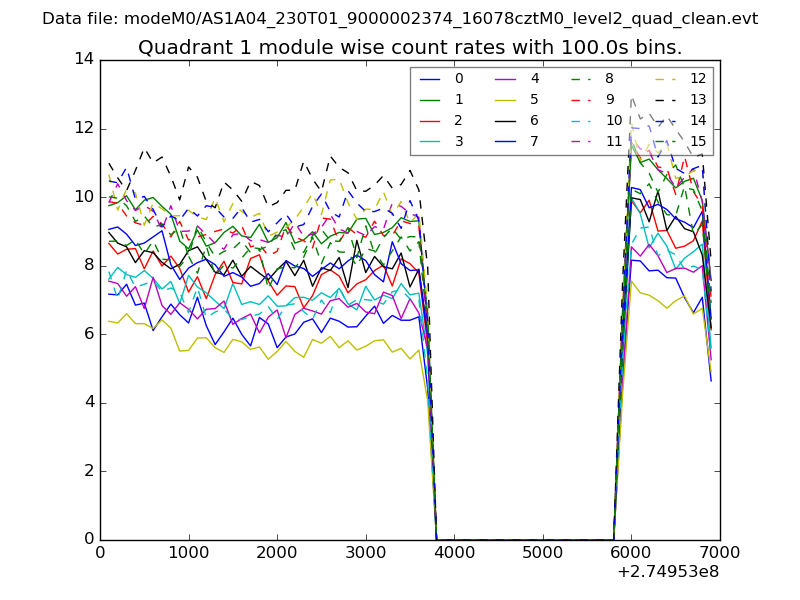
| Module-wise count rates for Quadrant A Data is divided into 100 sec bins |
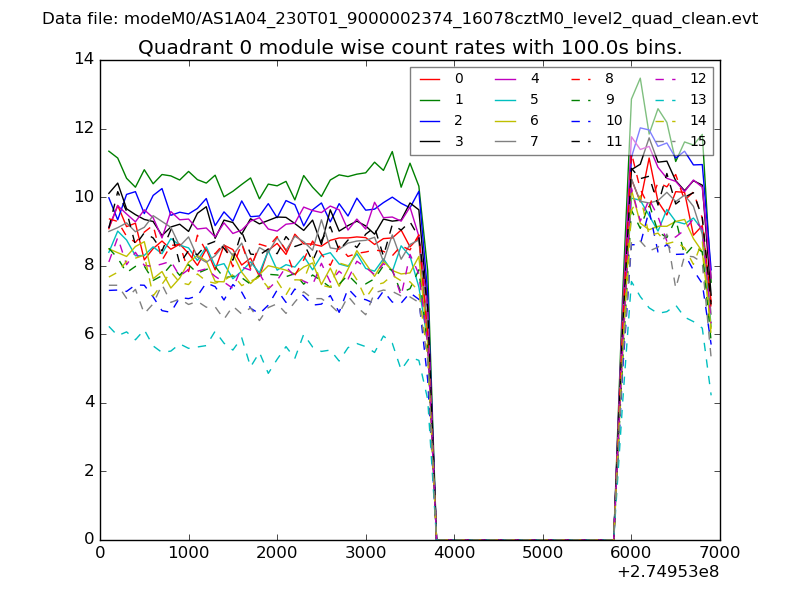 |
 |
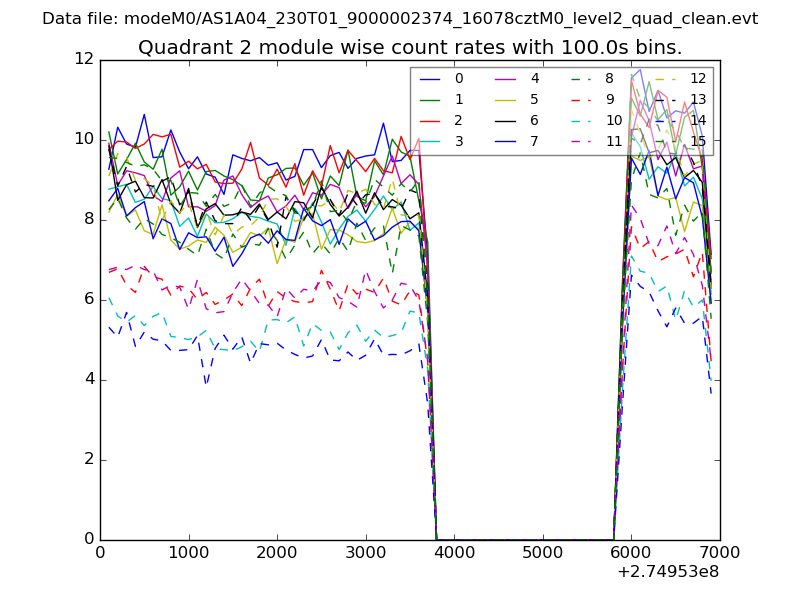
| Module-wise count rates for Quadrant B Data is divided into 100 sec bins |
 |
 |
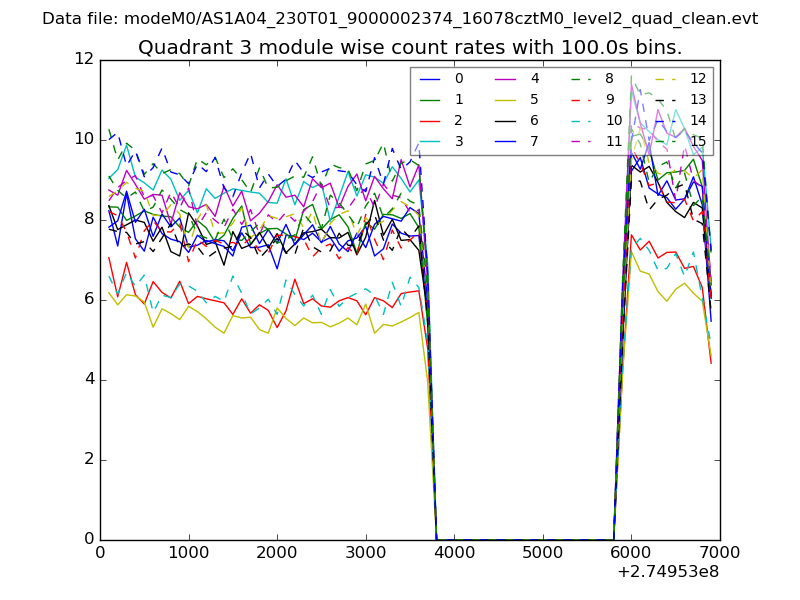
| Module-wise count rates for Quadrant C Data is divided into 100 sec bins |
 |
 |
| Module-wise count rates for Quadrant D Data is divided into 100 sec bins |
 |
 |
| Parameter | Plot |
|---|---|
| CZT HV Monitor | 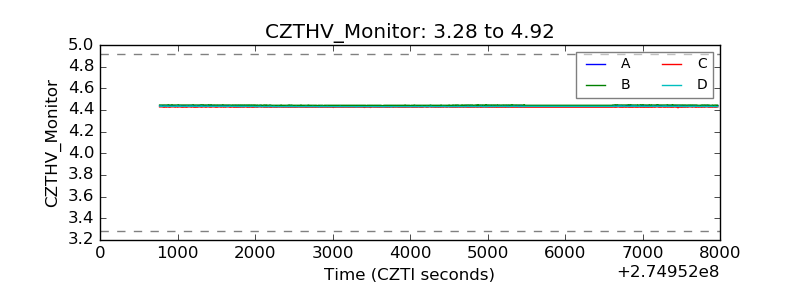 |
| D_VDD | 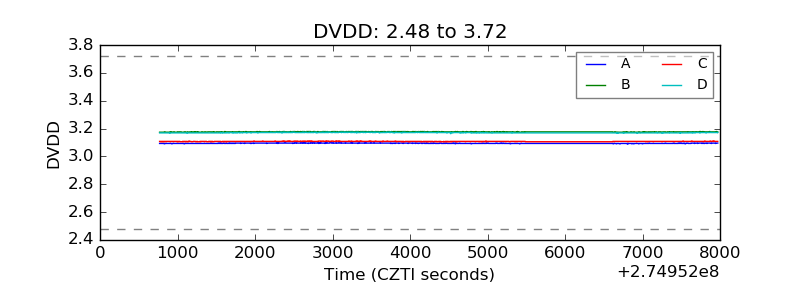 |
| Temperature 1 | 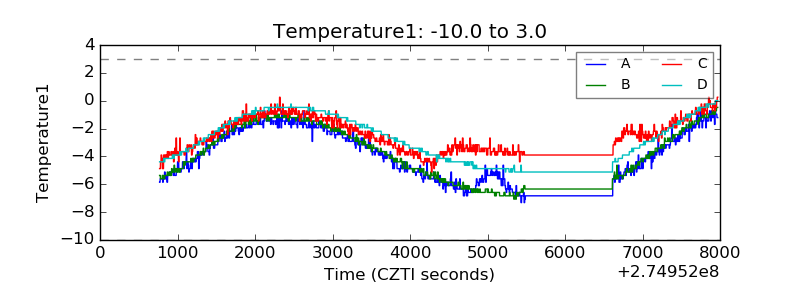 |
| Veto HV Monitor | 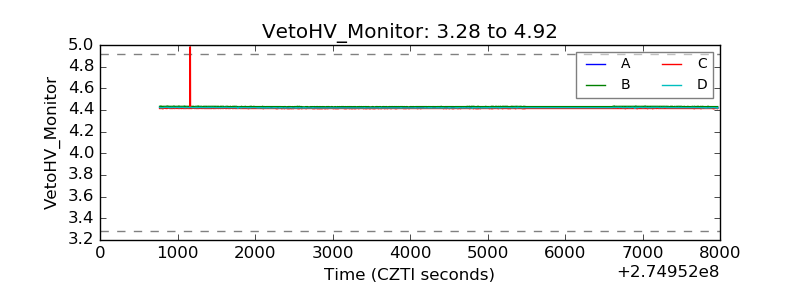 |
| Veto LLD | 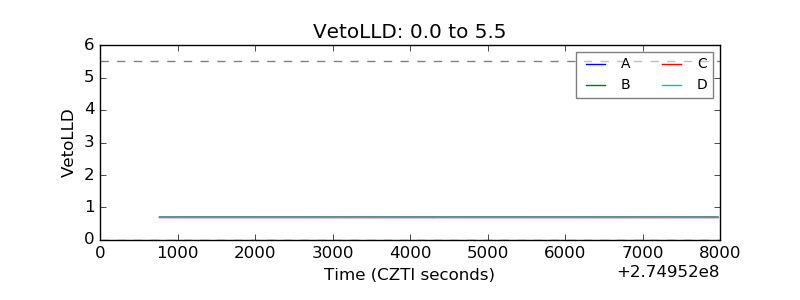 |
| Alpha Counter | 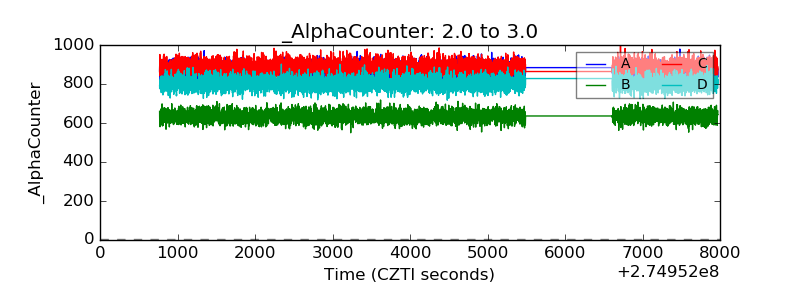 |
| _CPM_Rate | 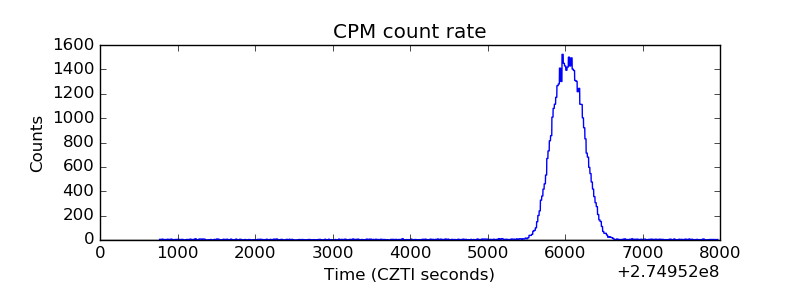 |
| CZT Counter | 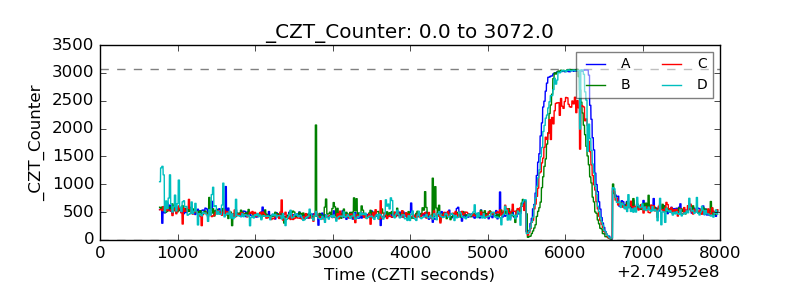 |
| +2.5 Volts monitor |  |
| +5 Volts monitor | 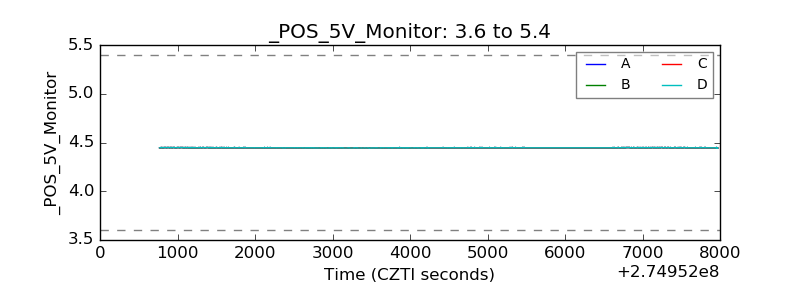 |
| _ROLL_ROT | 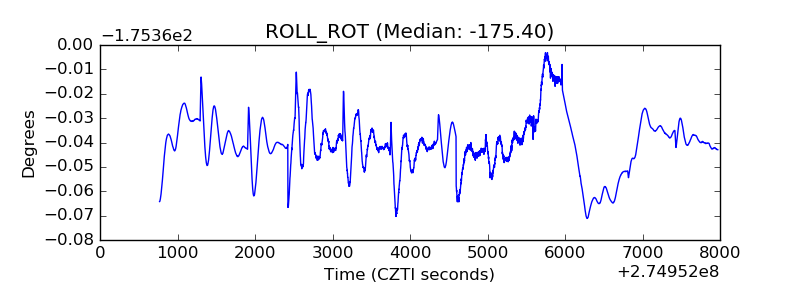 |
| _Roll_DEC | 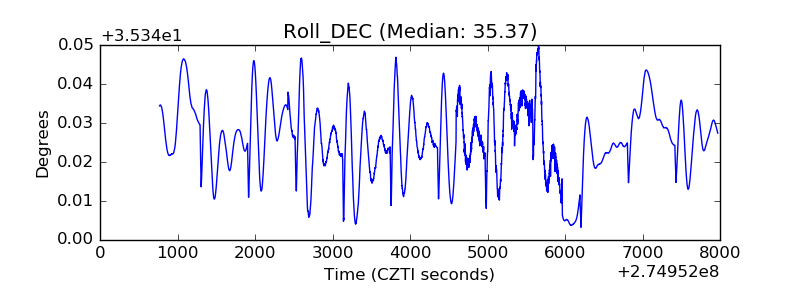 |
| _Roll_RA | 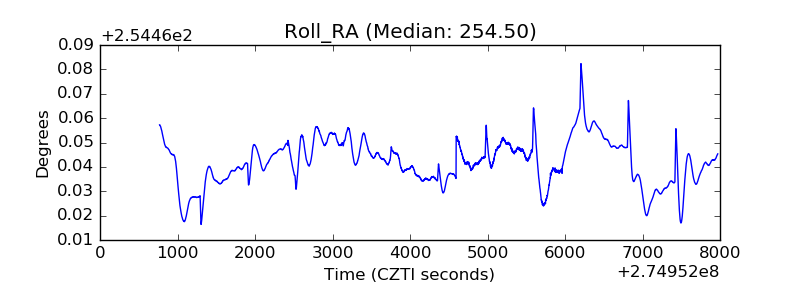 |
| Veto Counter | 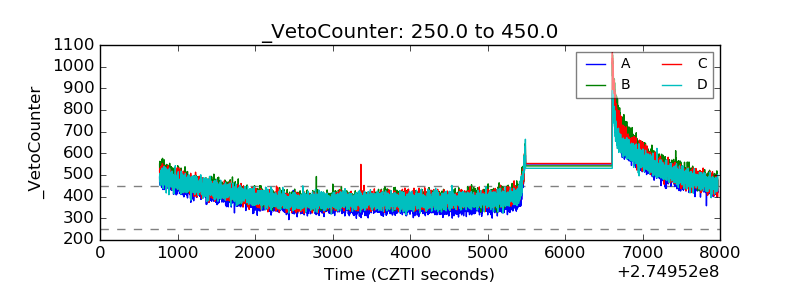 |