| Param | Original file | Final file |
|---|---|---|
| Filename | modeM0/AS1A04_230T01_9000002374_16080cztM0_level2.evt | modeM0/AS1A04_230T01_9000002374_16080cztM0_level2_quad_clean.evt |
| Size (bytes) | 478,569,600 | 102,720,960 |
| Size | 456.4 MB | 98.0 MB |
| Events in quadrant A | 3,232,618 | 707,730 |
| Events in quadrant B | 3,482,199 | 701,814 |
| Events in quadrant C | 3,229,383 | 653,547 |
| Events in quadrant D | 4,138,671 | 625,414 |
| Mode M9 | |||
|---|---|---|---|
| Quadrant | BADHDUFLAG | Total packets | Discarded packets |
| A | 0 | 13 | 0 |
| B | 0 | 13 | 0 |
| C | 0 | 13 | 0 |
| D | 0 | 13 | 0 |
| Mode SS | |||
|---|---|---|---|
| Quadrant | BADHDUFLAG | Total packets | Discarded packets |
| A | 0 | 122 | 0 |
| B | 0 | 122 | 0 |
| C | 0 | 122 | 0 |
| D | 0 | 122 | 0 |
| Mode M0 | |||
|---|---|---|---|
| Quadrant | BADHDUFLAG | Total packets | Discarded packets |
| A | 0 | 13375 | 2 |
| B | 0 | 14150 | 1 |
| C | 0 | 13263 | 1 |
| D | 0 | 16071 | 1 |
| Quadrant | Total seconds | Saturated seconds | Saturation percentage |
|---|---|---|---|
| A | 6050 | 128 | 2.115702% |
| B | 6050 | 108 | 1.785124% |
| C | 6050 | 101 | 1.669421% |
| D | 6050 | 435 | 7.190083% |
Noise dominated data is calculated using 1-second bins in cleaned event files. If a bin has >2000 counts, and if more than 50% of those come from <1% of pixels, then it is considered to be noise-dominated and hence unusable.
| Quadrant | # 1 sec bins | Bins with >0 counts | Bins with >2000 counts | High rate bins dominated by noise | Noise dominated (total time) | Noise dominated (detector-on time) | Marked lightcurve |
|---|---|---|---|---|---|---|---|
| A | 7321 | 6051 | 29 | 29 | 0.40% | 0.48% | 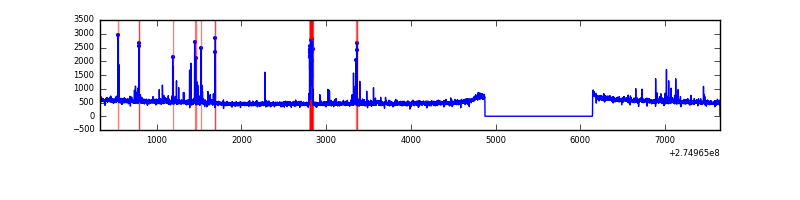 |
| B | 7321 | 6051 | 22 | 22 | 0.30% | 0.36% | 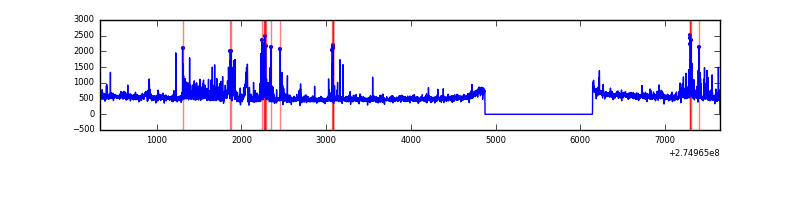 |
| C | 7321 | 6051 | 4 | 4 | 0.05% | 0.07% | 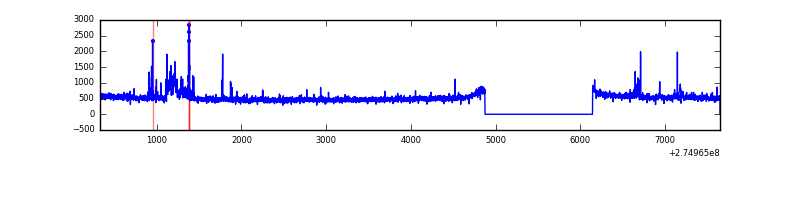 |
| D | 7321 | 6051 | 291 | 291 | 3.97% | 4.81% | 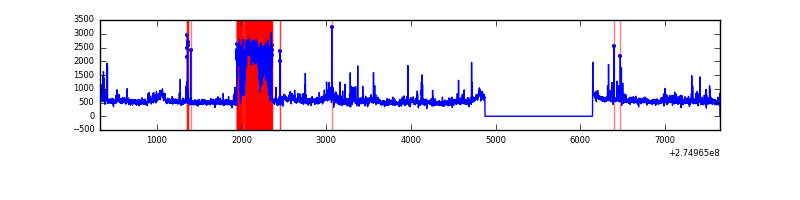 |
Top three noisy pixels from each quadrant. If the there are fewer than three noisy pixels in the level2.evt file, extra rows are filled as -1
| Pixel properties | Quadrant properties | ||||||
|---|---|---|---|---|---|---|---|
| Quadrant | DetID | PixID | Counts | Sigma | Mean | Median | Sigma |
| A | 12 | 96 | 115208 | 717.38 | 791 | 776 | 159.5 |
| A | 15 | 174 | 27474 | 167.37 | 791 | 776 | 159.5 |
| A | 15 | 239 | 27295 | 166.25 | 791 | 776 | 159.5 |
| B | 7 | 220 | 166476 | 1142.22 | 781 | 763 | 145.1 |
| B | 0 | 190 | 90039 | 615.36 | 781 | 763 | 145.1 |
| B | 0 | 189 | 43487 | 294.49 | 781 | 763 | 145.1 |
| C | 0 | 207 | 169477 | 986.12 | 742 | 749 | 171.1 |
| C | 14 | 238 | 113563 | 659.34 | 742 | 749 | 171.1 |
| C | 7 | 247 | 23328 | 131.96 | 742 | 749 | 171.1 |
| D | 12 | 218 | 756564 | 4172.41 | 746 | 724 | 181.2 |
| D | 1 | 52 | 336830 | 1855.38 | 746 | 724 | 181.2 |
| D | 5 | 222 | 114389 | 627.46 | 746 | 724 | 181.2 |
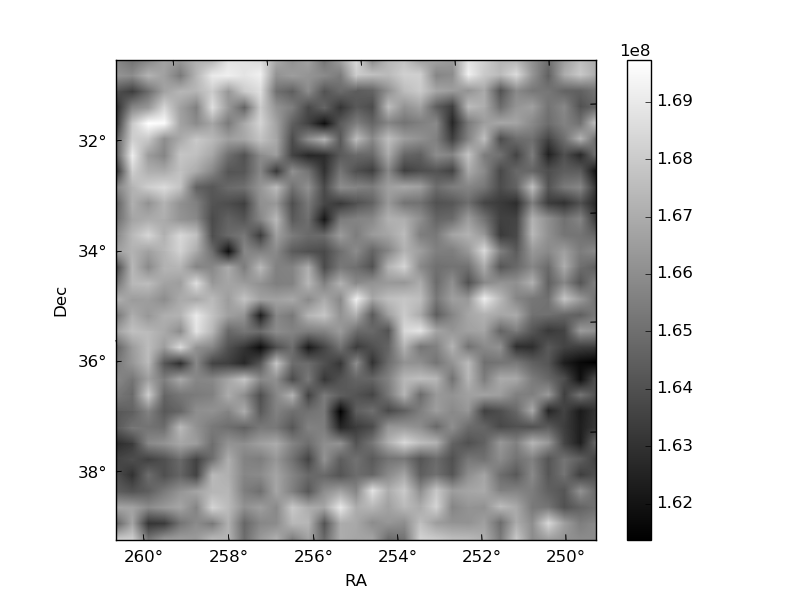
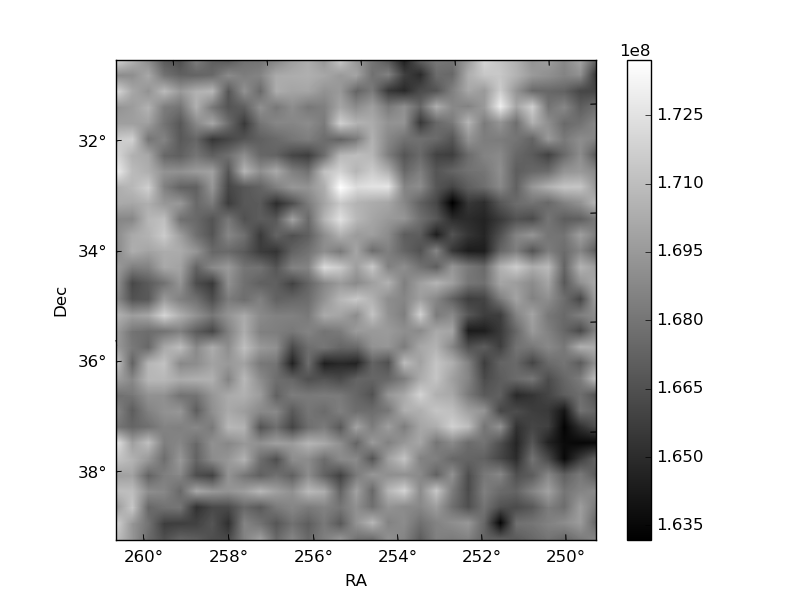
Histogram calculated using DETX and DETY for each event in the final _common_clean file
| Quadrant A |  |
 |
Quadrant B |
|---|---|---|---|
| Quadrant D |  |
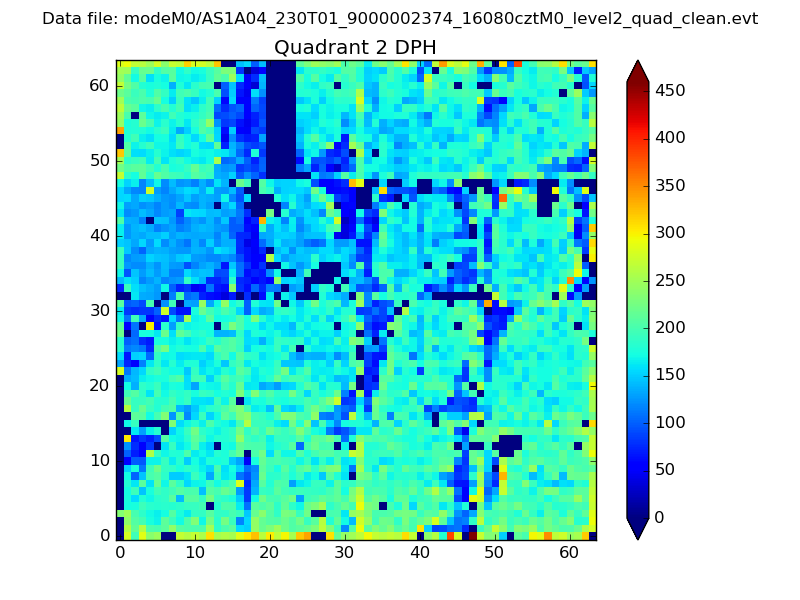 |
Quadrant C |
| Plot type | Count rate plots | Images |
|---|---|---|
| Comparison with Poisson distribution Blue bars denote a histogram of data divided into 1 sec bins. Red curve is a Poisson curve with rate = median count rate of data. |
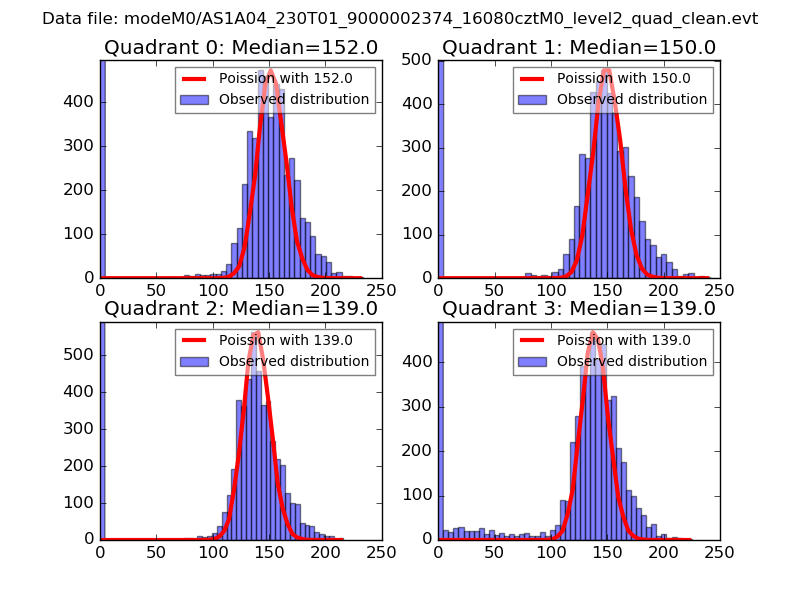 |
 |
| Quadrant-wise count rates Data is divided into 100 sec bins |
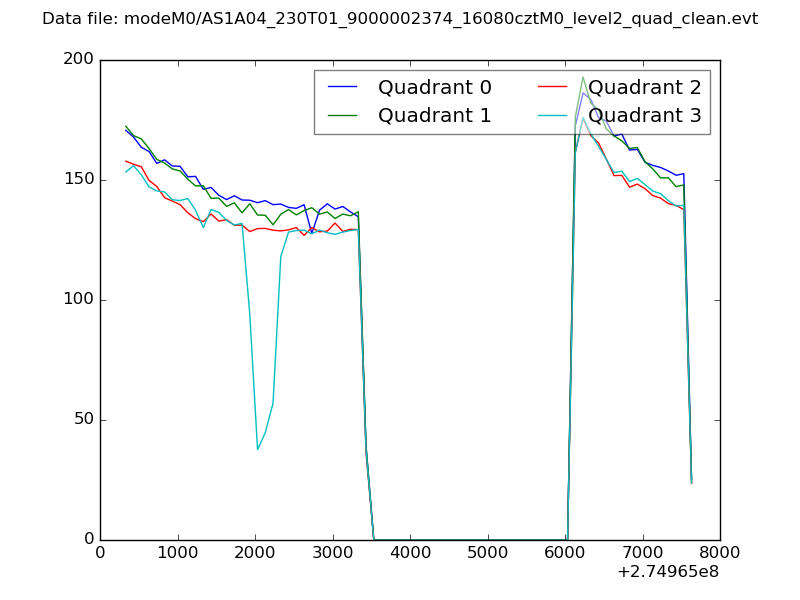 |
|
| Module-wise count rates for Quadrant A Data is divided into 100 sec bins |
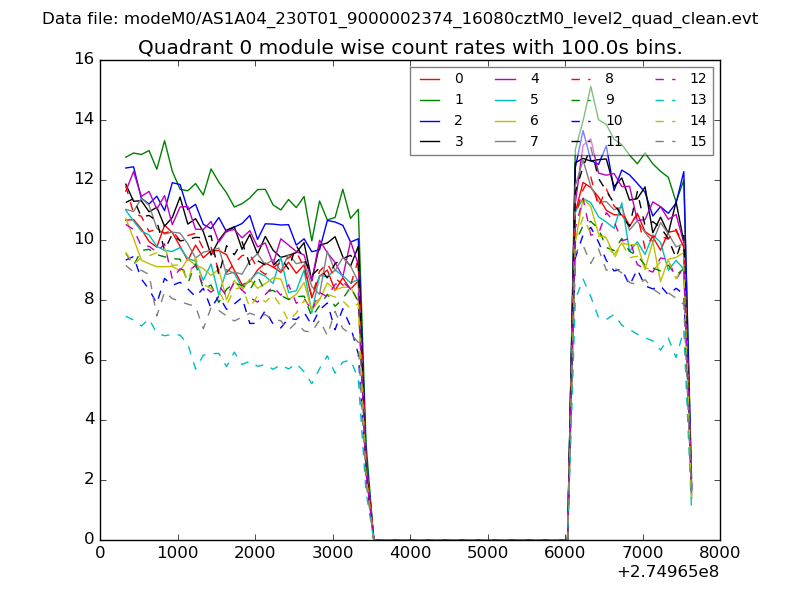 |
 |
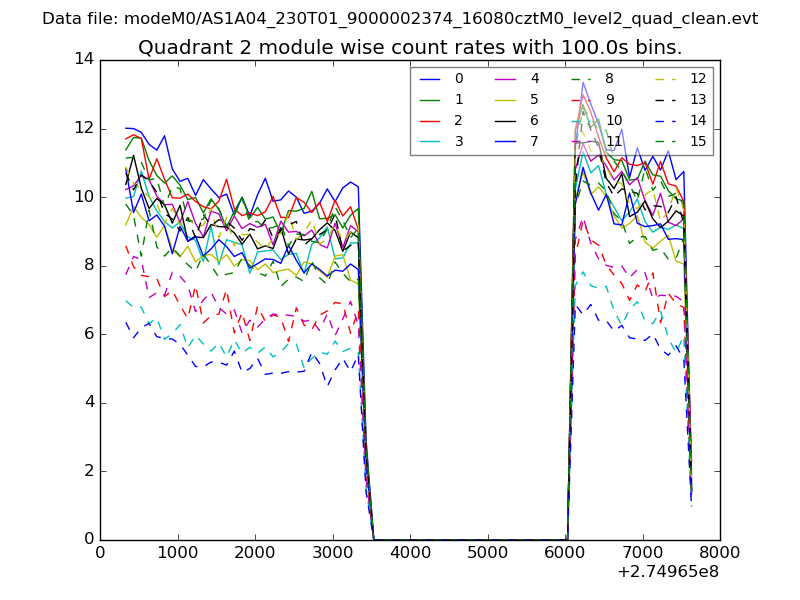
| Module-wise count rates for Quadrant B Data is divided into 100 sec bins |
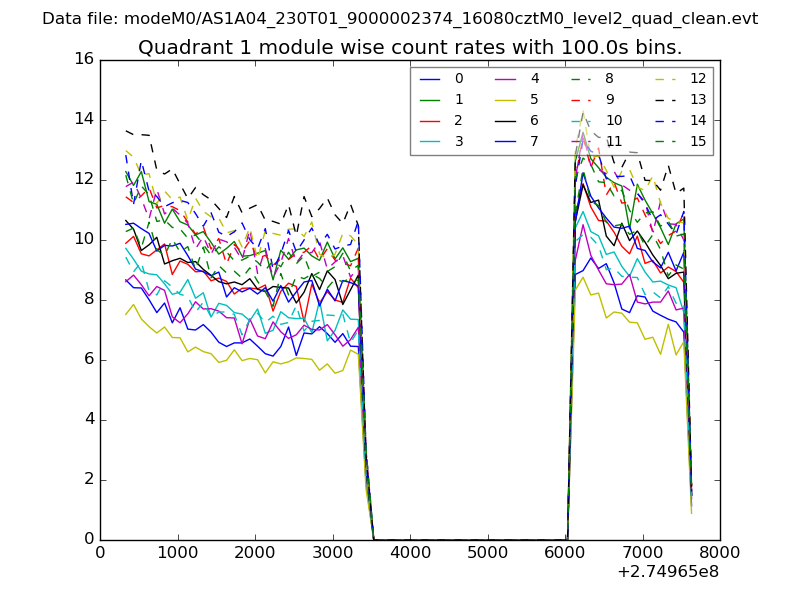 |
 |
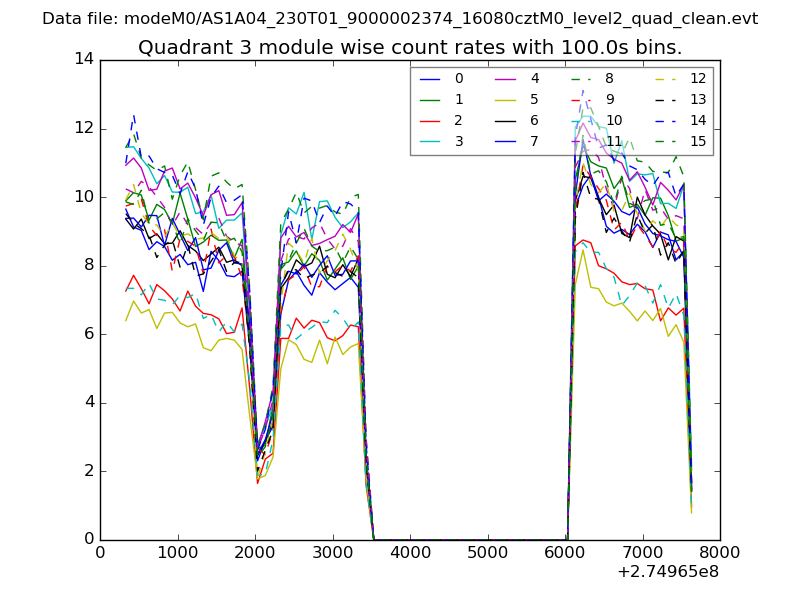
| Module-wise count rates for Quadrant C Data is divided into 100 sec bins |
 |
 |
| Module-wise count rates for Quadrant D Data is divided into 100 sec bins |
 |
 |
| Parameter | Plot |
|---|---|
| CZT HV Monitor | 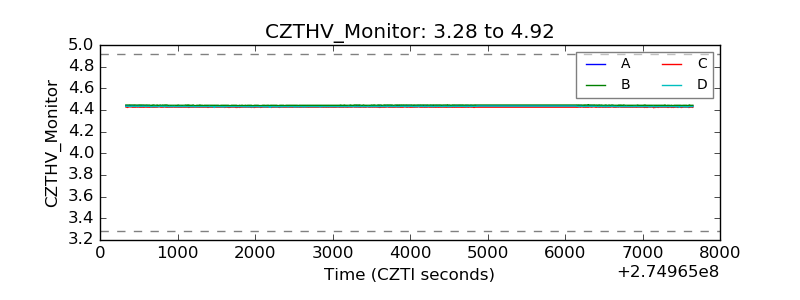 |
| D_VDD |  |
| Temperature 1 | 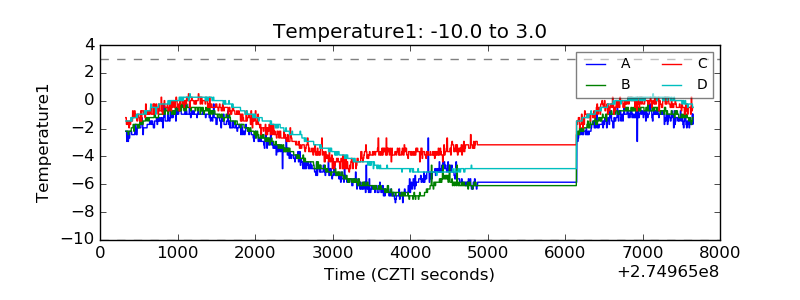 |
| Veto HV Monitor | 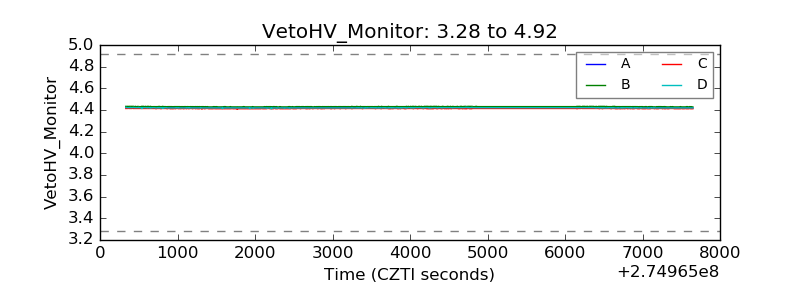 |
| Veto LLD | 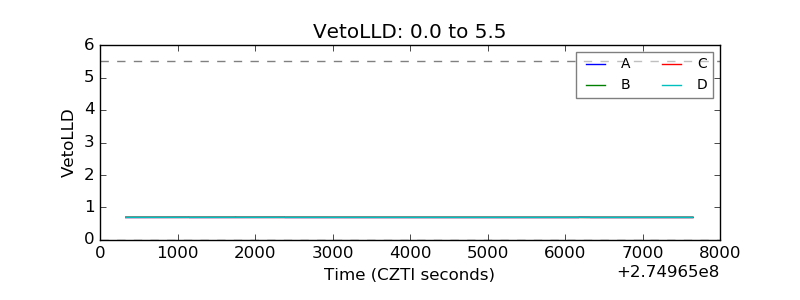 |
| Alpha Counter | 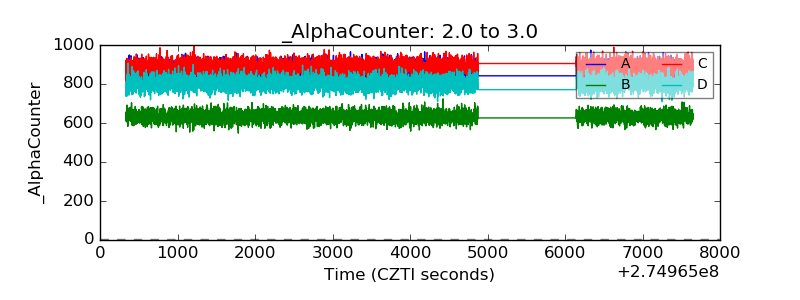 |
| _CPM_Rate | 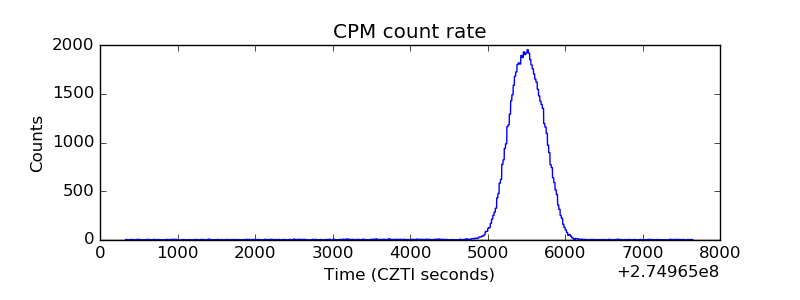 |
| CZT Counter | 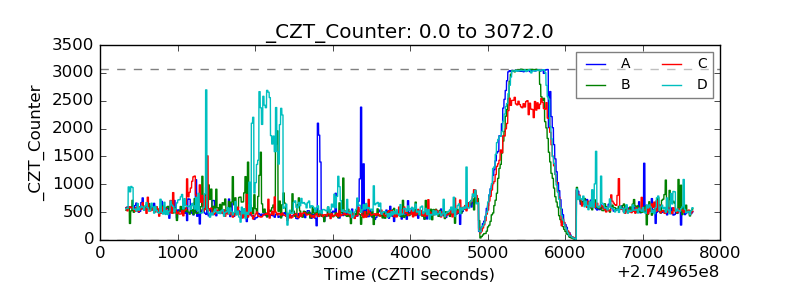 |
| +2.5 Volts monitor |  |
| +5 Volts monitor | 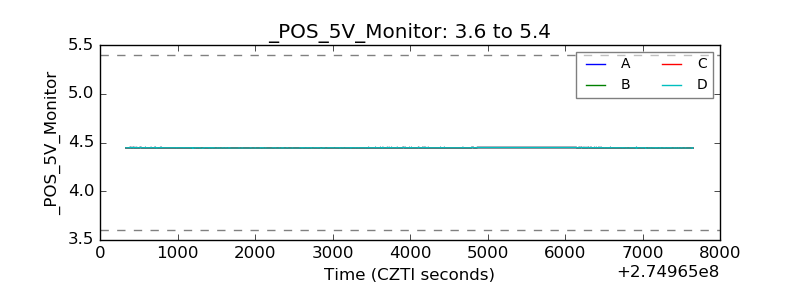 |
| _ROLL_ROT | 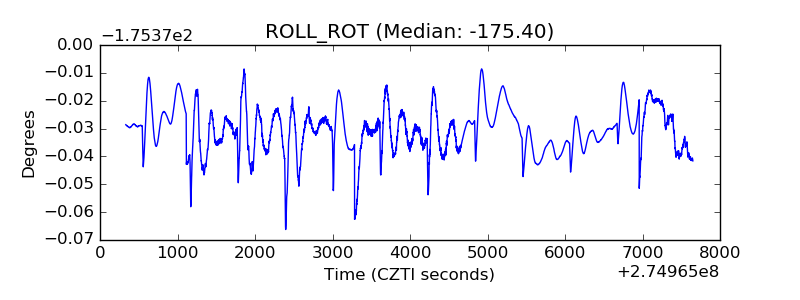 |
| _Roll_DEC | 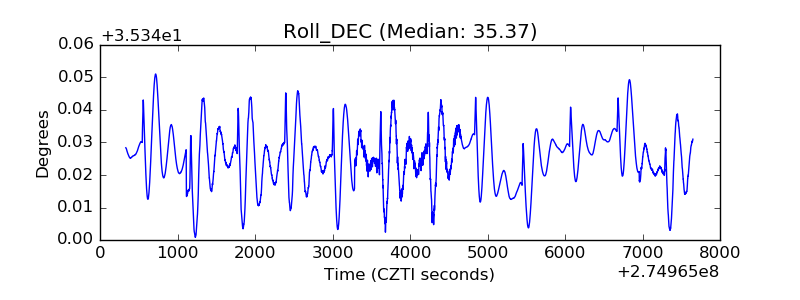 |
| _Roll_RA | 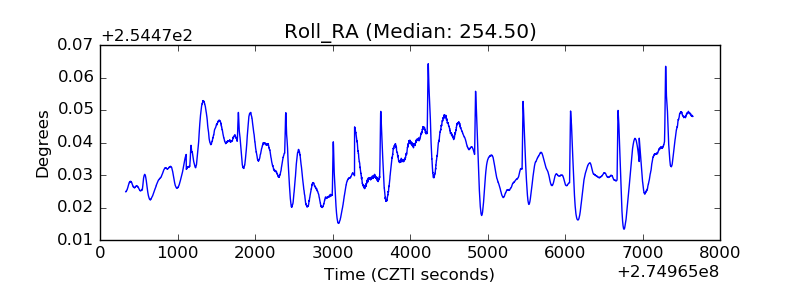 |
| Veto Counter | 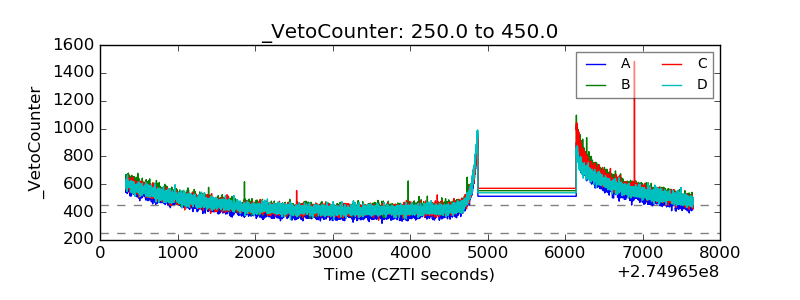 |