| Param | Original file | Final file |
|---|---|---|
| Filename | modeM0/AS1A04_230T01_9000002374_16081cztM0_level2.evt | modeM0/AS1A04_230T01_9000002374_16081cztM0_level2_quad_clean.evt |
| Size (bytes) | 208,704,960 | 52,778,880 |
| Size | 199.0 MB | 50.3 MB |
| Events in quadrant A | 1,474,949 | 359,106 |
| Events in quadrant B | 1,649,708 | 353,337 |
| Events in quadrant C | 1,493,622 | 332,047 |
| Events in quadrant D | 1,492,302 | 335,730 |
| Mode SS | |||
|---|---|---|---|
| Quadrant | BADHDUFLAG | Total packets | Discarded packets |
| A | 0 | 62 | 0 |
| B | 0 | 62 | 0 |
| C | 0 | 62 | 0 |
| D | 0 | 62 | 0 |
| Mode M0 | |||
|---|---|---|---|
| Quadrant | BADHDUFLAG | Total packets | Discarded packets |
| A | 0 | 6299 | 0 |
| B | 0 | 6823 | 0 |
| C | 0 | 6320 | 0 |
| D | 0 | 6454 | 0 |
| Quadrant | Total seconds | Saturated seconds | Saturation percentage |
|---|---|---|---|
| A | 3058 | 1 | 0.032701% |
| B | 3058 | 11 | 0.359712% |
| C | 3058 | 8 | 0.261609% |
| D | 3058 | 0 | 0.000000% |
Noise dominated data is calculated using 1-second bins in cleaned event files. If a bin has >2000 counts, and if more than 50% of those come from <1% of pixels, then it is considered to be noise-dominated and hence unusable.
| Quadrant | # 1 sec bins | Bins with >0 counts | Bins with >2000 counts | High rate bins dominated by noise | Noise dominated (total time) | Noise dominated (detector-on time) | Marked lightcurve |
|---|---|---|---|---|---|---|---|
| A | 3059 | 3059 | 0 | 0 | 0.00% | 0.00% | 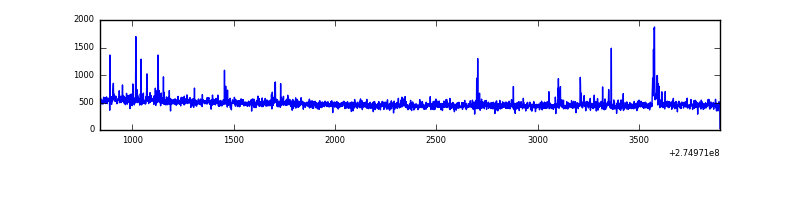 |
| B | 3059 | 3059 | 9 | 9 | 0.29% | 0.29% | 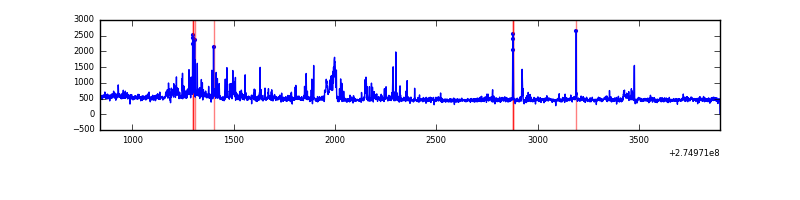 |
| C | 3059 | 3059 | 0 | 0 | 0.00% | 0.00% | 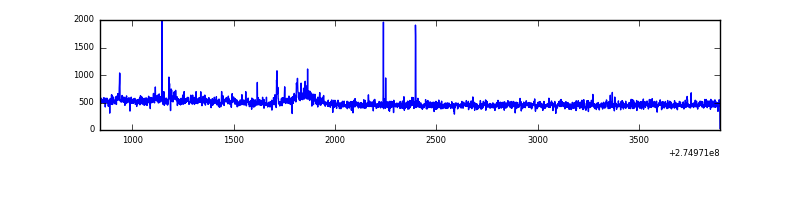 |
| D | 3059 | 3059 | 1 | 1 | 0.03% | 0.03% | 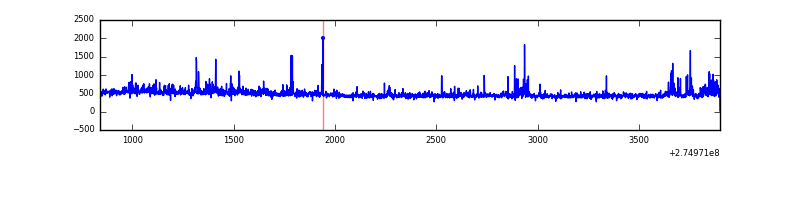 |
Top three noisy pixels from each quadrant. If the there are fewer than three noisy pixels in the level2.evt file, extra rows are filled as -1
| Pixel properties | Quadrant properties | ||||||
|---|---|---|---|---|---|---|---|
| Quadrant | DetID | PixID | Counts | Sigma | Mean | Median | Sigma |
| A | 15 | 239 | 30883 | 407.07 | 367 | 360 | 75.0 |
| A | 9 | 143 | 14152 | 183.93 | 367 | 360 | 75.0 |
| A | 3 | 80 | 10285 | 132.36 | 367 | 360 | 75.0 |
| B | 7 | 220 | 77461 | 1119.41 | 365 | 358 | 68.9 |
| B | 4 | 216 | 35041 | 503.54 | 365 | 358 | 68.9 |
| B | 0 | 189 | 33415 | 479.93 | 365 | 358 | 68.9 |
| C | 14 | 238 | 54819 | 661.47 | 350 | 353 | 82.3 |
| C | 3 | 233 | 41967 | 505.38 | 350 | 353 | 82.3 |
| C | 0 | 207 | 20926 | 249.85 | 350 | 353 | 82.3 |
| D | 5 | 222 | 93313 | 1046.58 | 360 | 351 | 88.8 |
| D | 2 | 234 | 11537 | 125.93 | 360 | 351 | 88.8 |
| D | 12 | 218 | 8780 | 94.9 | 360 | 351 | 88.8 |
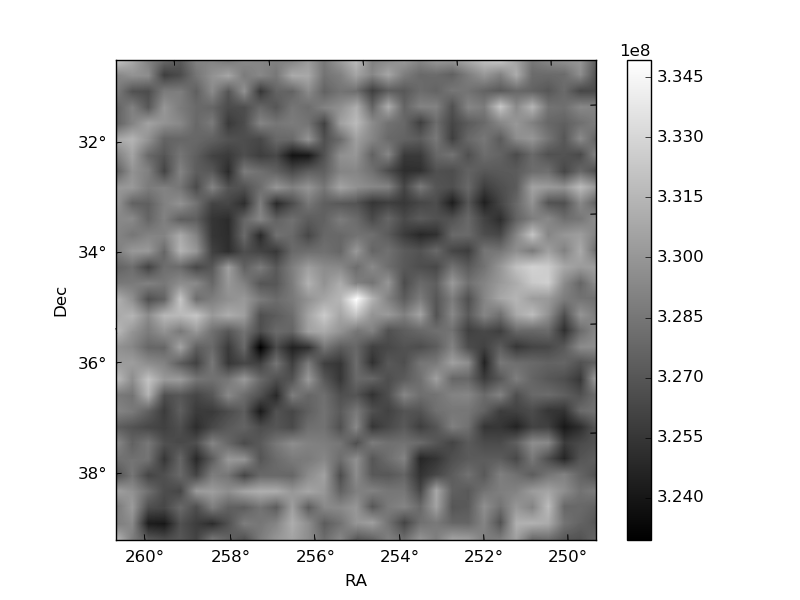
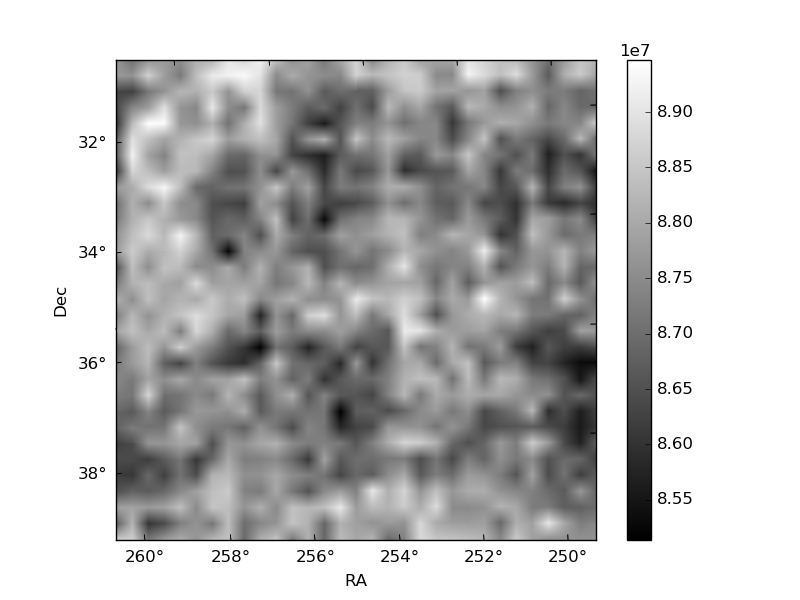
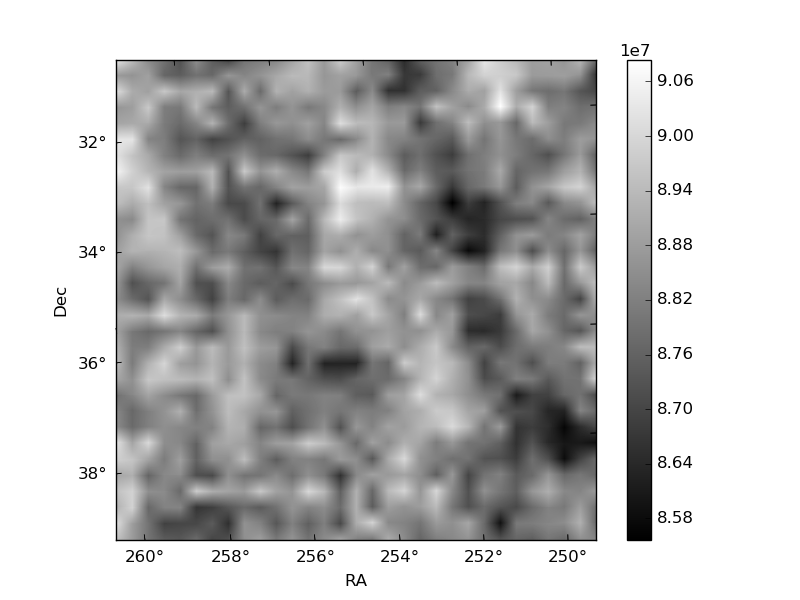
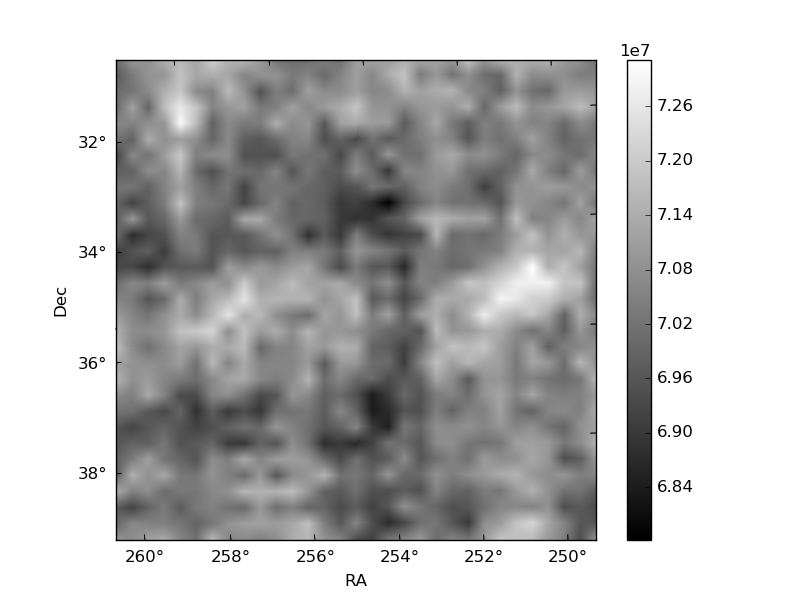
Histogram calculated using DETX and DETY for each event in the final _common_clean file
| Quadrant A | 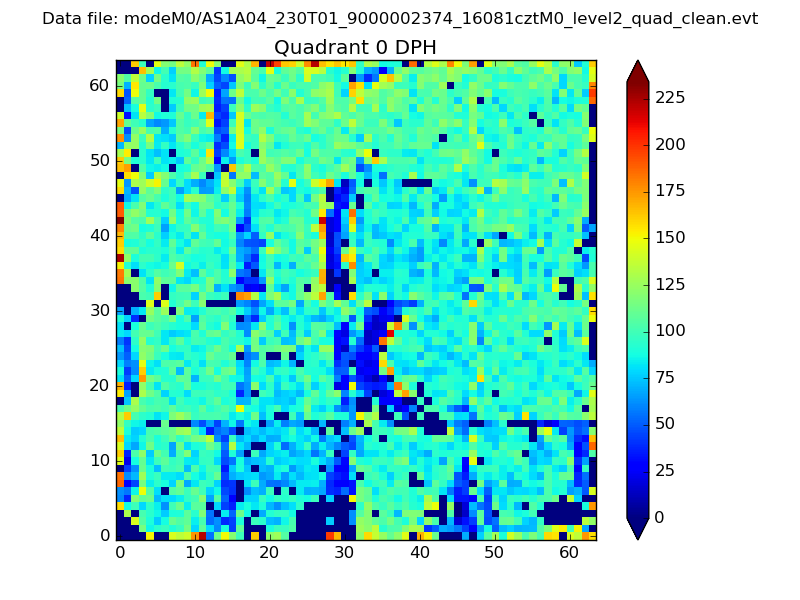 |
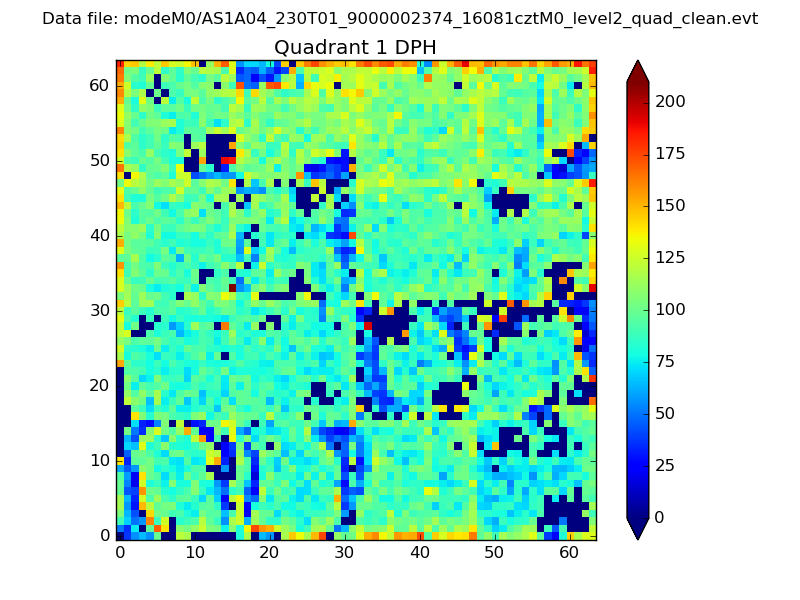 |
Quadrant B |
|---|---|---|---|
| Quadrant D | 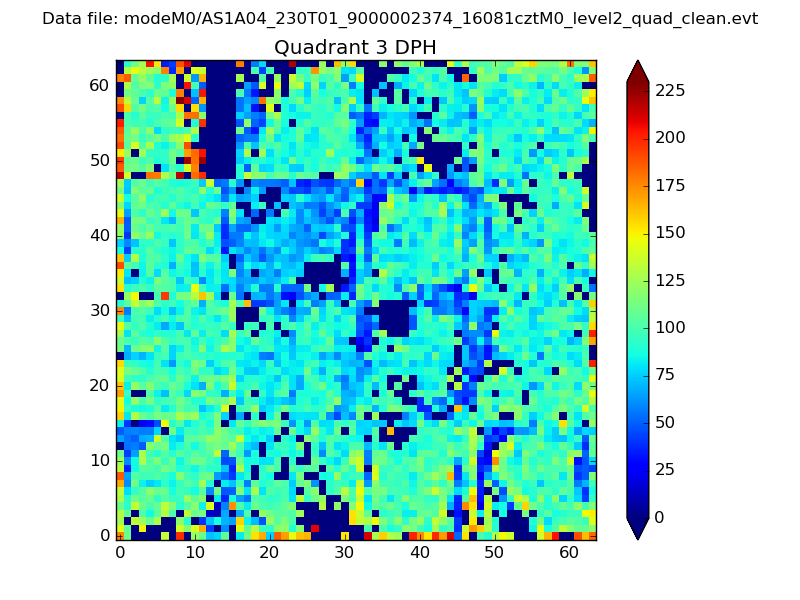 |
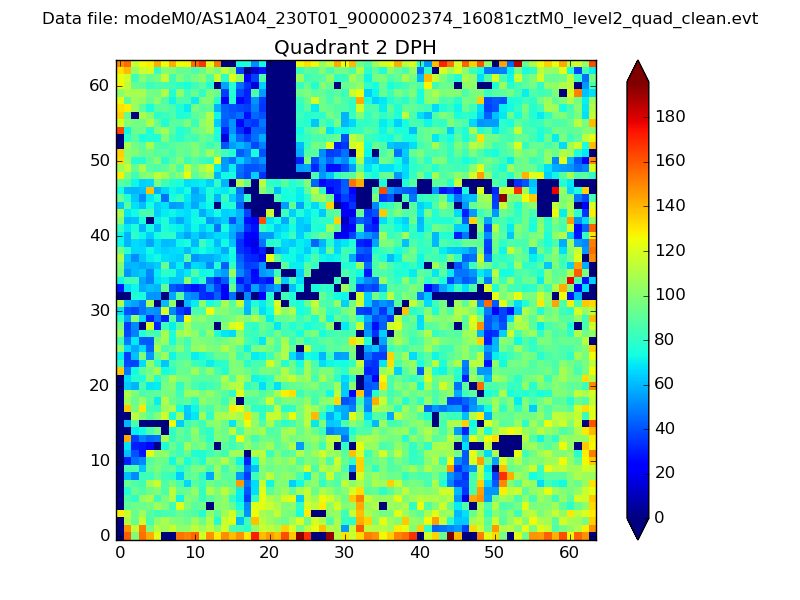 |
Quadrant C |
| Plot type | Count rate plots | Images |
|---|---|---|
| Comparison with Poisson distribution Blue bars denote a histogram of data divided into 1 sec bins. Red curve is a Poisson curve with rate = median count rate of data. |
 |
 |
| Quadrant-wise count rates Data is divided into 100 sec bins |
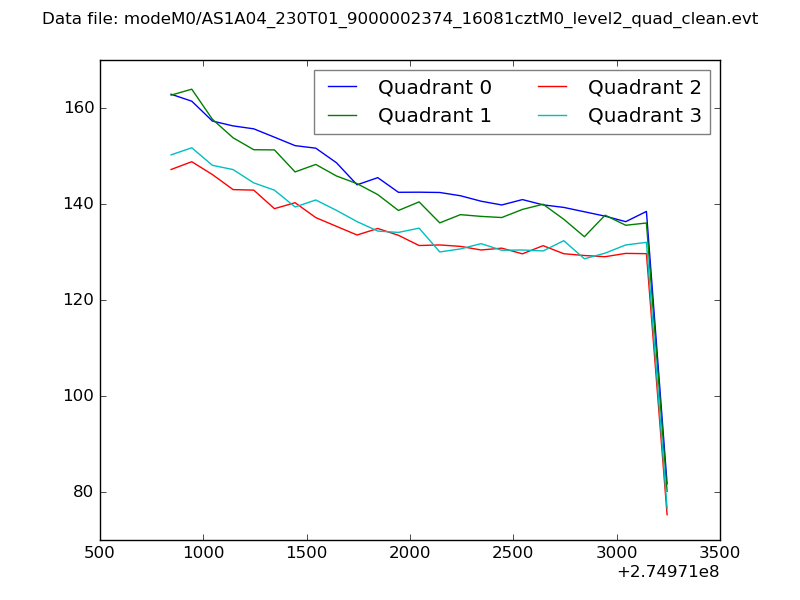 |
|
| Module-wise count rates for Quadrant A Data is divided into 100 sec bins |
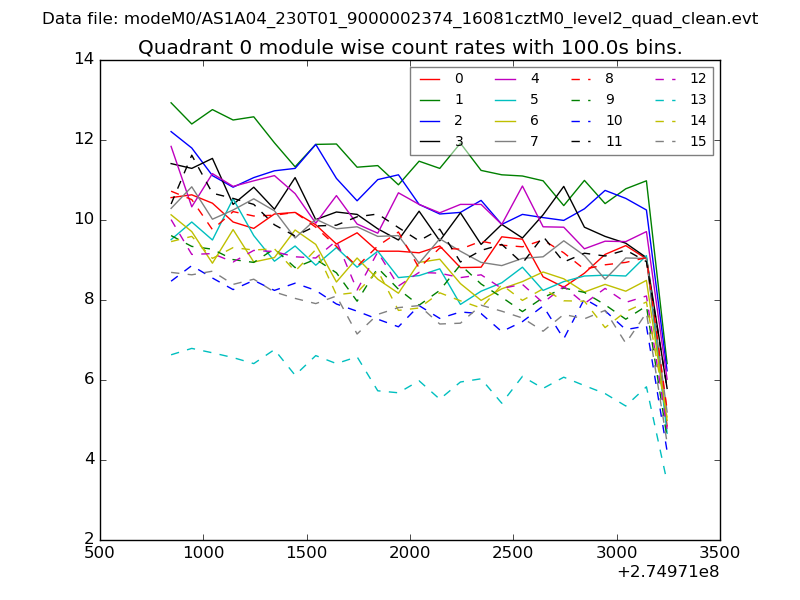 |
 |
| Module-wise count rates for Quadrant B Data is divided into 100 sec bins |
 |
 |
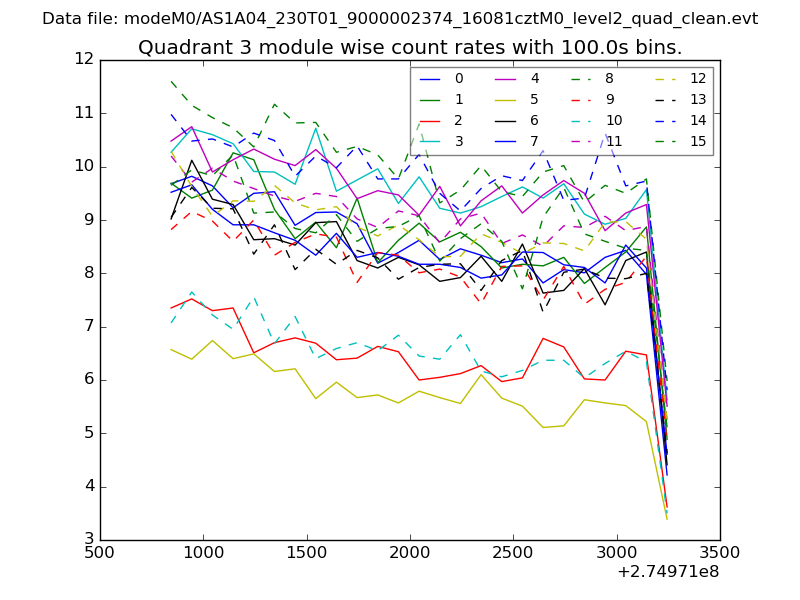
| Module-wise count rates for Quadrant C Data is divided into 100 sec bins |
 |
 |
| Module-wise count rates for Quadrant D Data is divided into 100 sec bins |
 |
 |
| Parameter | Plot |
|---|---|
| CZT HV Monitor |  |
| D_VDD | 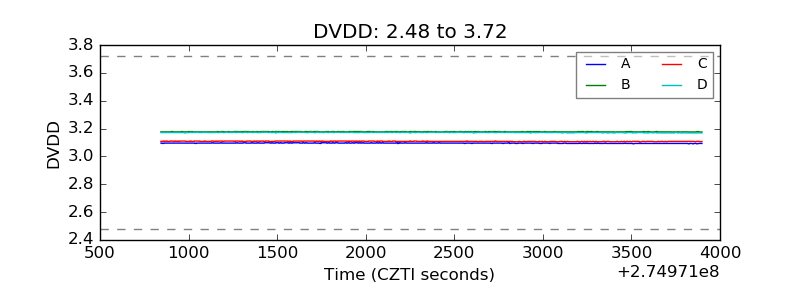 |
| Temperature 1 | 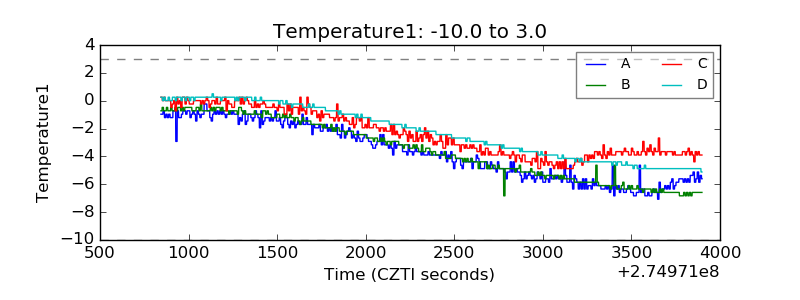 |
| Veto HV Monitor | 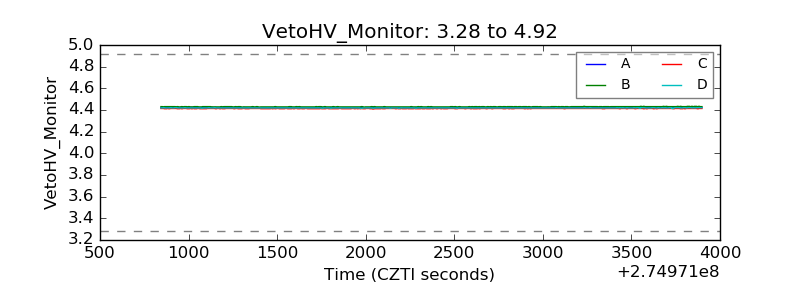 |
| Veto LLD | 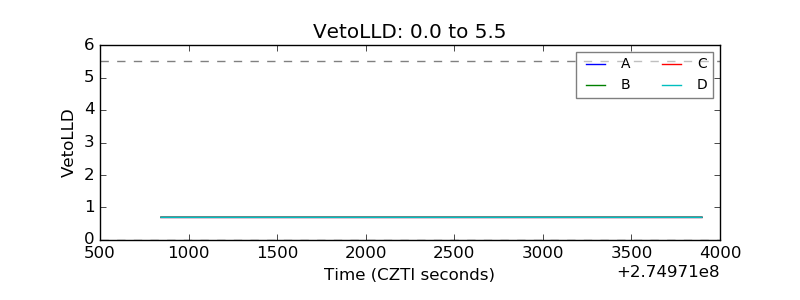 |
| Alpha Counter | 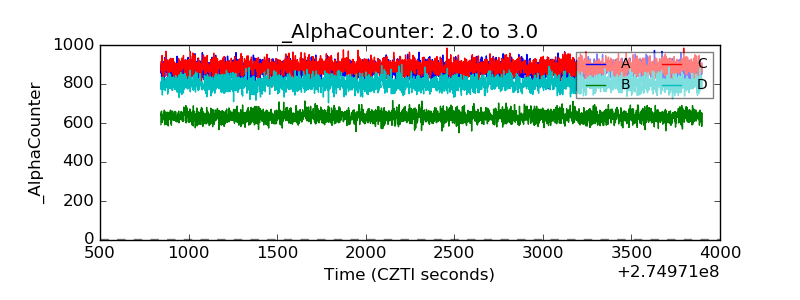 |
| _CPM_Rate | 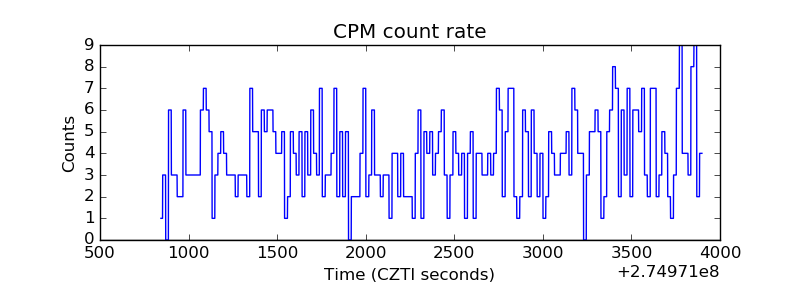 |
| CZT Counter | 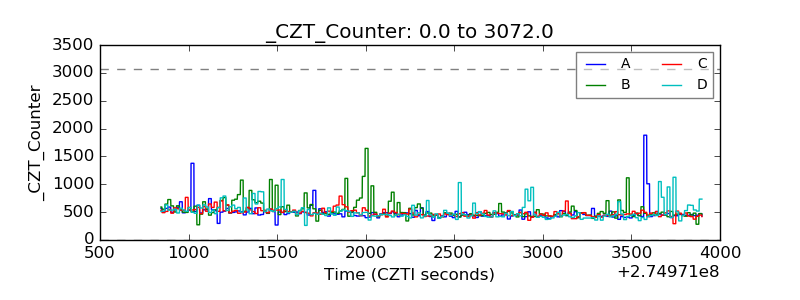 |
| +2.5 Volts monitor | 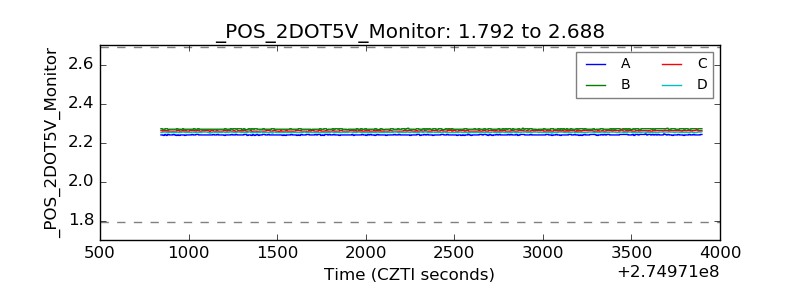 |
| +5 Volts monitor |  |
| _ROLL_ROT | 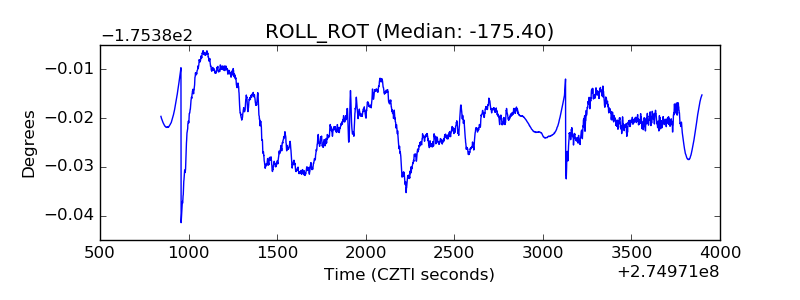 |
| _Roll_DEC | 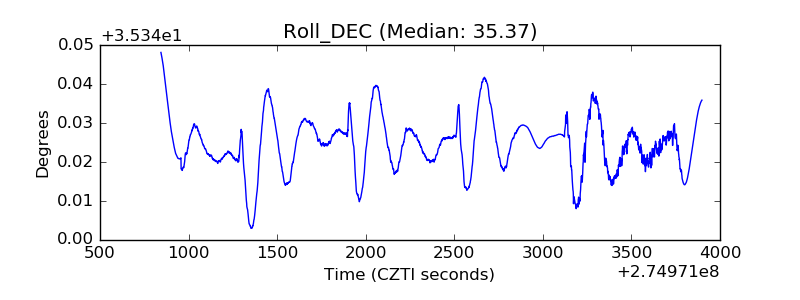 |
| _Roll_RA | 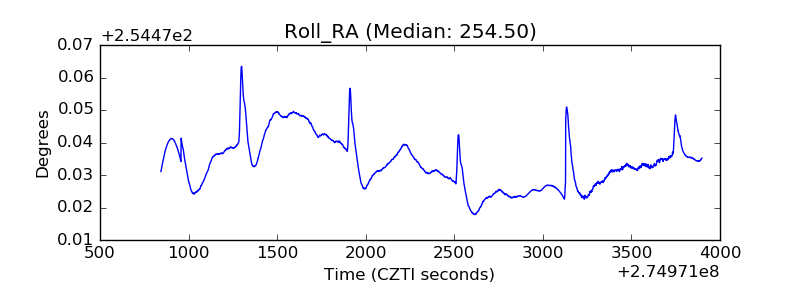 |
| Veto Counter | 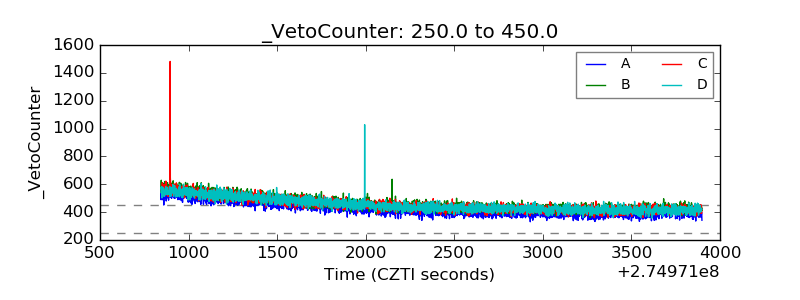 |