| Param | Original file | Final file |
|---|---|---|
| Filename | modeM0/AS1T02_101T01_9000002372cztM0_level2.fits | modeM0/AS1T02_101T01_9000002372cztM0_level2_quad_clean.evt |
| Size (bytes) | 132,989,760 | 161,066,880 |
| Size | 126.8 MB | 153.6 MB |
| Events in quadrant A | 799,712 | 1,002,932 |
| Events in quadrant B | 770,628 | 1,007,528 |
| Events in quadrant C | 789,044 | 988,356 |
| Events in quadrant D | 688,622 | 899,411 |
| Mode M9 | |||
|---|---|---|---|
| Quadrant | BADHDUFLAG | Total packets | Discarded packets |
| A | 0 | 16 | 0 |
| B | 0 | 16 | 0 |
| C | 0 | 16 | 0 |
| D | 0 | 16 | 0 |
| Mode SS | |||
|---|---|---|---|
| Quadrant | BADHDUFLAG | Total packets | Discarded packets |
| A | 0 | 290 | 0 |
| B | 0 | 290 | 0 |
| C | 0 | 290 | 0 |
| D | 0 | 290 | 0 |
| Mode M0 | |||
|---|---|---|---|
| Quadrant | BADHDUFLAG | Total packets | Discarded packets |
| A | 0 | 30054 | 0 |
| B | 0 | 29469 | 0 |
| C | 0 | 28943 | 0 |
| D | 0 | 31067 | 0 |
| Quadrant | Total seconds | Saturated seconds | Saturation percentage |
|---|---|---|---|
| A | 14180 | 171 | 1.205924% |
| B | 14180 | 170 | 1.198872% |
| C | 14180 | 191 | 1.346968% |
| D | 14180 | 259 | 1.826516% |
Noise dominated data is calculated using 1-second bins in cleaned event files. If a bin has >2000 counts, and if more than 50% of those come from <1% of pixels, then it is considered to be noise-dominated and hence unusable.
| Quadrant | # 1 sec bins | Bins with >0 counts | Bins with >2000 counts | High rate bins dominated by noise | Noise dominated (total time) | Noise dominated (detector-on time) | Marked lightcurve |
|---|---|---|---|---|---|---|---|
| A | 15825 | 14173 | 0 | 0 | 0.00% | 0.00% | 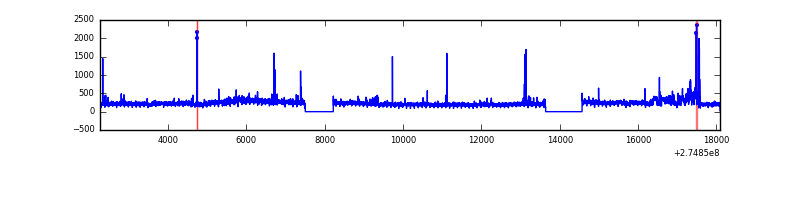 |
| B | 15825 | 14178 | 0 | 0 | 0.00% | 0.00% |  |
| C | 15825 | 14178 | 0 | 0 | 0.00% | 0.00% |  |
| D | 15825 | 14172 | 0 | 0 | 0.00% | 0.00% |  |
Top three noisy pixels from each quadrant. If the there are fewer than three noisy pixels in the level2.evt file, extra rows are filled as -1
| Pixel properties | Quadrant properties | ||||||
|---|---|---|---|---|---|---|---|
| Quadrant | DetID | PixID | Counts | Sigma | Mean | Median | Sigma |
| A | 14 | 188 | 771 | 11.0 | 207 | 195 | 52.4 |
| A | 0 | 29 | 740 | 10.4 | 207 | 195 | 52.4 |
| A | 14 | 204 | 689 | 9.43 | 207 | 195 | 52.4 |
| B | 2 | 9 | 672 | 11.03 | 204 | 195 | 43.2 |
| B | 2 | 8 | 569 | 8.65 | 204 | 195 | 43.2 |
| B | 14 | 254 | 515 | 7.4 | 204 | 195 | 43.2 |
| C | 7 | 111 | 554 | 6.53 | 208 | 195 | 54.9 |
| C | 12 | 241 | 543 | 6.33 | 208 | 195 | 54.9 |
| C | 3 | 158 | 539 | 6.26 | 208 | 195 | 54.9 |
| D | 10 | 189 | 514 | 6.22 | 196 | 178 | 54.0 |
| D | 6 | 231 | 512 | 6.18 | 196 | 178 | 54.0 |
| D | 3 | 14 | 506 | 6.07 | 196 | 178 | 54.0 |
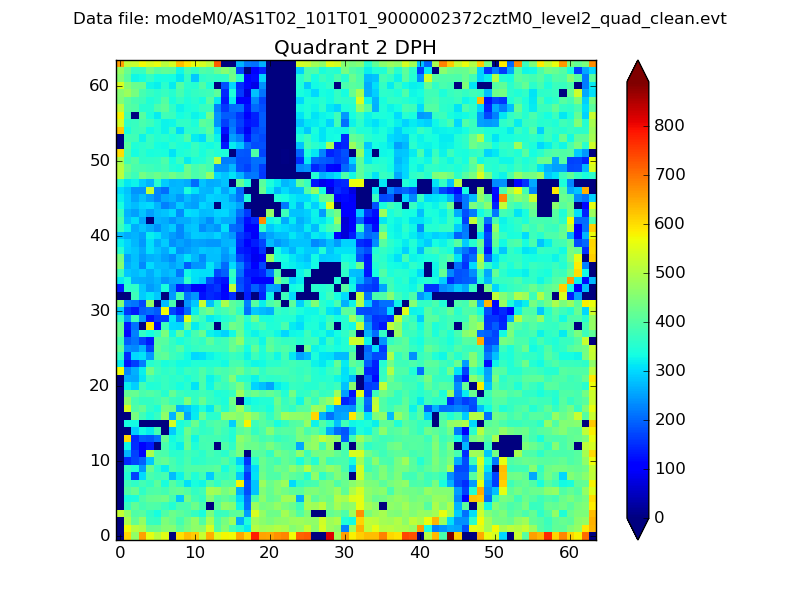
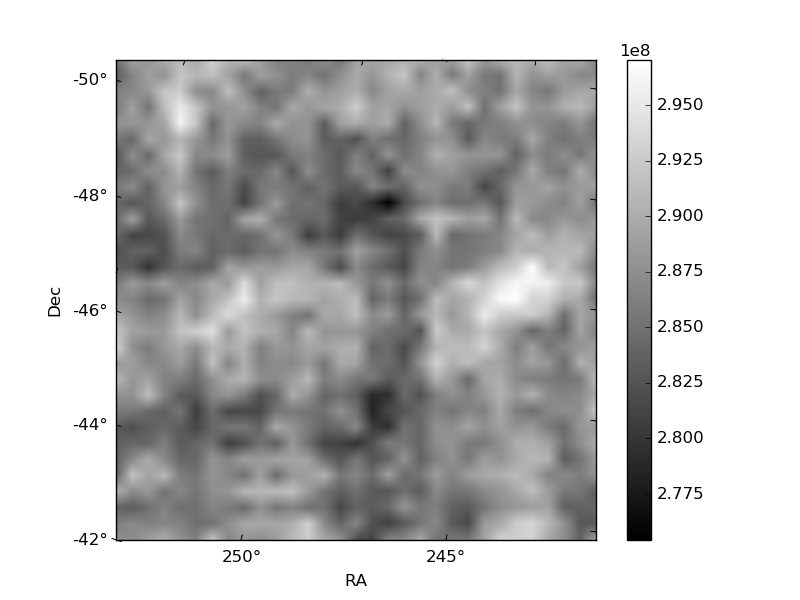
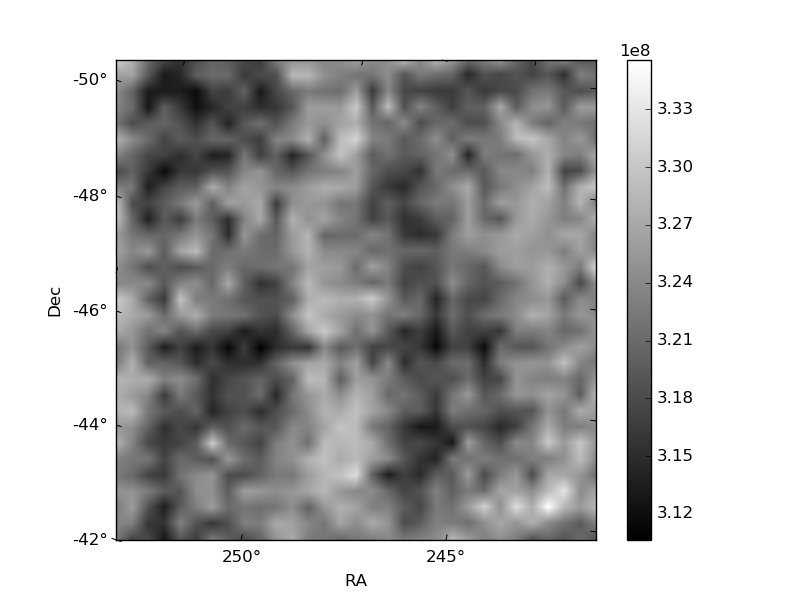
Histogram calculated using DETX and DETY for each event in the final _common_clean file
| Quadrant A | 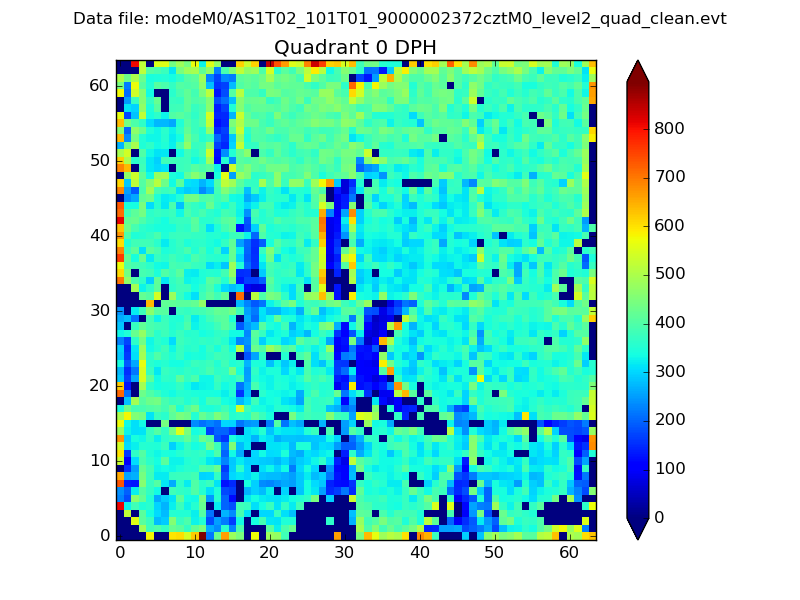 |
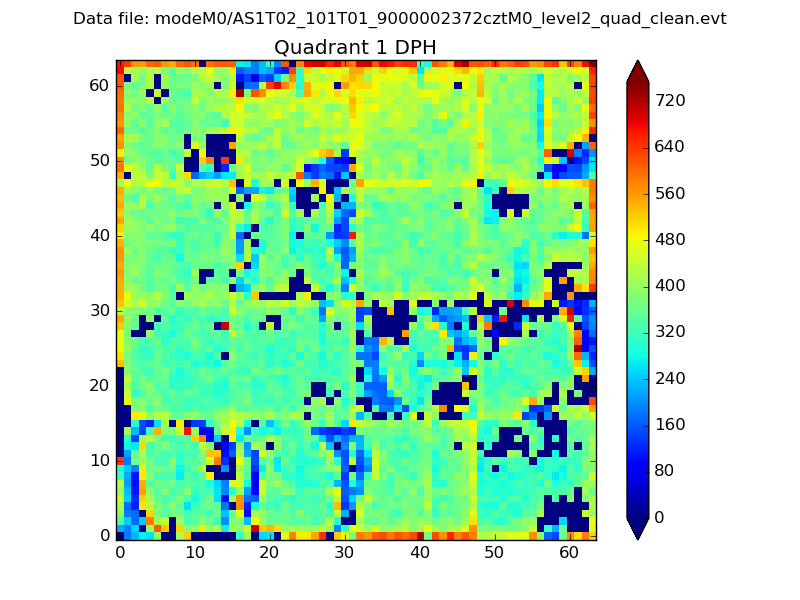 |
Quadrant B |
|---|---|---|---|
| Quadrant D | 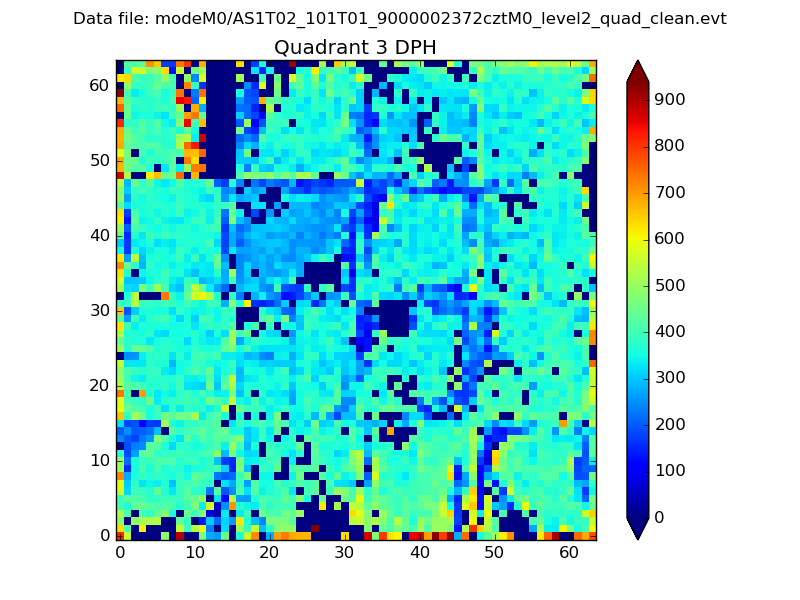 |
 |
Quadrant C |
| Plot type | Count rate plots | Images |
|---|---|---|
| Comparison with Poisson distribution Blue bars denote a histogram of data divided into 1 sec bins. Red curve is a Poisson curve with rate = median count rate of data. |
 |
 |
| Quadrant-wise count rates Data is divided into 100 sec bins |
 |
|
| Module-wise count rates for Quadrant A Data is divided into 100 sec bins |
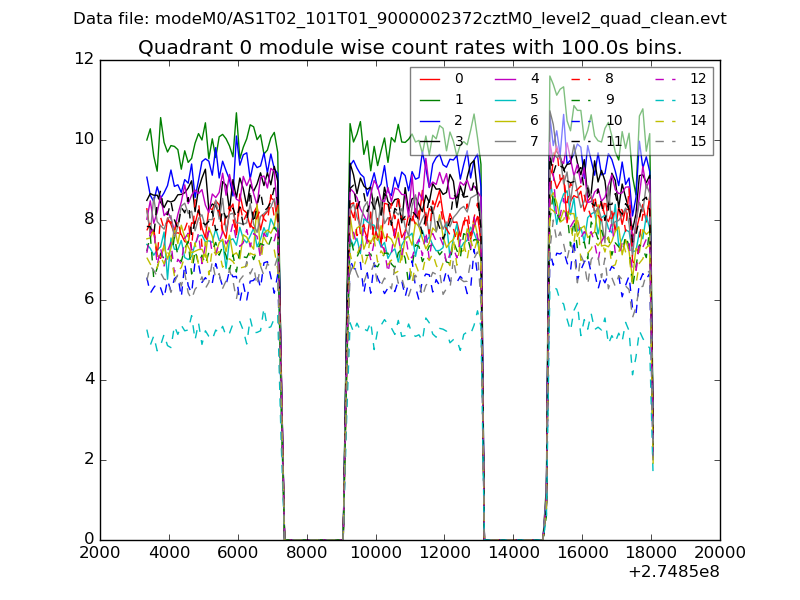 |
 |
| Module-wise count rates for Quadrant B Data is divided into 100 sec bins |
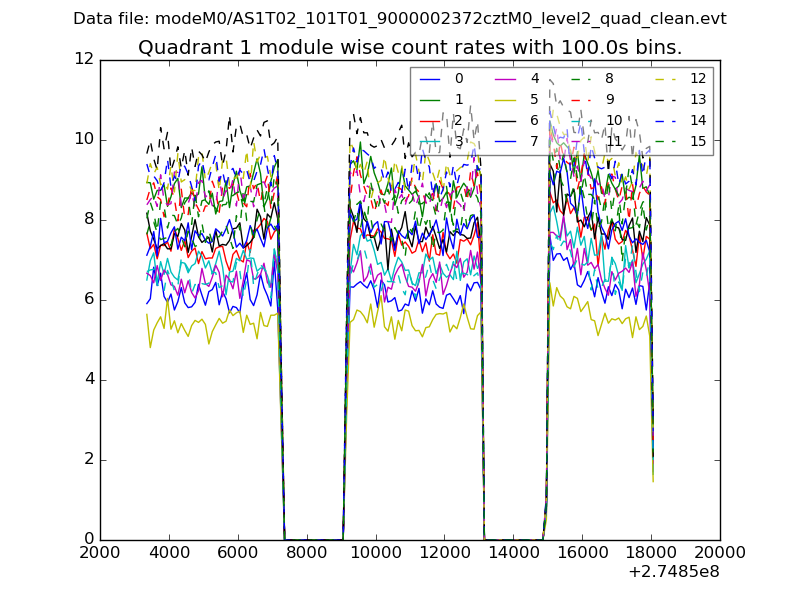 |
 |
| Module-wise count rates for Quadrant C Data is divided into 100 sec bins |
 |
 |
| Module-wise count rates for Quadrant D Data is divided into 100 sec bins |
 |
 |
| Parameter | Plot |
|---|---|
| CZT HV Monitor | 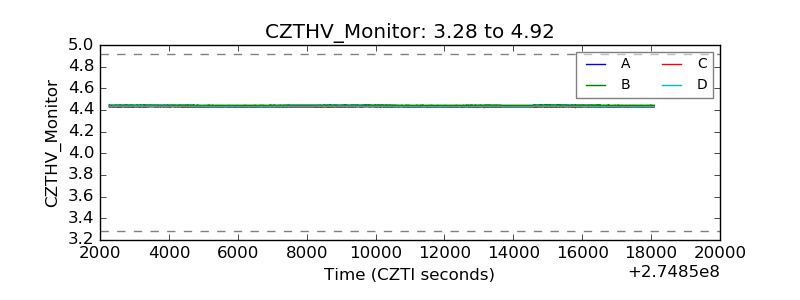 |
| D_VDD |  |
| Temperature 1 | 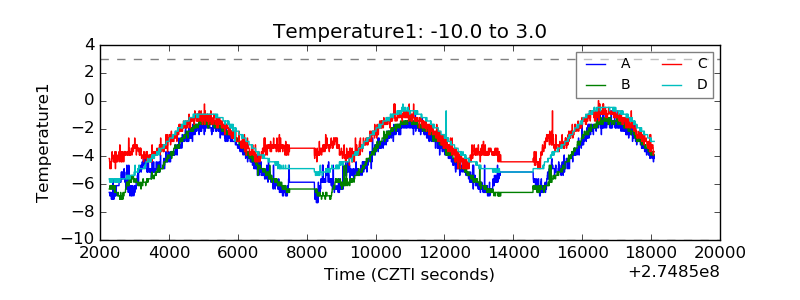 |
| Veto HV Monitor | 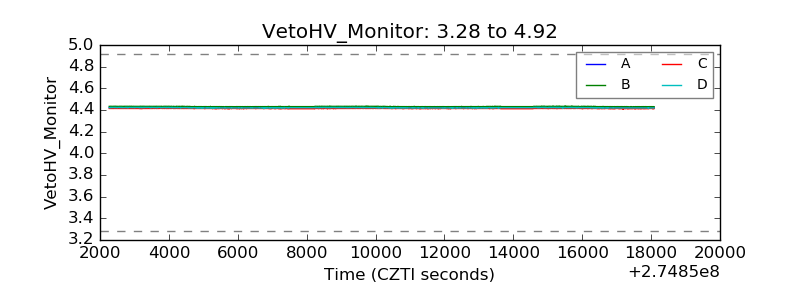 |
| Veto LLD |  |
| Alpha Counter | 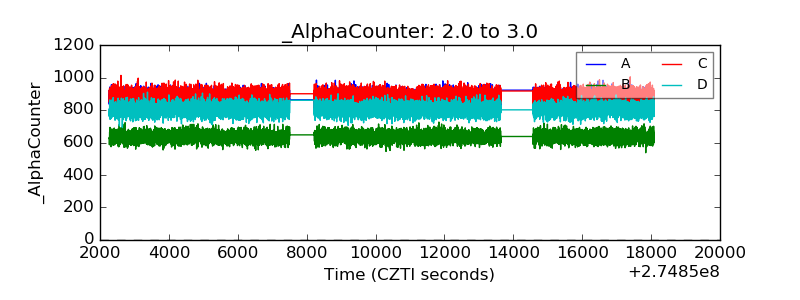 |
| _CPM_Rate |  |
| CZT Counter |  |
| +2.5 Volts monitor |  |
| +5 Volts monitor |  |
| _ROLL_ROT |  |
| _Roll_DEC | 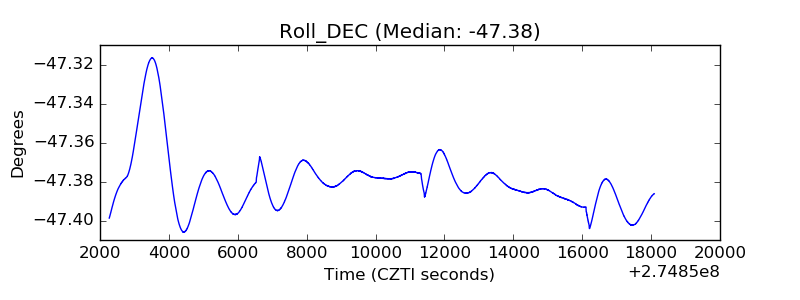 |
| _Roll_RA | 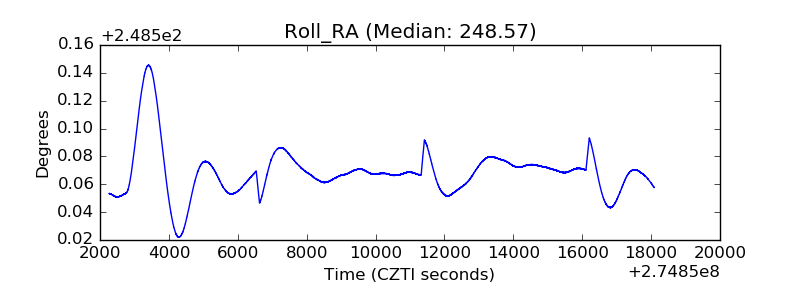 |
| Veto Counter |  |