| Param | Original file | Final file |
|---|---|---|
| Filename | modeM0/AS1T02_101T01_9000002372_16061cztM0_level2.evt | modeM0/AS1T02_101T01_9000002372_16061cztM0_level2_quad_clean.evt |
| Size (bytes) | 398,511,360 | 94,250,880 |
| Size | 380.1 MB | 89.9 MB |
| Events in quadrant A | 2,884,858 | 611,936 |
| Events in quadrant B | 2,916,379 | 622,400 |
| Events in quadrant C | 2,877,131 | 608,288 |
| Events in quadrant D | 2,982,503 | 592,911 |
| Mode M9 | |||
|---|---|---|---|
| Quadrant | BADHDUFLAG | Total packets | Discarded packets |
| A | 0 | 9 | 0 |
| B | 0 | 9 | 0 |
| C | 0 | 9 | 0 |
| D | 0 | 9 | 0 |
| Mode SS | |||
|---|---|---|---|
| Quadrant | BADHDUFLAG | Total packets | Discarded packets |
| A | 0 | 122 | 0 |
| B | 0 | 122 | 0 |
| C | 0 | 122 | 0 |
| D | 0 | 122 | 0 |
| Mode M0 | |||
|---|---|---|---|
| Quadrant | BADHDUFLAG | Total packets | Discarded packets |
| A | 0 | 12413 | 2 |
| B | 0 | 12383 | 1 |
| C | 0 | 12333 | 1 |
| D | 0 | 12798 | 1 |
| Quadrant | Total seconds | Saturated seconds | Saturation percentage |
|---|---|---|---|
| A | 5997 | 53 | 0.883775% |
| B | 5997 | 54 | 0.900450% |
| C | 5997 | 74 | 1.233950% |
| D | 5997 | 55 | 0.917125% |
Noise dominated data is calculated using 1-second bins in cleaned event files. If a bin has >2000 counts, and if more than 50% of those come from <1% of pixels, then it is considered to be noise-dominated and hence unusable.
| Quadrant | # 1 sec bins | Bins with >0 counts | Bins with >2000 counts | High rate bins dominated by noise | Noise dominated (total time) | Noise dominated (detector-on time) | Marked lightcurve |
|---|---|---|---|---|---|---|---|
| A | 6928 | 5998 | 6 | 6 | 0.09% | 0.10% | 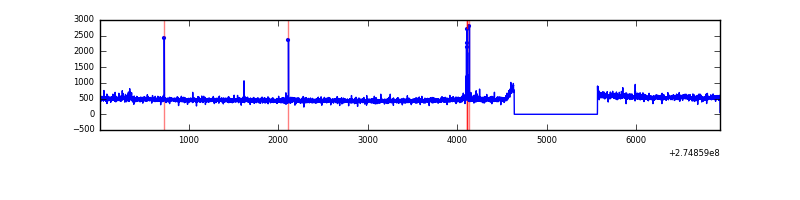 |
| B | 6928 | 5998 | 3 | 3 | 0.04% | 0.05% | 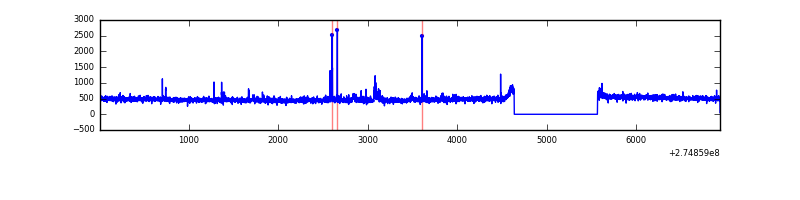 |
| C | 6928 | 5998 | 0 | 0 | 0.00% | 0.00% | 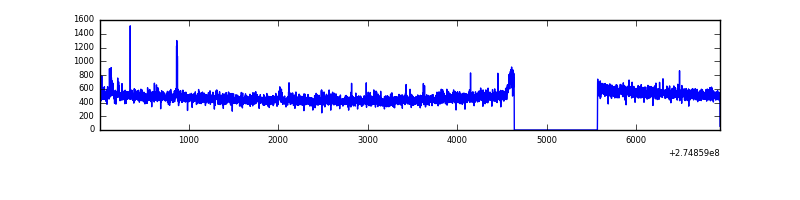 |
| D | 6928 | 5998 | 13 | 13 | 0.19% | 0.22% | 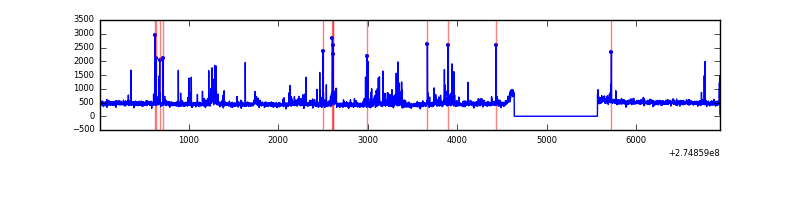 |
Top three noisy pixels from each quadrant. If the there are fewer than three noisy pixels in the level2.evt file, extra rows are filled as -1
| Pixel properties | Quadrant properties | ||||||
|---|---|---|---|---|---|---|---|
| Quadrant | DetID | PixID | Counts | Sigma | Mean | Median | Sigma |
| A | 3 | 80 | 46382 | 309.06 | 728 | 712 | 147.8 |
| A | 12 | 96 | 25130 | 165.24 | 728 | 712 | 147.8 |
| A | 9 | 143 | 15468 | 99.86 | 728 | 712 | 147.8 |
| B | 7 | 220 | 17744 | 123.49 | 725 | 706 | 138.0 |
| B | 12 | 111 | 16185 | 112.19 | 725 | 706 | 138.0 |
| B | 4 | 142 | 15982 | 110.72 | 725 | 706 | 138.0 |
| C | 14 | 238 | 106238 | 642.57 | 701 | 705 | 164.2 |
| C | 3 | 233 | 34640 | 206.62 | 701 | 705 | 164.2 |
| C | 13 | 61 | 5015 | 26.24 | 701 | 705 | 164.2 |
| D | 12 | 218 | 131779 | 750.63 | 710 | 690 | 174.6 |
| D | 1 | 52 | 99197 | 564.06 | 710 | 690 | 174.6 |
| D | 2 | 152 | 26922 | 150.21 | 710 | 690 | 174.6 |
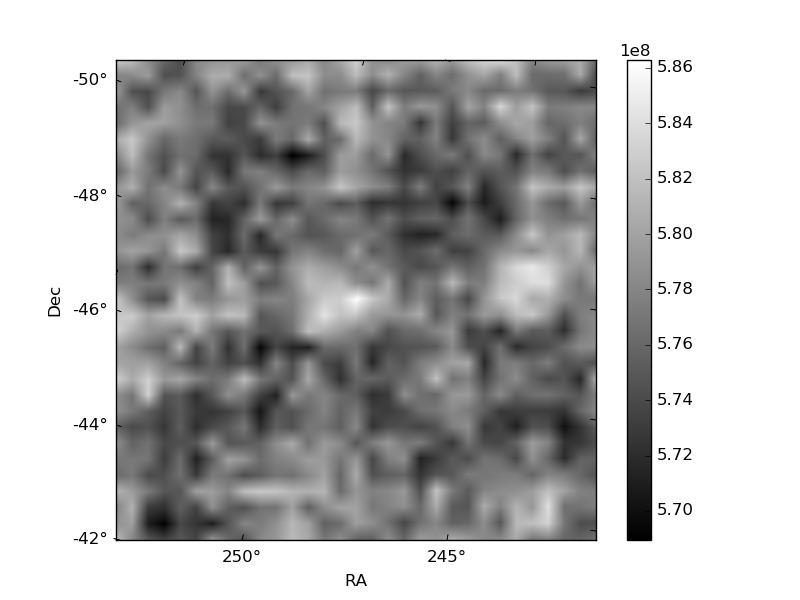
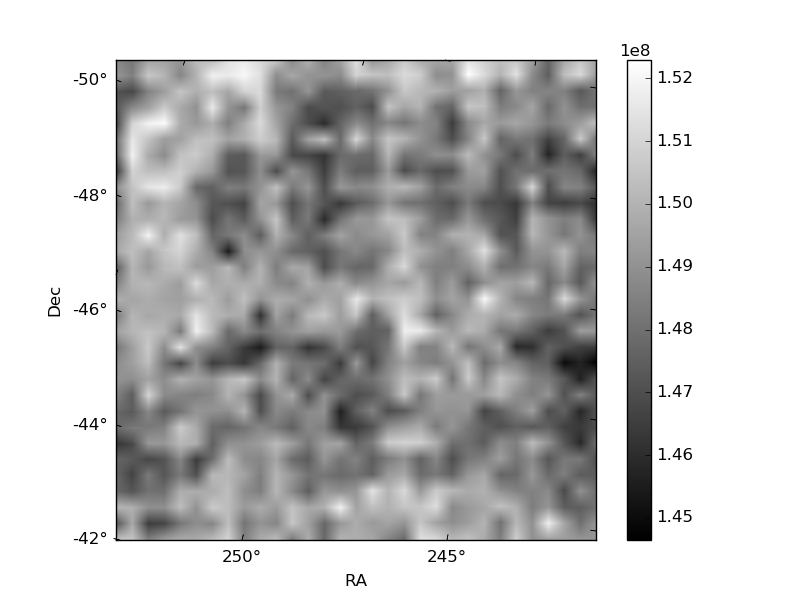
Histogram calculated using DETX and DETY for each event in the final _common_clean file
| Quadrant A | 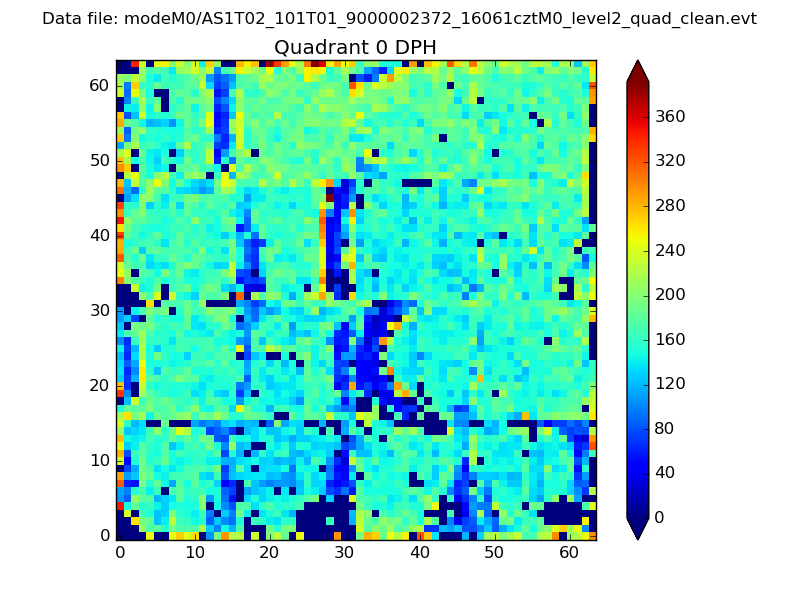 |
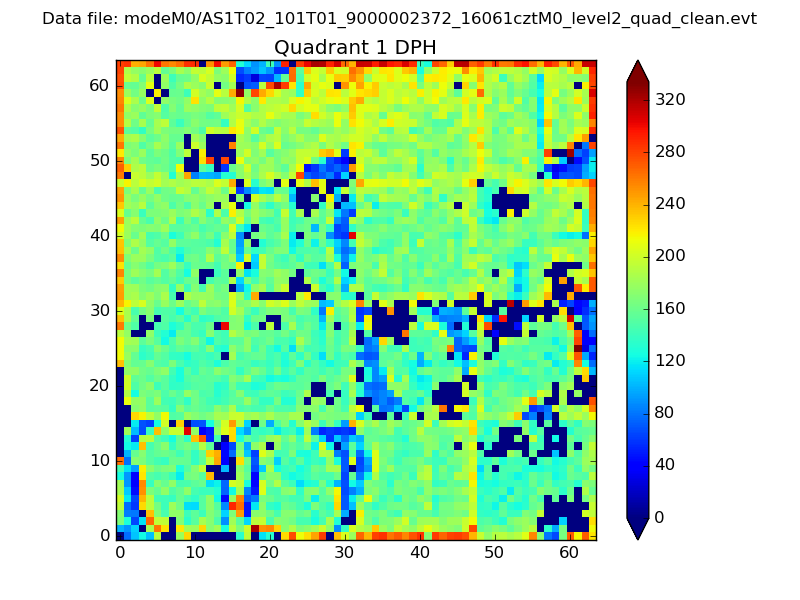 |
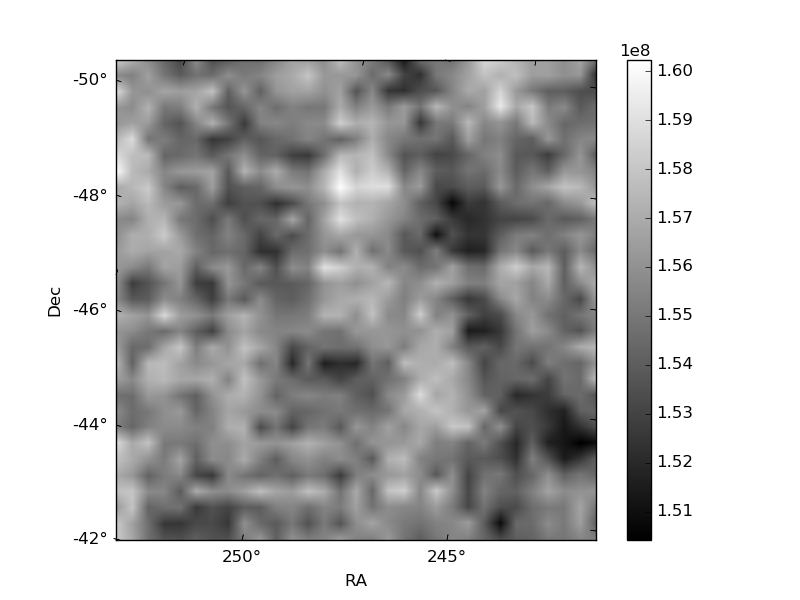
Quadrant B |
|---|---|---|---|
| Quadrant D | 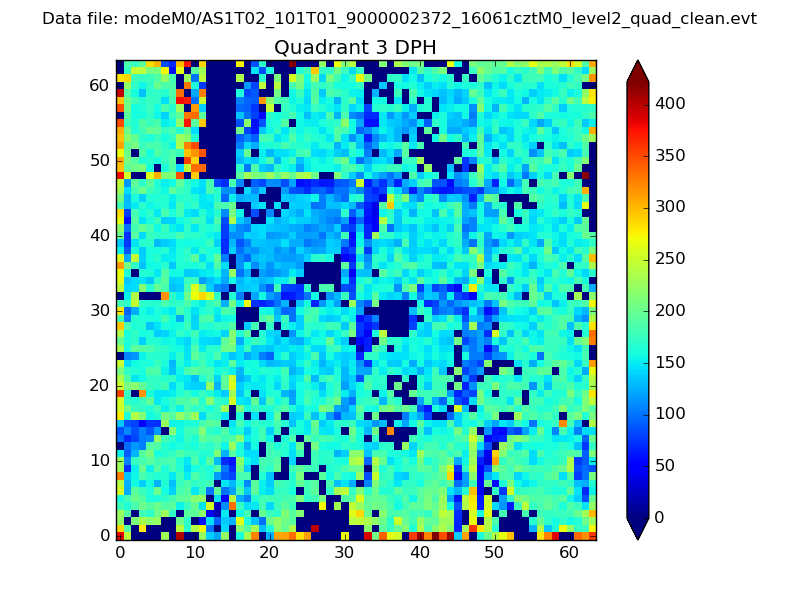 |
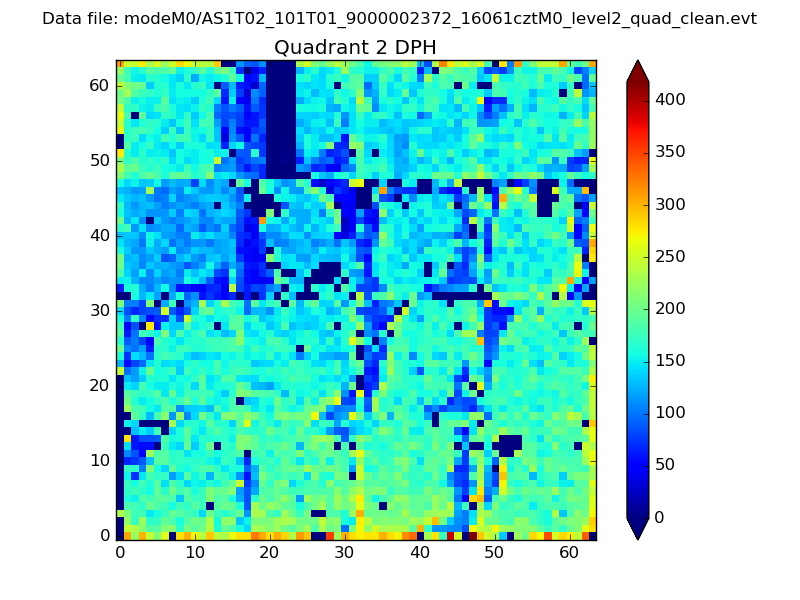 |
Quadrant C |
| Plot type | Count rate plots | Images |
|---|---|---|
| Comparison with Poisson distribution Blue bars denote a histogram of data divided into 1 sec bins. Red curve is a Poisson curve with rate = median count rate of data. |
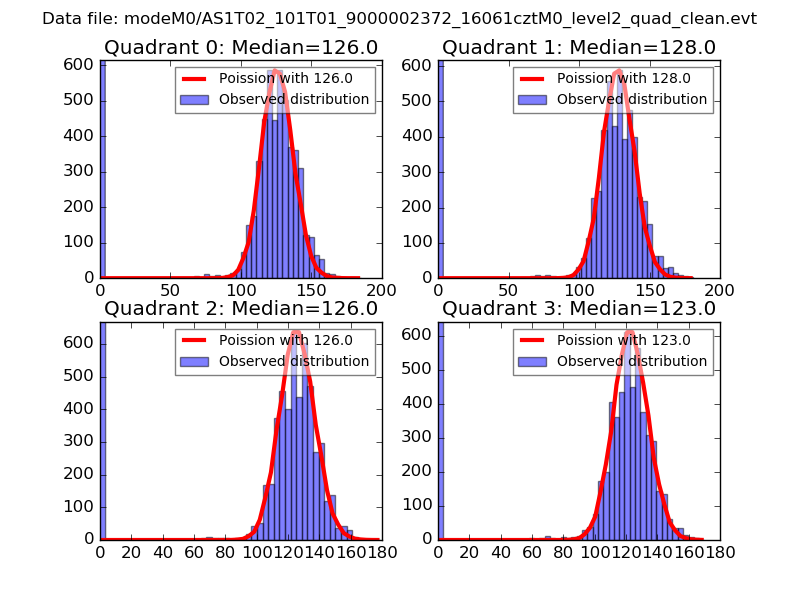 |
 |
| Quadrant-wise count rates Data is divided into 100 sec bins |
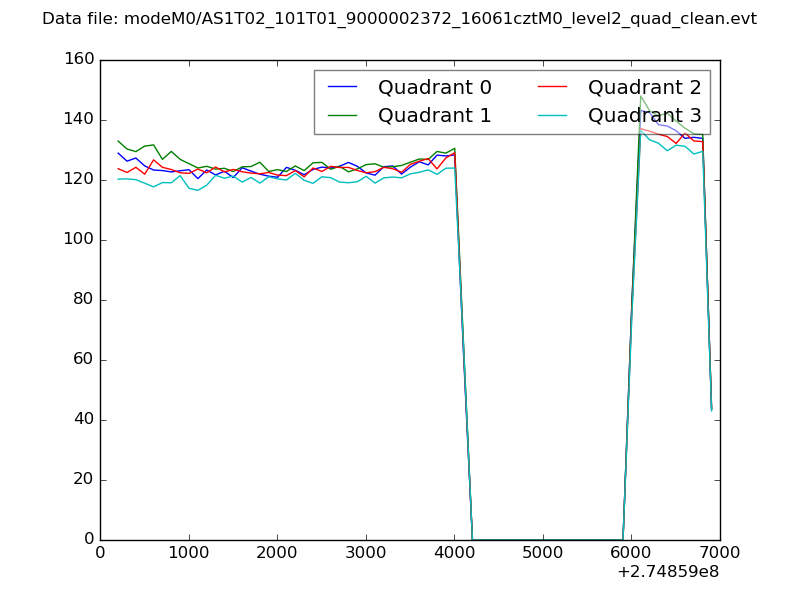 |
|
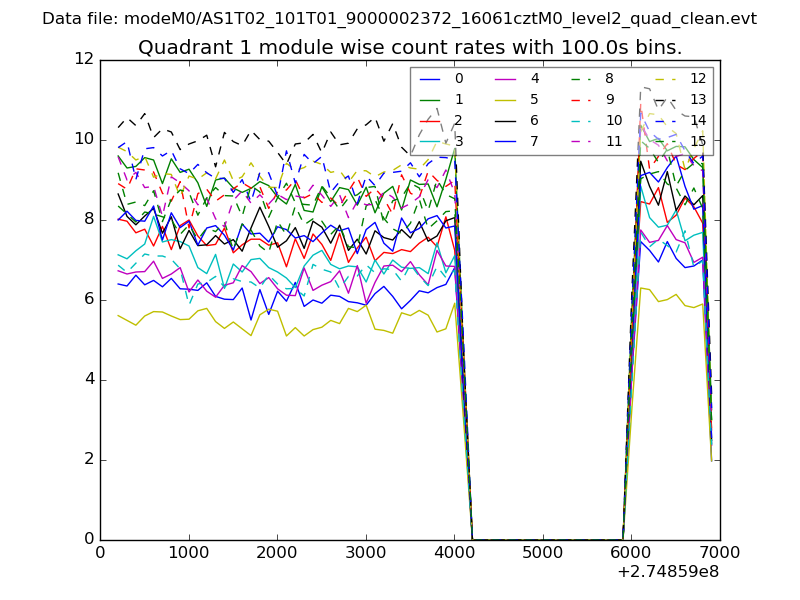
| Module-wise count rates for Quadrant A Data is divided into 100 sec bins |
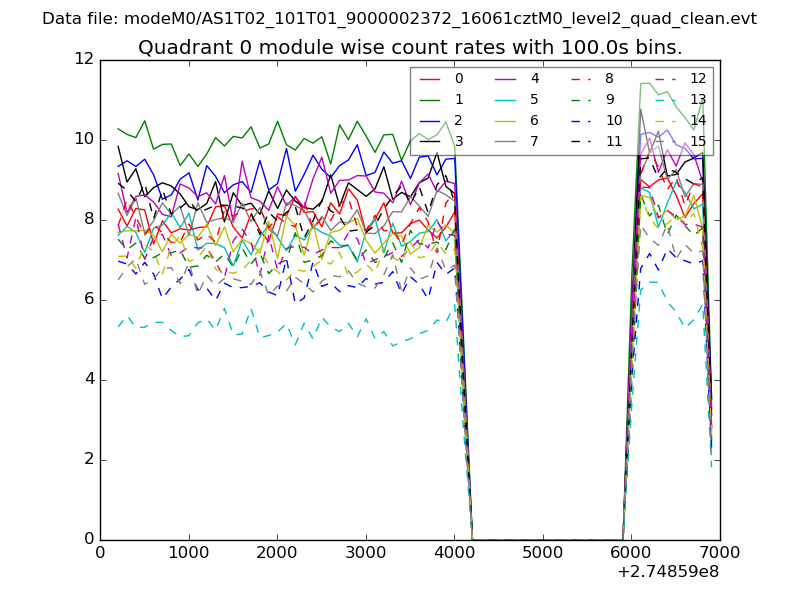 |
 |
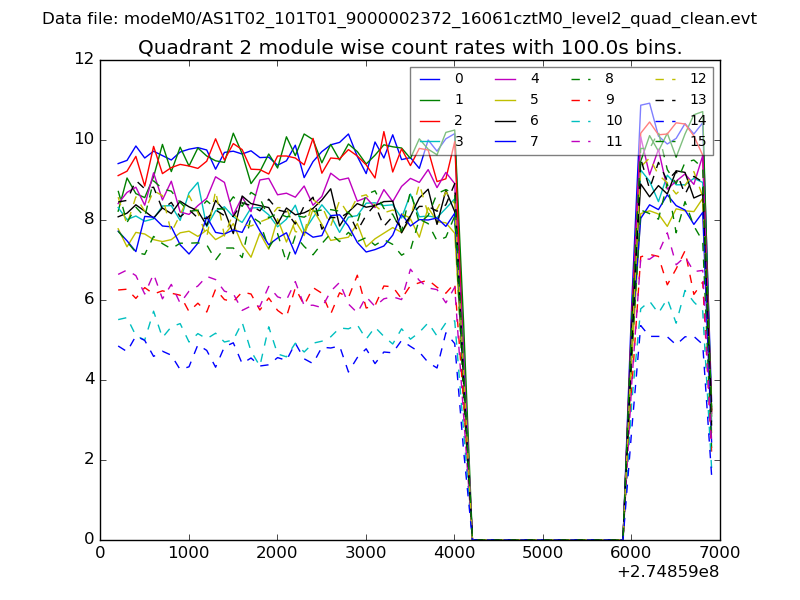
| Module-wise count rates for Quadrant B Data is divided into 100 sec bins |
 |
 |
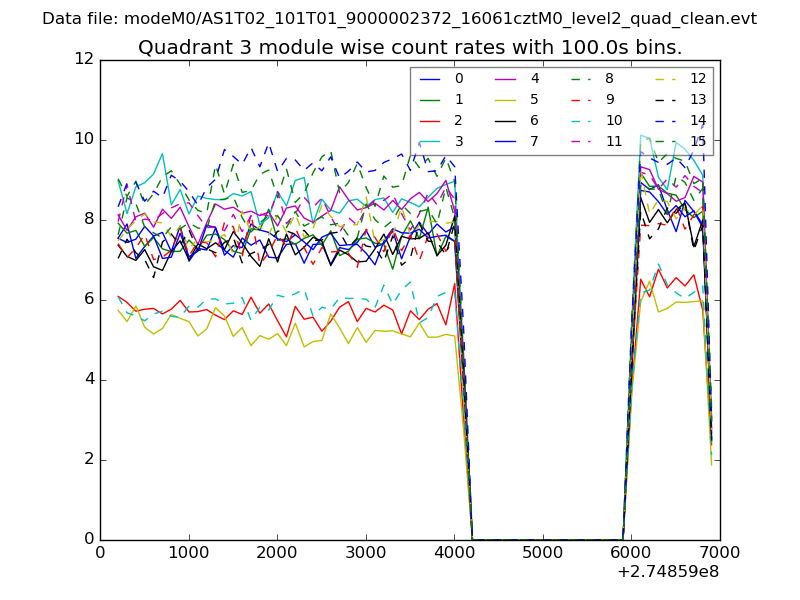
| Module-wise count rates for Quadrant C Data is divided into 100 sec bins |
 |
 |
| Module-wise count rates for Quadrant D Data is divided into 100 sec bins |
 |
 |
| Parameter | Plot |
|---|---|
| CZT HV Monitor | 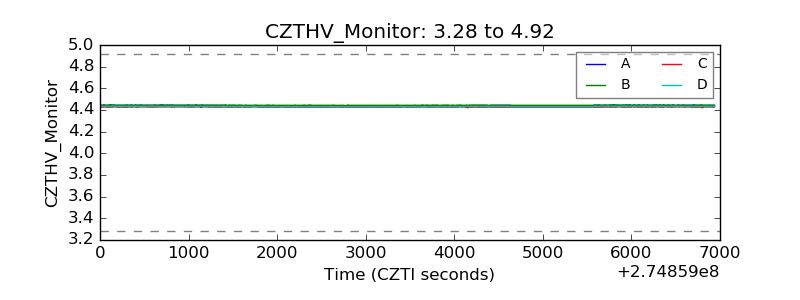 |
| D_VDD | 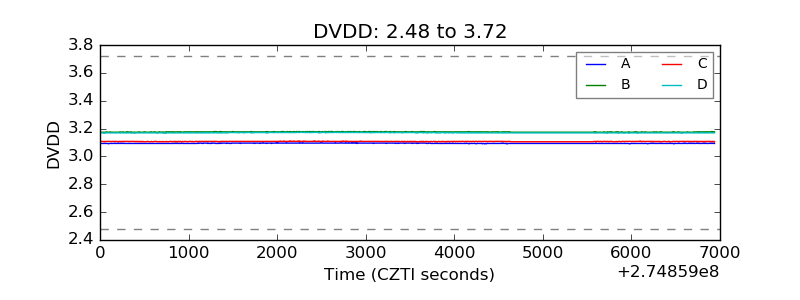 |
| Temperature 1 | 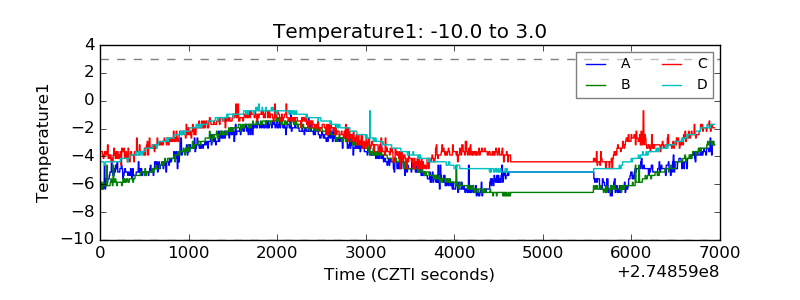 |
| Veto HV Monitor | 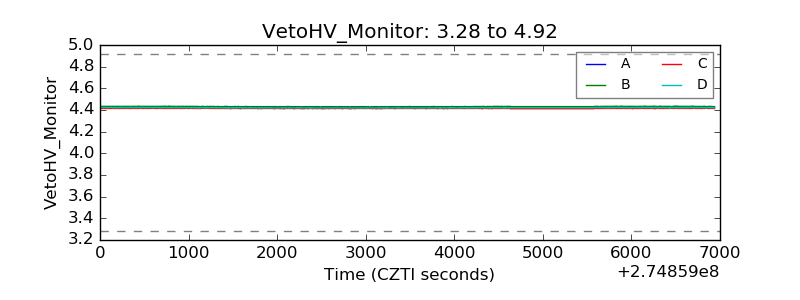 |
| Veto LLD | 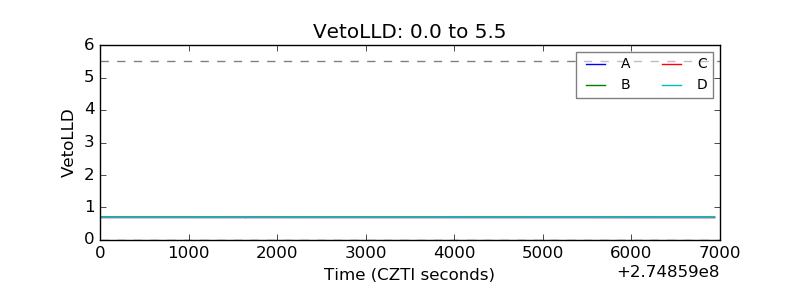 |
| Alpha Counter | 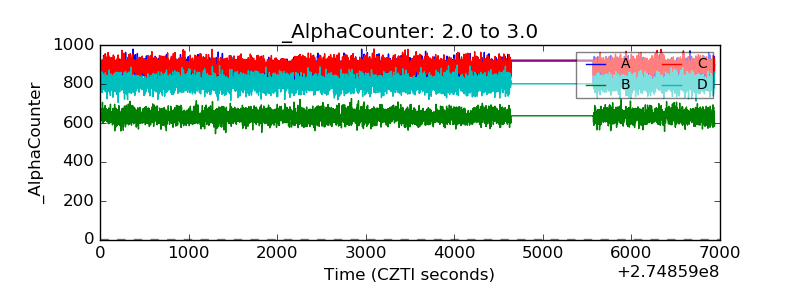 |
| _CPM_Rate | 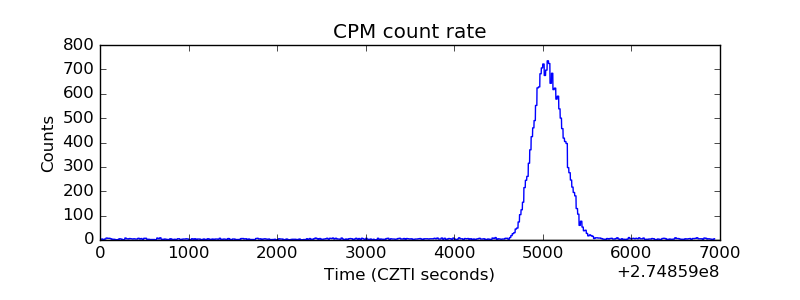 |
| CZT Counter | 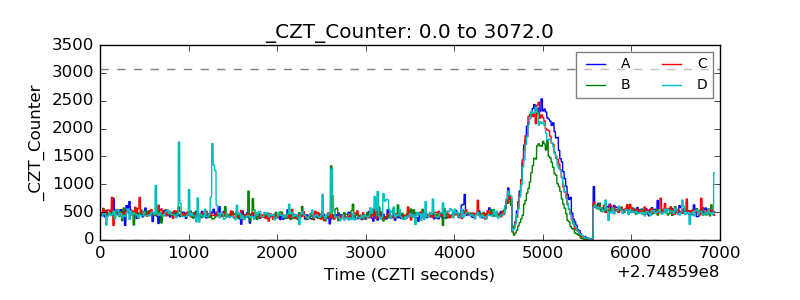 |
| +2.5 Volts monitor | 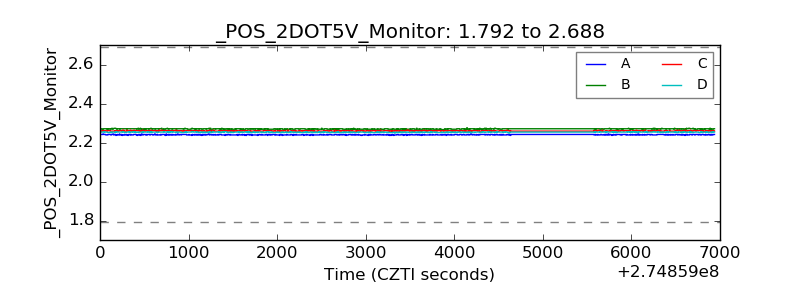 |
| +5 Volts monitor |  |
| _ROLL_ROT | 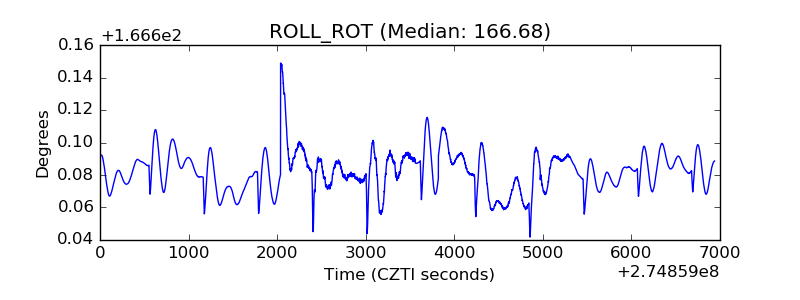 |
| _Roll_DEC | 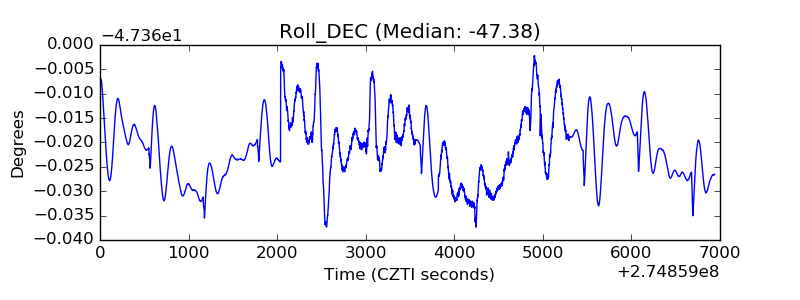 |
| _Roll_RA | 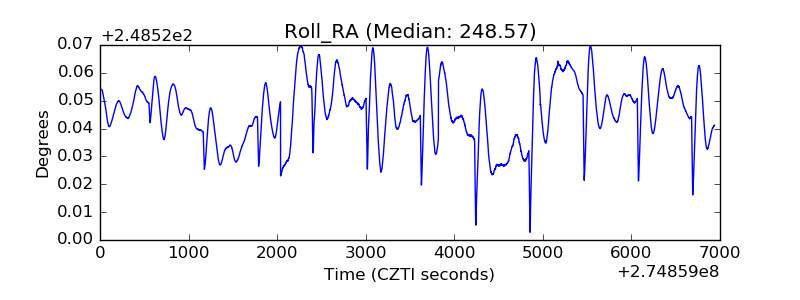 |
| Veto Counter | 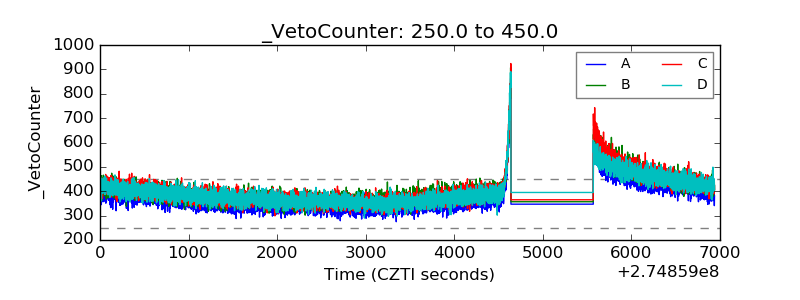 |