| Param | Original file | Final file |
|---|---|---|
| Filename | modeM0/AS1T02_101T01_9000002372_16062cztM0_level2.evt | modeM0/AS1T02_101T01_9000002372_16062cztM0_level2_quad_clean.evt |
| Size (bytes) | 216,904,320 | 58,703,040 |
| Size | 206.9 MB | 56.0 MB |
| Events in quadrant A | 1,693,631 | 392,253 |
| Events in quadrant B | 1,463,227 | 398,944 |
| Events in quadrant C | 1,418,795 | 389,844 |
| Events in quadrant D | 1,782,620 | 377,972 |
| Mode SS | |||
|---|---|---|---|
| Quadrant | BADHDUFLAG | Total packets | Discarded packets |
| A | 0 | 62 | 0 |
| B | 0 | 62 | 0 |
| C | 0 | 62 | 0 |
| D | 0 | 62 | 0 |
| Mode M0 | |||
|---|---|---|---|
| Quadrant | BADHDUFLAG | Total packets | Discarded packets |
| A | 0 | 6916 | 0 |
| B | 0 | 6237 | 0 |
| C | 0 | 6192 | 0 |
| D | 0 | 7305 | 0 |
| Quadrant | Total seconds | Saturated seconds | Saturation percentage |
|---|---|---|---|
| A | 3068 | 36 | 1.173403% |
| B | 3068 | 3 | 0.097784% |
| C | 3068 | 15 | 0.488918% |
| D | 3068 | 99 | 3.226858% |
Noise dominated data is calculated using 1-second bins in cleaned event files. If a bin has >2000 counts, and if more than 50% of those come from <1% of pixels, then it is considered to be noise-dominated and hence unusable.
| Quadrant | # 1 sec bins | Bins with >0 counts | Bins with >2000 counts | High rate bins dominated by noise | Noise dominated (total time) | Noise dominated (detector-on time) | Marked lightcurve |
|---|---|---|---|---|---|---|---|
| A | 3069 | 3069 | 33 | 33 | 1.08% | 1.08% | 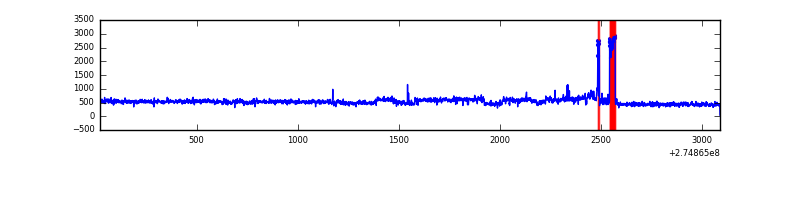 |
| B | 3069 | 3069 | 1 | 1 | 0.03% | 0.03% | 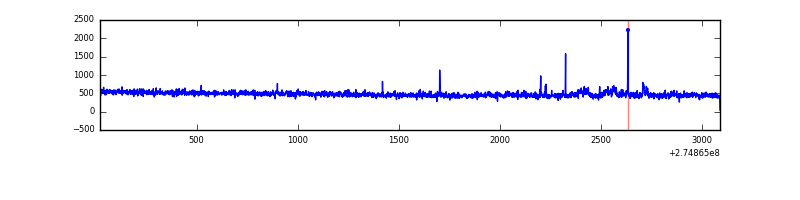 |
| C | 3069 | 3069 | 0 | 0 | 0.00% | 0.00% | 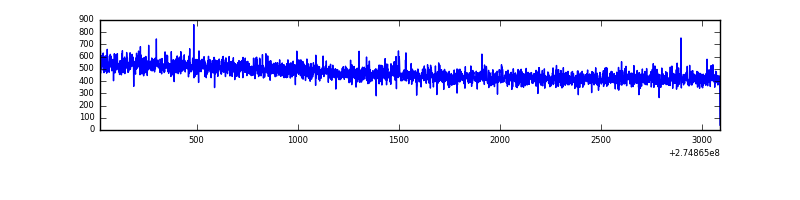 |
| D | 3069 | 3069 | 119 | 119 | 3.88% | 3.88% | 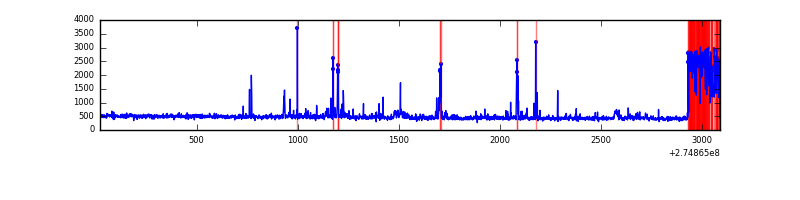 |
Top three noisy pixels from each quadrant. If the there are fewer than three noisy pixels in the level2.evt file, extra rows are filled as -1
| Pixel properties | Quadrant properties | ||||||
|---|---|---|---|---|---|---|---|
| Quadrant | DetID | PixID | Counts | Sigma | Mean | Median | Sigma |
| A | 3 | 80 | 193672 | 2604.41 | 363 | 356 | 74.2 |
| A | 15 | 69 | 95008 | 1275.18 | 363 | 356 | 74.2 |
| A | 9 | 143 | 4716 | 58.74 | 363 | 356 | 74.2 |
| B | 4 | 216 | 24384 | 341.32 | 360 | 351 | 70.4 |
| B | 0 | 219 | 8028 | 109.03 | 360 | 351 | 70.4 |
| B | 12 | 111 | 7590 | 102.81 | 360 | 351 | 70.4 |
| C | 14 | 238 | 53372 | 639.74 | 348 | 350 | 82.9 |
| C | 3 | 233 | 4586 | 51.11 | 348 | 350 | 82.9 |
| C | 0 | 207 | 2571 | 26.8 | 348 | 350 | 82.9 |
| D | 1 | 52 | 355230 | 3994.23 | 355 | 344 | 88.8 |
| D | 7 | 38 | 18754 | 207.2 | 355 | 344 | 88.8 |
| D | 12 | 218 | 18438 | 203.65 | 355 | 344 | 88.8 |
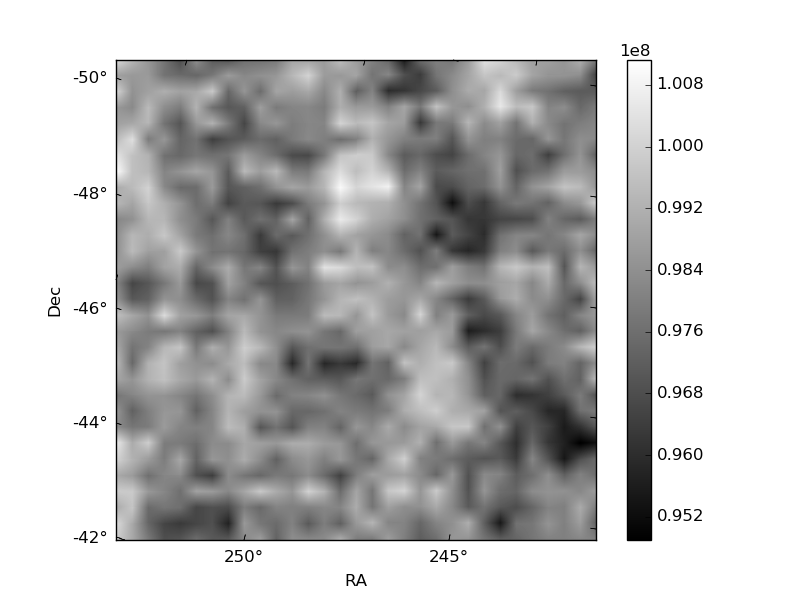
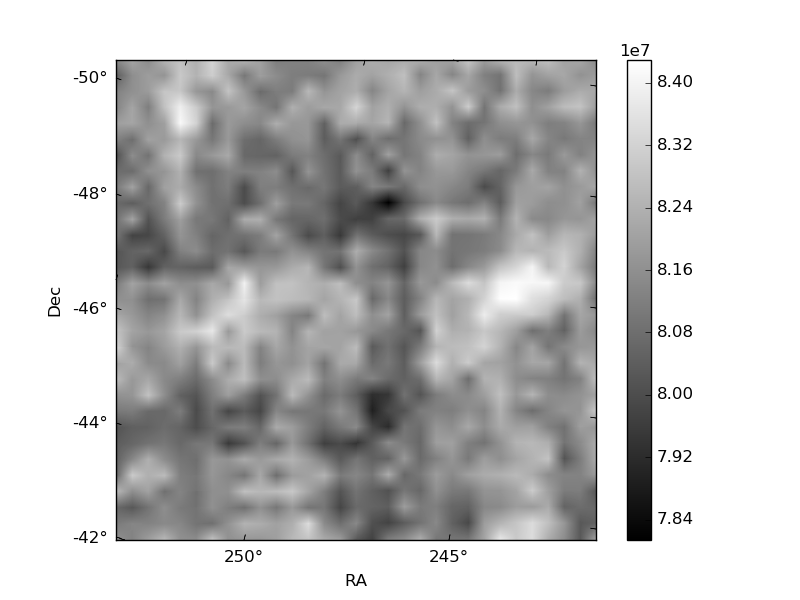
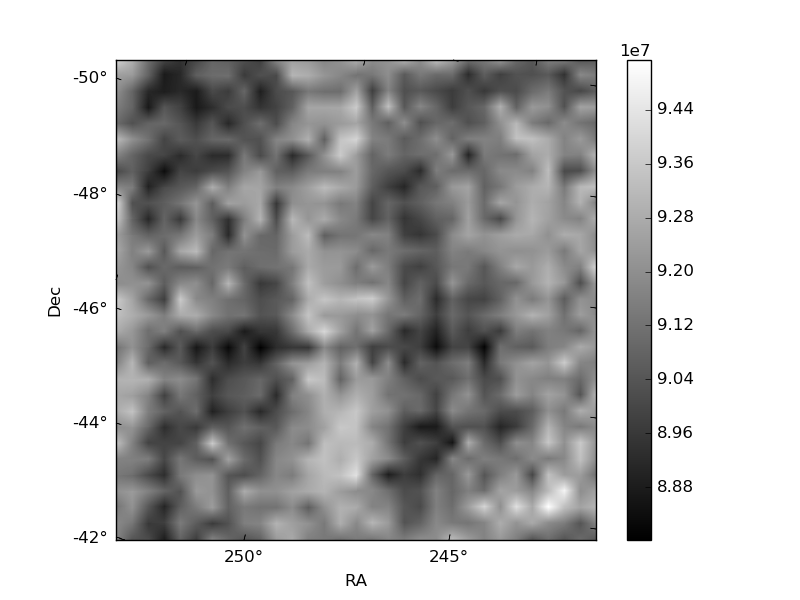
Histogram calculated using DETX and DETY for each event in the final _common_clean file
| Quadrant A | 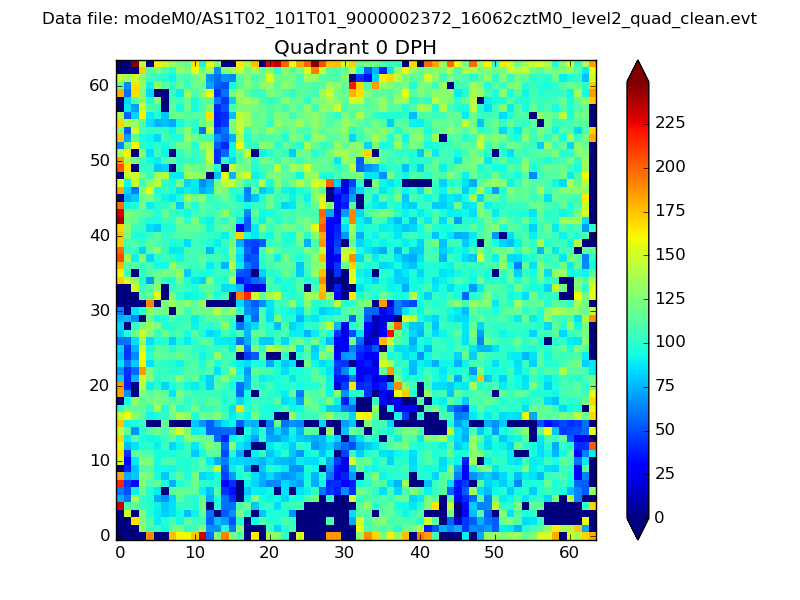 |
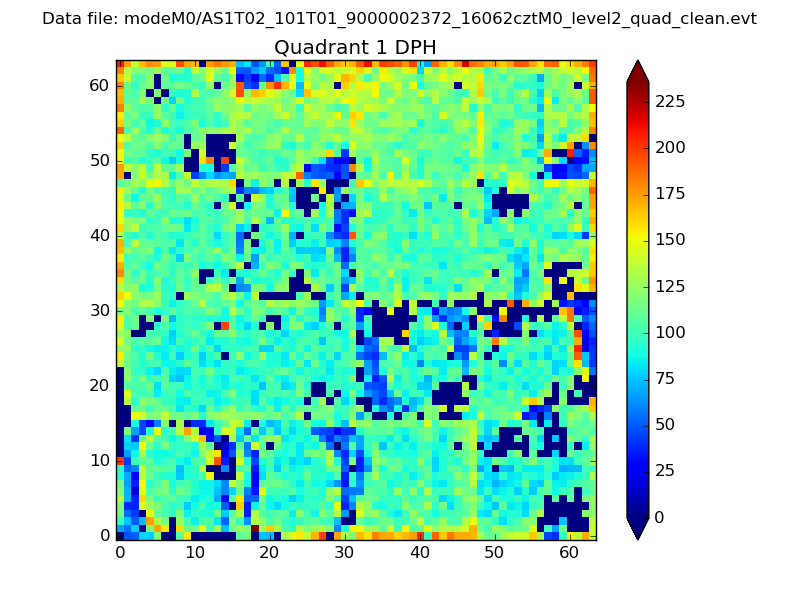 |
Quadrant B |
|---|---|---|---|
| Quadrant D | 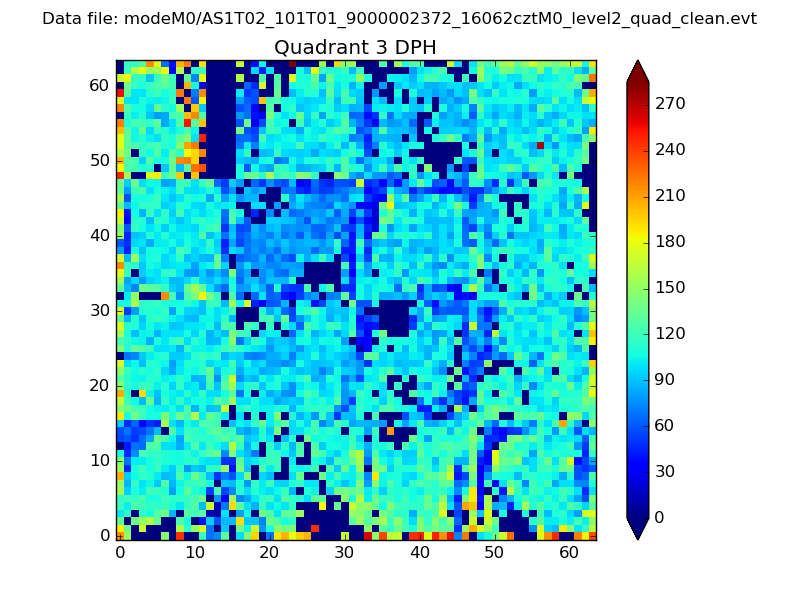 |
 |
Quadrant C |
| Plot type | Count rate plots | Images |
|---|---|---|
| Comparison with Poisson distribution Blue bars denote a histogram of data divided into 1 sec bins. Red curve is a Poisson curve with rate = median count rate of data. |
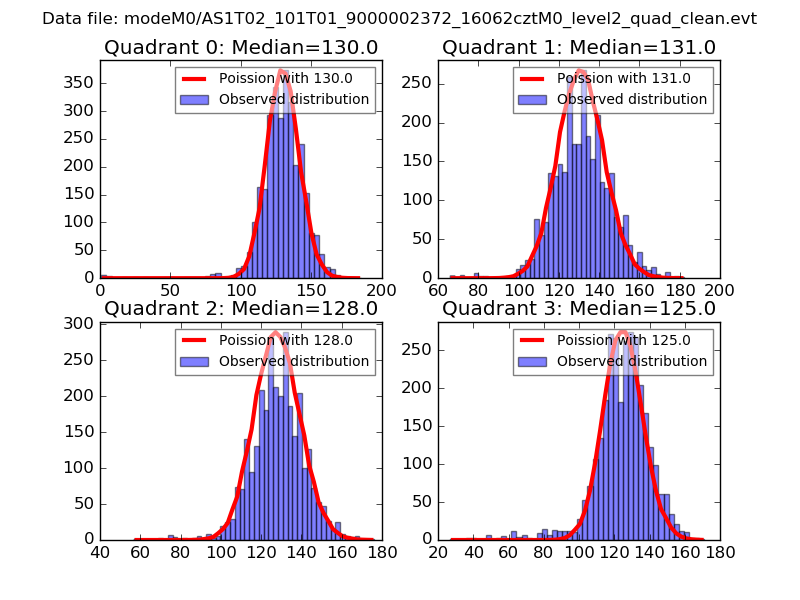 |
 |
| Quadrant-wise count rates Data is divided into 100 sec bins |
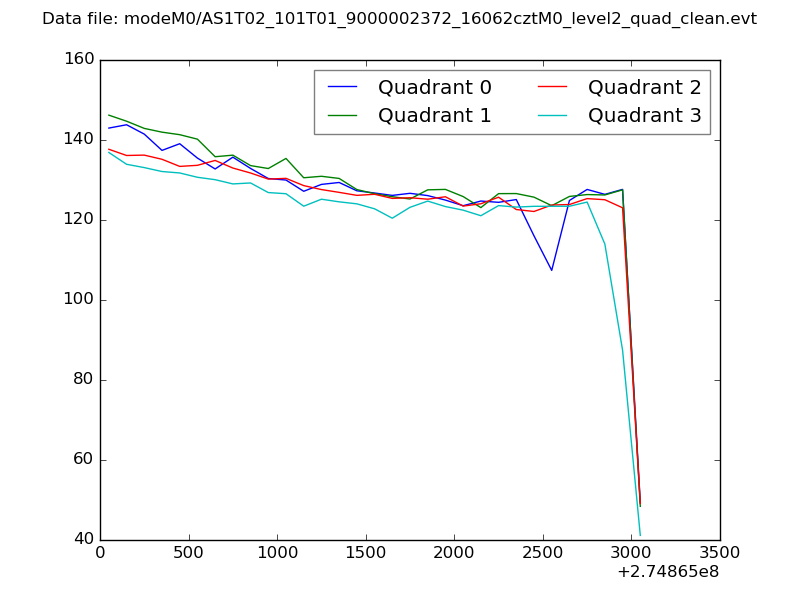 |
|
| Module-wise count rates for Quadrant A Data is divided into 100 sec bins |
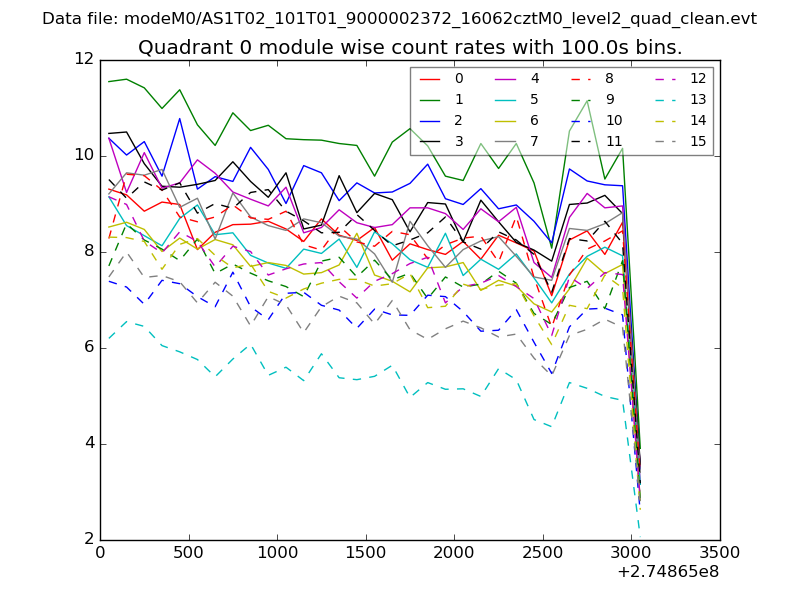 |
 |
| Module-wise count rates for Quadrant B Data is divided into 100 sec bins |
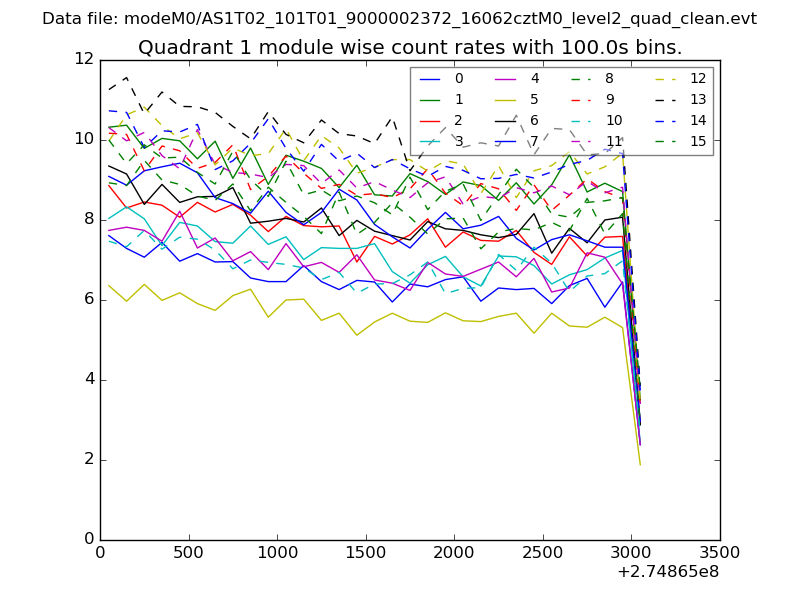 |
 |
| Module-wise count rates for Quadrant C Data is divided into 100 sec bins |
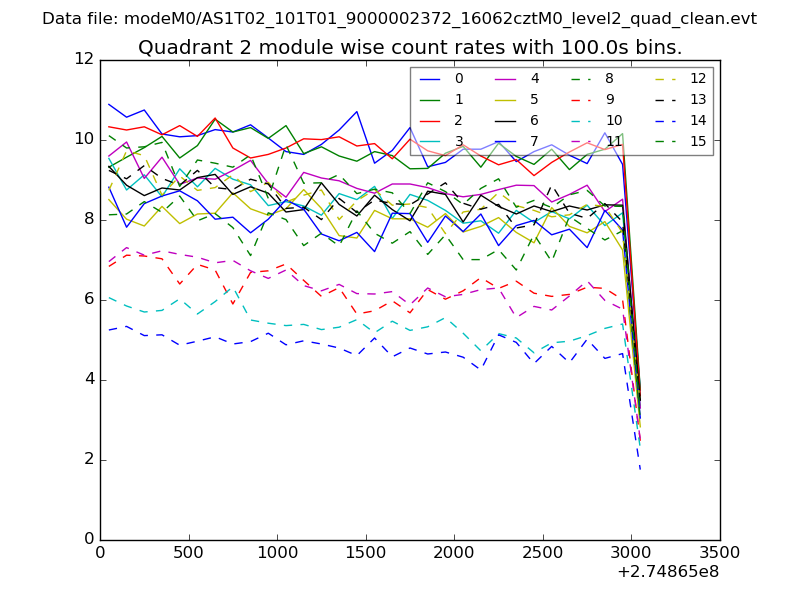 |
 |
| Module-wise count rates for Quadrant D Data is divided into 100 sec bins |
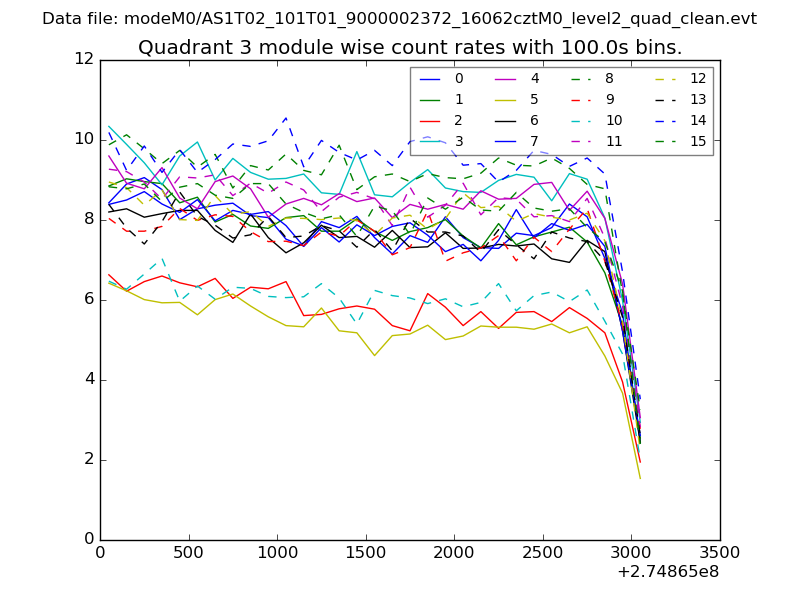 |
 |
| Parameter | Plot |
|---|---|
| CZT HV Monitor | 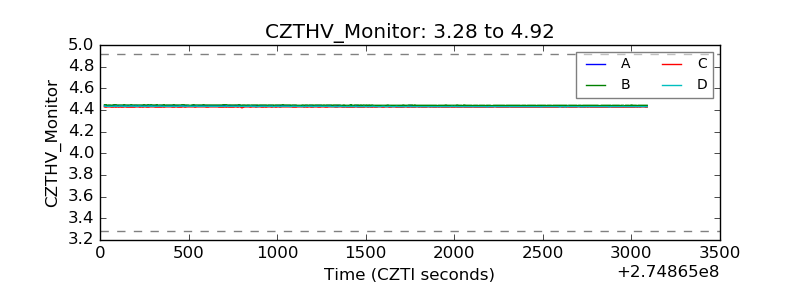 |
| D_VDD | 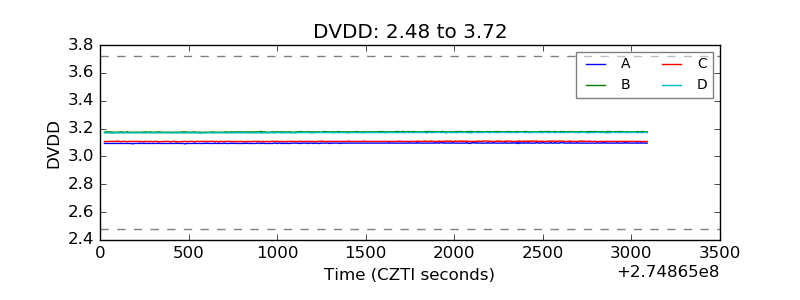 |
| Temperature 1 | 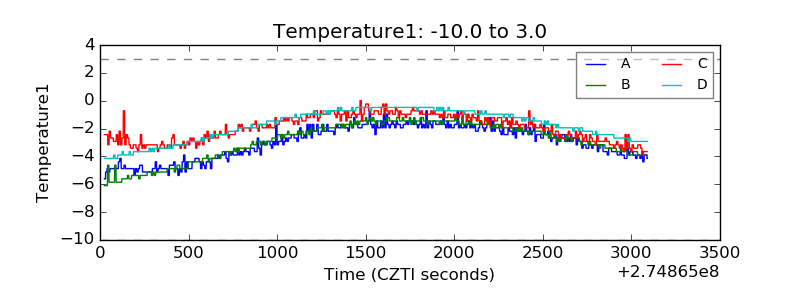 |
| Veto HV Monitor |  |
| Veto LLD | 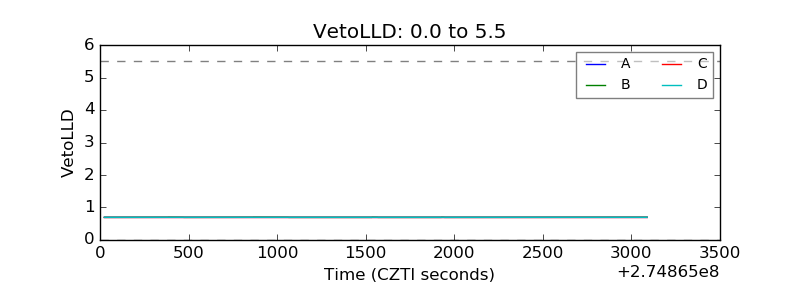 |
| Alpha Counter | 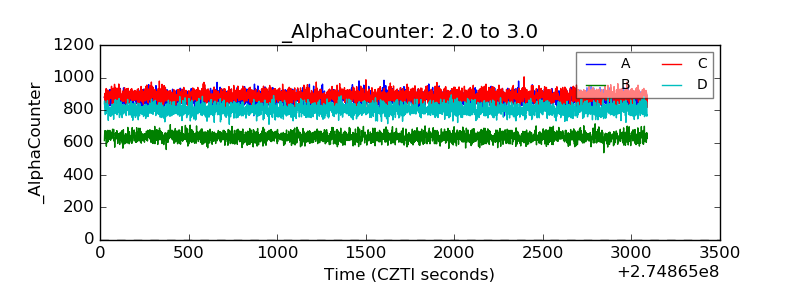 |
| _CPM_Rate | 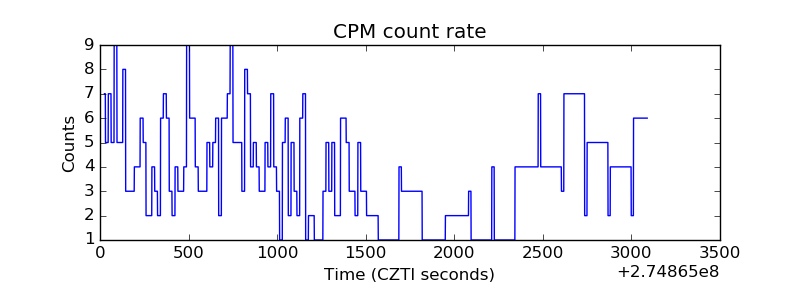 |
| CZT Counter | 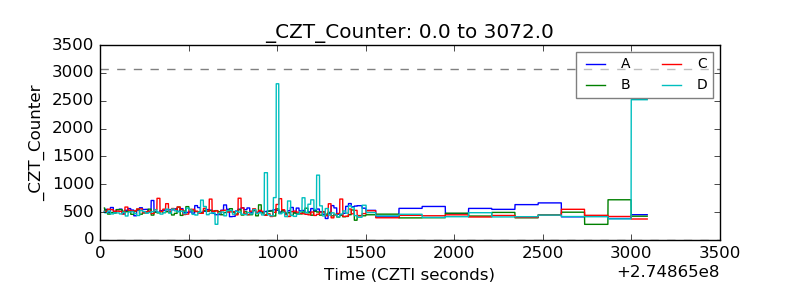 |
| +2.5 Volts monitor |  |
| +5 Volts monitor | 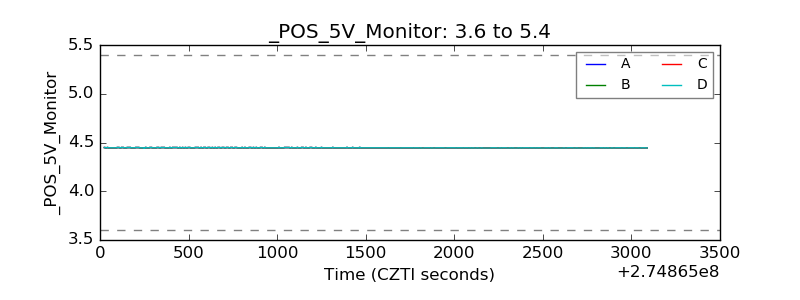 |
| _ROLL_ROT | 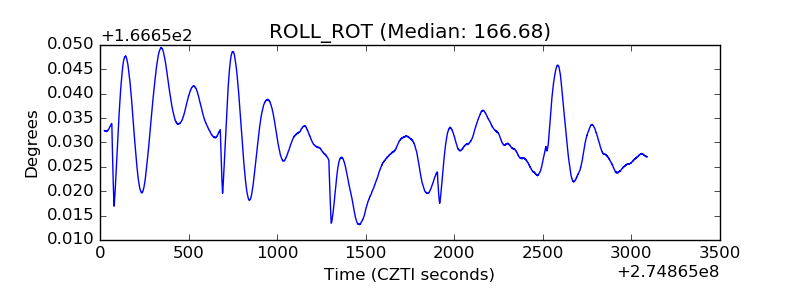 |
| _Roll_DEC | 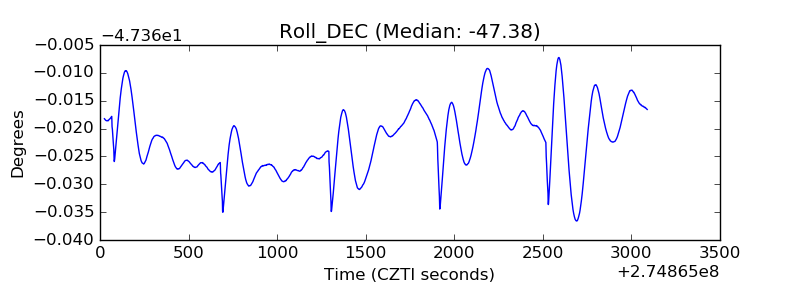 |
| _Roll_RA | 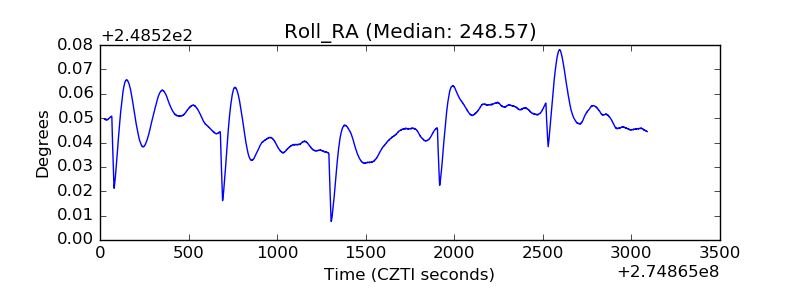 |
| Veto Counter | 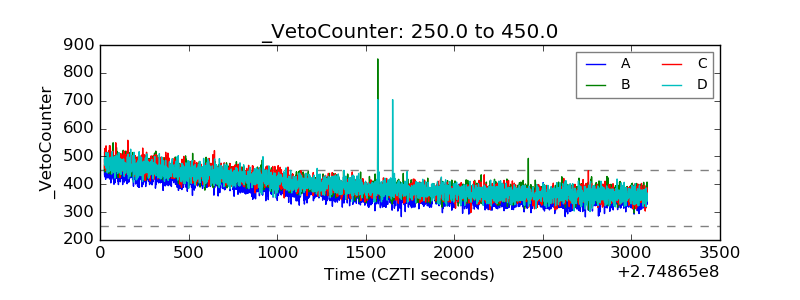 |