| Param | Original file | Final file |
|---|---|---|
| Filename | modeM0/AS1T02_110T01_9000002376cztM0_level2.fits | modeM0/AS1T02_110T01_9000002376cztM0_level2_quad_clean.evt |
| Size (bytes) | 875,232,000 | 791,107,200 |
| Size | 834.7 MB | 754.5 MB |
| Events in quadrant A | 5,412,776 | 4,773,640 |
| Events in quadrant B | 5,119,984 | 4,665,373 |
| Events in quadrant C | 5,204,944 | 4,412,872 |
| Events in quadrant D | 4,480,974 | 3,820,490 |
| Mode SS | |||
|---|---|---|---|
| Quadrant | BADHDUFLAG | Total packets | Discarded packets |
| A | 0 | 1868 | 0 |
| B | 0 | 1868 | 0 |
| C | 0 | 1868 | 0 |
| D | 0 | 1868 | 0 |
| Mode M9 | |||
|---|---|---|---|
| Quadrant | BADHDUFLAG | Total packets | Discarded packets |
| A | 0 | 160 | 0 |
| B | 0 | 160 | 0 |
| C | 0 | 160 | 0 |
| D | 0 | 160 | 0 |
| Mode M0 | |||
|---|---|---|---|
| Quadrant | BADHDUFLAG | Total packets | Discarded packets |
| A | 0 | 194956 | 0 |
| B | 0 | 206572 | 0 |
| C | 0 | 193046 | 0 |
| D | 0 | 236476 | 0 |
| Quadrant | Total seconds | Saturated seconds | Saturation percentage |
|---|---|---|---|
| A | 91694 | 1278 | 1.393766% |
| B | 91694 | 1537 | 1.676227% |
| C | 91694 | 1273 | 1.388313% |
| D | 91694 | 5765 | 6.287216% |
Noise dominated data is calculated using 1-second bins in cleaned event files. If a bin has >2000 counts, and if more than 50% of those come from <1% of pixels, then it is considered to be noise-dominated and hence unusable.
| Quadrant | # 1 sec bins | Bins with >0 counts | Bins with >2000 counts | High rate bins dominated by noise | Noise dominated (total time) | Noise dominated (detector-on time) | Marked lightcurve |
|---|---|---|---|---|---|---|---|
| A | 107618 | 91662 | 0 | 0 | 0.00% | 0.00% |  |
| B | 107618 | 91676 | 0 | 0 | 0.00% | 0.00% |  |
| C | 107619 | 91674 | 0 | 0 | 0.00% | 0.00% |  |
| D | 107618 | 91597 | 0 | 0 | 0.00% | 0.00% |  |
Top three noisy pixels from each quadrant. If the there are fewer than three noisy pixels in the level2.evt file, extra rows are filled as -1
| Pixel properties | Quadrant properties | ||||||
|---|---|---|---|---|---|---|---|
| Quadrant | DetID | PixID | Counts | Sigma | Mean | Median | Sigma |
| A | 0 | 29 | 5211 | 11.17 | 1408 | 1322 | 348.1 |
| A | 7 | 110 | 4293 | 8.53 | 1408 | 1322 | 348.1 |
| A | 0 | 30 | 4157 | 8.14 | 1408 | 1322 | 348.1 |
| B | 2 | 9 | 4249 | 11.05 | 1359 | 1299 | 266.9 |
| B | 2 | 8 | 3538 | 8.39 | 1359 | 1299 | 266.9 |
| B | 5 | 128 | 3443 | 8.03 | 1359 | 1299 | 266.9 |
| C | 12 | 241 | 3635 | 6.7 | 1375 | 1279 | 351.6 |
| C | 3 | 126 | 3594 | 6.58 | 1375 | 1279 | 351.6 |
| C | 2 | 191 | 3558 | 6.48 | 1375 | 1279 | 351.6 |
| D | 3 | 14 | 3306 | 6.33 | 1279 | 1166 | 338.3 |
| D | 7 | 3 | 3149 | 5.86 | 1279 | 1166 | 338.3 |
| D | 10 | 189 | 3133 | 5.81 | 1279 | 1166 | 338.3 |
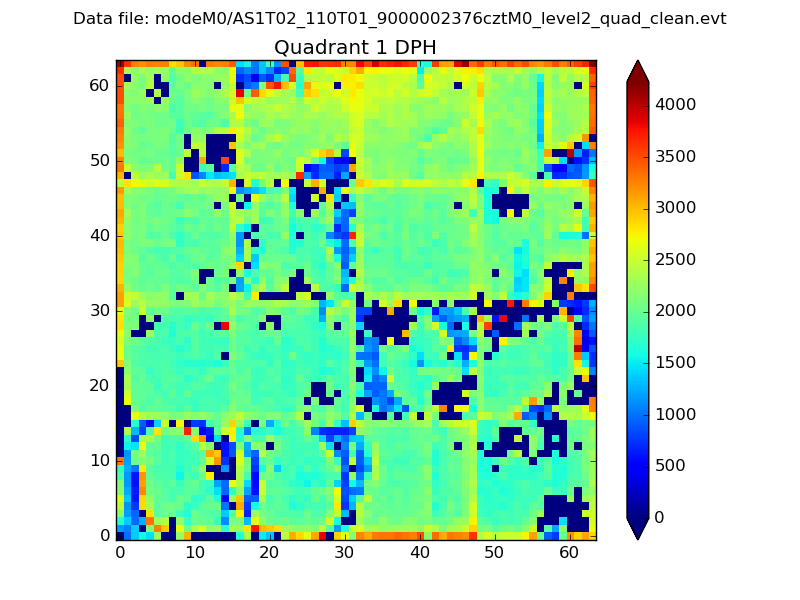
Histogram calculated using DETX and DETY for each event in the final _common_clean file
| Quadrant A |  |
 |
Quadrant B |
|---|---|---|---|
| Quadrant D |  |
 |
Quadrant C |
| Plot type | Count rate plots | Images |
|---|---|---|
| Comparison with Poisson distribution Blue bars denote a histogram of data divided into 1 sec bins. Red curve is a Poisson curve with rate = median count rate of data. |
 |
 |
| Quadrant-wise count rates Data is divided into 100 sec bins |
 |
|
| Module-wise count rates for Quadrant A Data is divided into 100 sec bins |
 |
 |
| Module-wise count rates for Quadrant B Data is divided into 100 sec bins |
 |
 |
| Module-wise count rates for Quadrant C Data is divided into 100 sec bins |
 |
 |
| Module-wise count rates for Quadrant D Data is divided into 100 sec bins |
 |
 |
| Parameter | Plot |
|---|---|
| CZT HV Monitor |  |
| D_VDD | 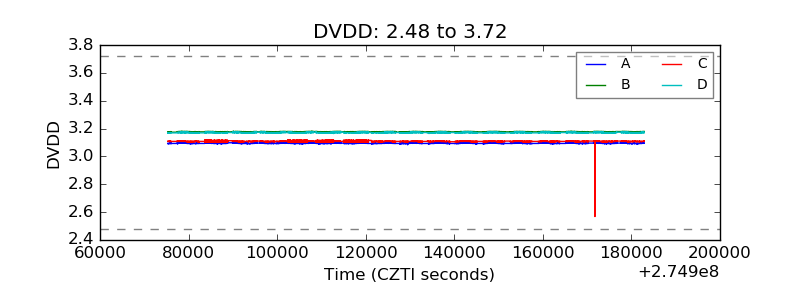 |
| Temperature 1 |  |
| Veto HV Monitor |  |
| Veto LLD |  |
| Alpha Counter |  |
| _CPM_Rate |  |
| CZT Counter |  |
| +2.5 Volts monitor |  |
| +5 Volts monitor |  |
| _ROLL_ROT |  |
| _Roll_DEC |  |
| _Roll_RA |  |
| Veto Counter |  |