| Param | Original file | Final file |
|---|---|---|
| Filename | modeM0/AS1T02_110T01_9000002376_16081cztM0_level2.evt | modeM0/AS1T02_110T01_9000002376_16081cztM0_level2_quad_clean.evt |
| Size (bytes) | 175,118,400 | 33,289,920 |
| Size | 167.0 MB | 31.7 MB |
| Events in quadrant A | 1,264,424 | 217,835 |
| Events in quadrant B | 1,343,184 | 219,067 |
| Events in quadrant C | 1,209,901 | 205,882 |
| Events in quadrant D | 1,333,403 | 204,887 |
| Mode SS | |||
|---|---|---|---|
| Quadrant | BADHDUFLAG | Total packets | Discarded packets |
| A | 0 | 46 | 0 |
| B | 0 | 46 | 0 |
| C | 0 | 46 | 0 |
| D | 0 | 46 | 0 |
| Mode M9 | |||
|---|---|---|---|
| Quadrant | BADHDUFLAG | Total packets | Discarded packets |
| A | 0 | 14 | 0 |
| B | 0 | 14 | 0 |
| C | 0 | 14 | 0 |
| D | 0 | 14 | 0 |
| Mode M0 | |||
|---|---|---|---|
| Quadrant | BADHDUFLAG | Total packets | Discarded packets |
| A | 0 | 5026 | 1 |
| B | 0 | 5402 | 0 |
| C | 0 | 4838 | 0 |
| D | 0 | 5339 | 0 |
| Quadrant | Total seconds | Saturated seconds | Saturation percentage |
|---|---|---|---|
| A | 2213 | 97 | 4.383190% |
| B | 2213 | 73 | 3.298690% |
| C | 2213 | 87 | 3.931315% |
| D | 2213 | 76 | 3.434252% |
Noise dominated data is calculated using 1-second bins in cleaned event files. If a bin has >2000 counts, and if more than 50% of those come from <1% of pixels, then it is considered to be noise-dominated and hence unusable.
| Quadrant | # 1 sec bins | Bins with >0 counts | Bins with >2000 counts | High rate bins dominated by noise | Noise dominated (total time) | Noise dominated (detector-on time) | Marked lightcurve |
|---|---|---|---|---|---|---|---|
| A | 3519 | 2214 | 19 | 19 | 0.54% | 0.86% | 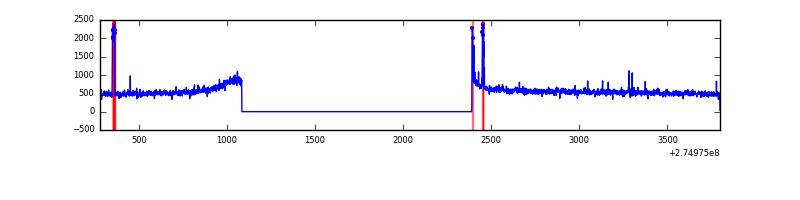 |
| B | 3519 | 2214 | 0 | 0 | 0.00% | 0.00% | 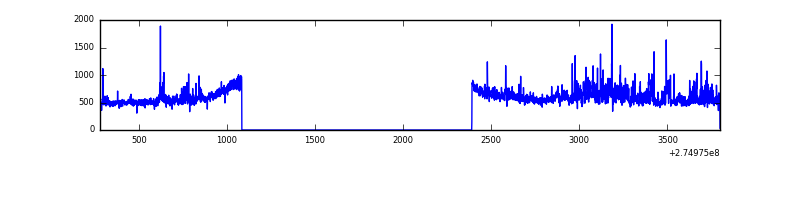 |
| C | 3519 | 2214 | 1 | 1 | 0.03% | 0.05% | 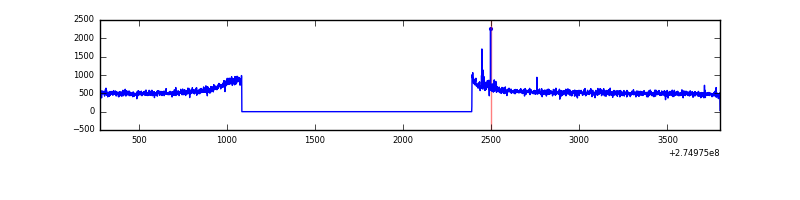 |
| D | 3519 | 2214 | 18 | 18 | 0.51% | 0.81% | 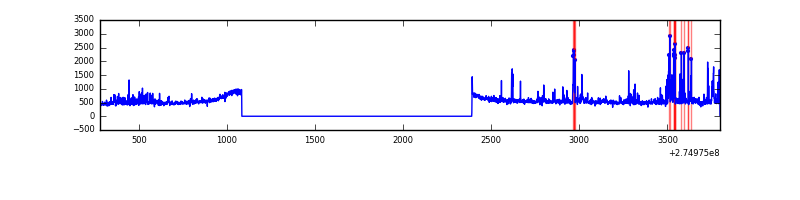 |
Top three noisy pixels from each quadrant. If the there are fewer than three noisy pixels in the level2.evt file, extra rows are filled as -1
| Pixel properties | Quadrant properties | ||||||
|---|---|---|---|---|---|---|---|
| Quadrant | DetID | PixID | Counts | Sigma | Mean | Median | Sigma |
| A | 15 | 239 | 53883 | 829.25 | 309 | 302 | 64.6 |
| A | 3 | 80 | 12438 | 187.82 | 309 | 302 | 64.6 |
| A | 9 | 143 | 6924 | 102.49 | 309 | 302 | 64.6 |
| B | 7 | 220 | 72469 | 1210.47 | 307 | 299 | 59.6 |
| B | 0 | 189 | 15618 | 256.94 | 307 | 299 | 59.6 |
| B | 4 | 216 | 15072 | 247.78 | 307 | 299 | 59.6 |
| C | 14 | 238 | 44543 | 641.11 | 292 | 294 | 69.0 |
| C | 3 | 233 | 11206 | 158.1 | 292 | 294 | 69.0 |
| C | 0 | 207 | 10910 | 153.81 | 292 | 294 | 69.0 |
| D | 5 | 222 | 112536 | 1497.79 | 303 | 293 | 74.9 |
| D | 12 | 218 | 26208 | 345.81 | 303 | 293 | 74.9 |
| D | 7 | 38 | 19774 | 259.96 | 303 | 293 | 74.9 |
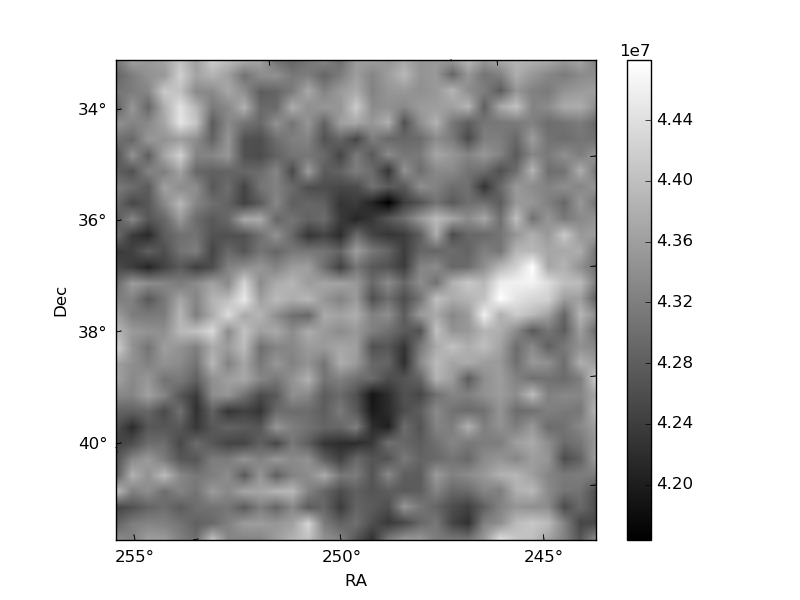
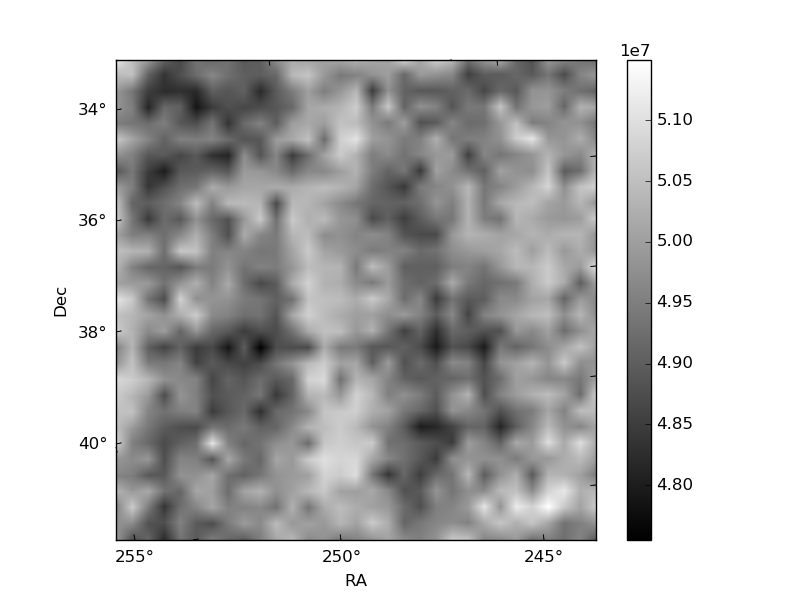
Histogram calculated using DETX and DETY for each event in the final _common_clean file
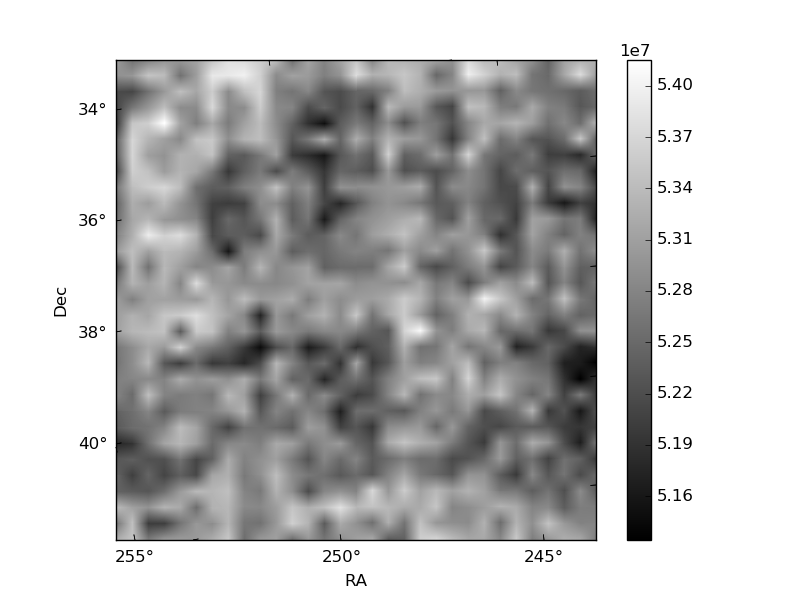
| Quadrant A |  |
 |
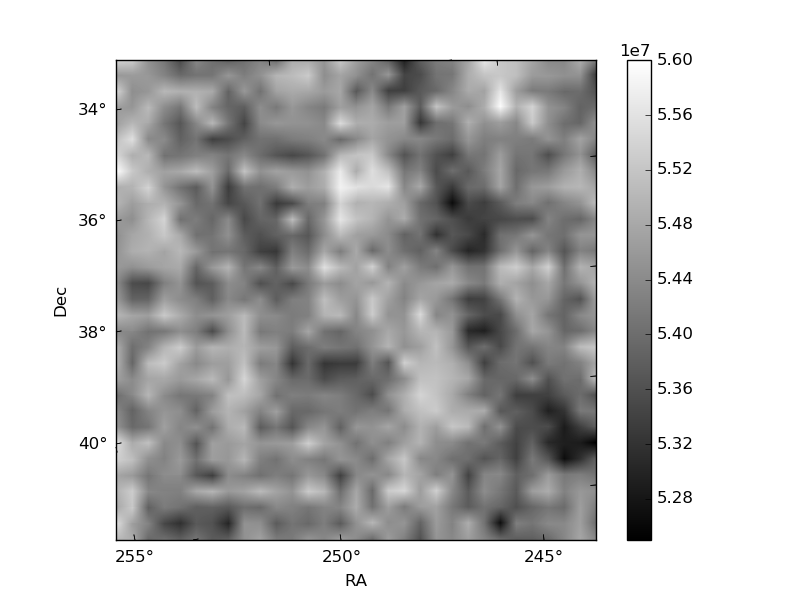
Quadrant B |
|---|---|---|---|
| Quadrant D | 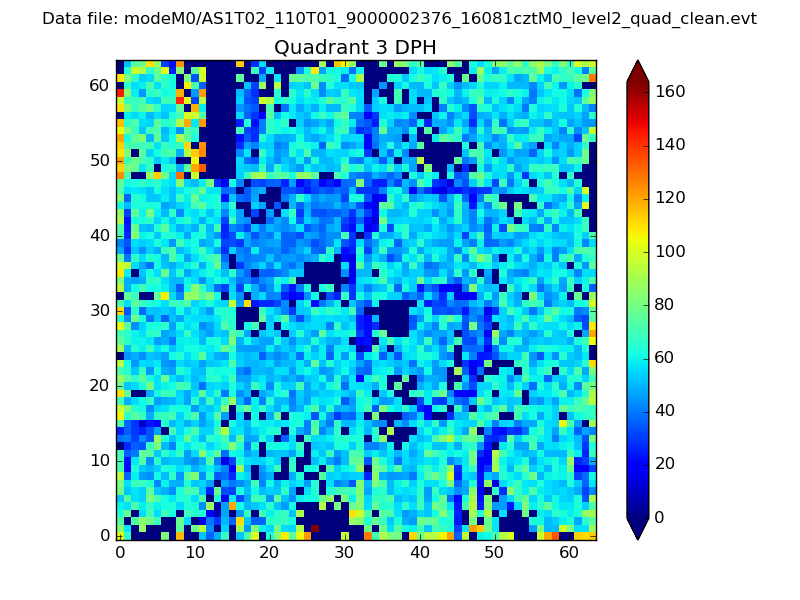 |
 |
Quadrant C |
| Plot type | Count rate plots | Images |
|---|---|---|
| Comparison with Poisson distribution Blue bars denote a histogram of data divided into 1 sec bins. Red curve is a Poisson curve with rate = median count rate of data. |
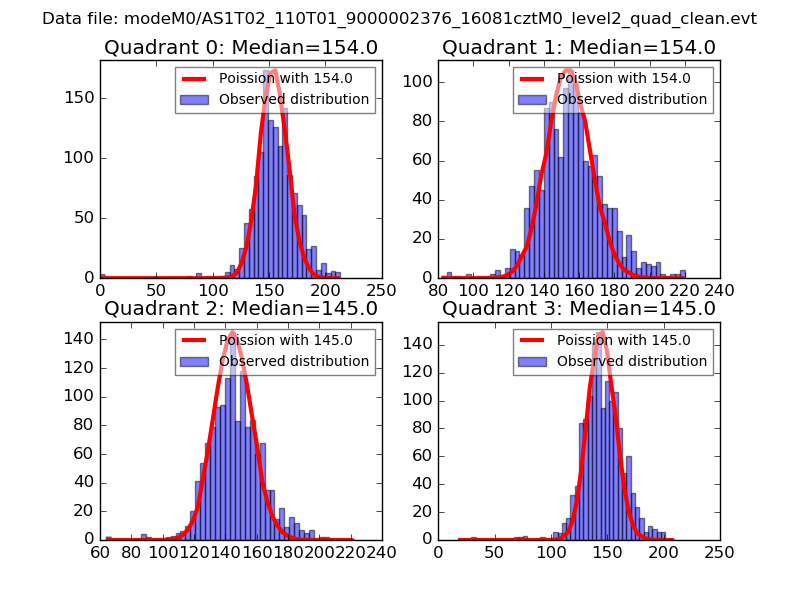 |
 |
| Quadrant-wise count rates Data is divided into 100 sec bins |
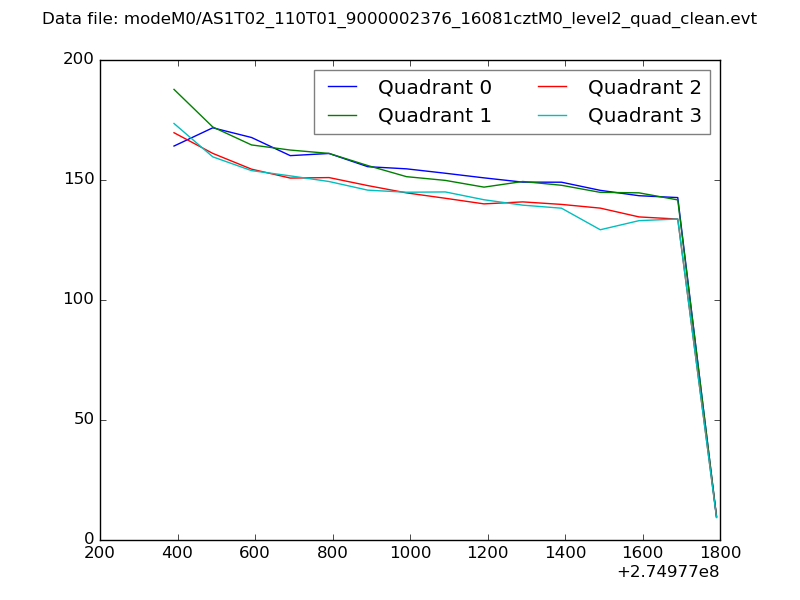 |
|
| Module-wise count rates for Quadrant A Data is divided into 100 sec bins |
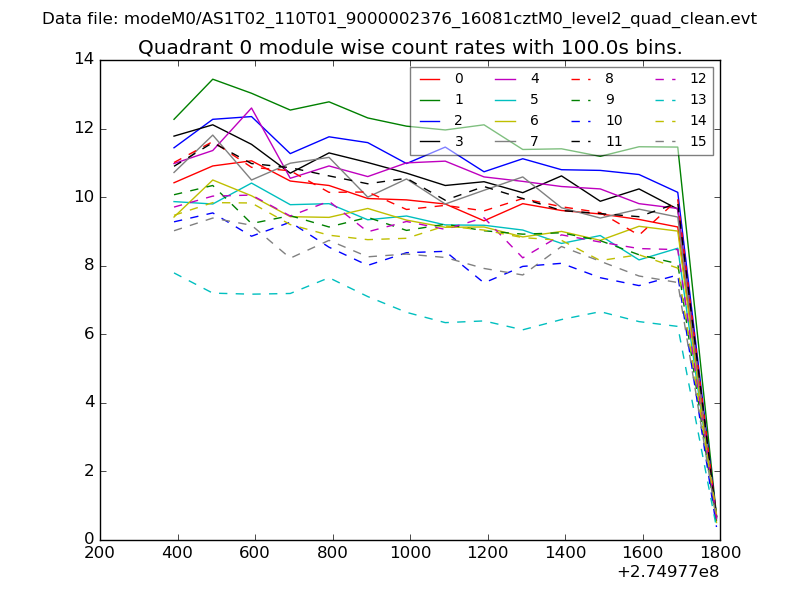 |
 |
| Module-wise count rates for Quadrant B Data is divided into 100 sec bins |
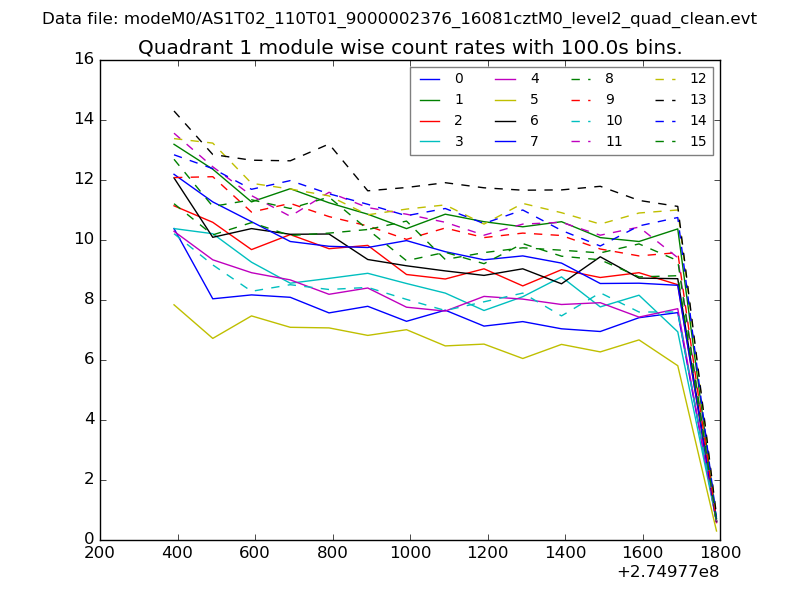 |
 |
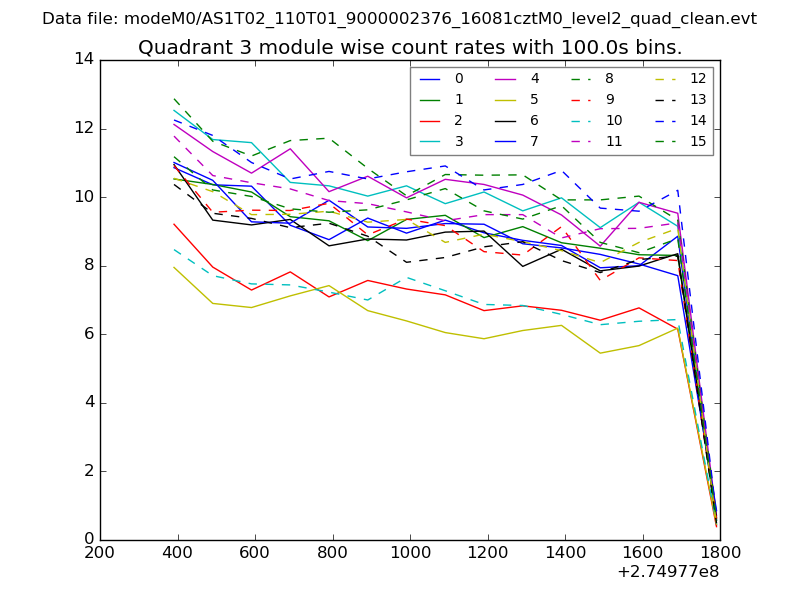
| Module-wise count rates for Quadrant C Data is divided into 100 sec bins |
 |
 |
| Module-wise count rates for Quadrant D Data is divided into 100 sec bins |
 |
 |
| Parameter | Plot |
|---|---|
| CZT HV Monitor |  |
| D_VDD | 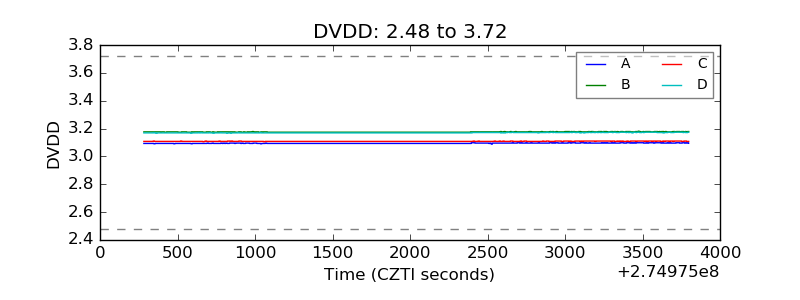 |
| Temperature 1 | 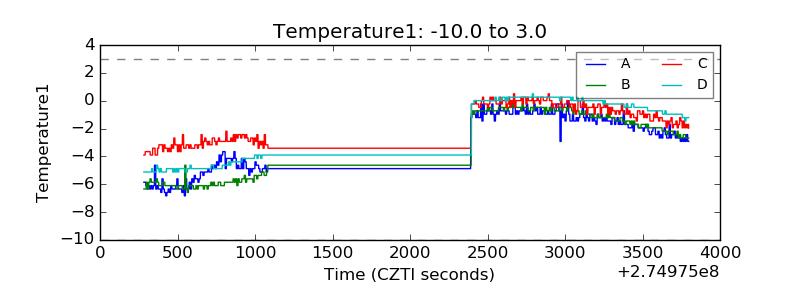 |
| Veto HV Monitor | 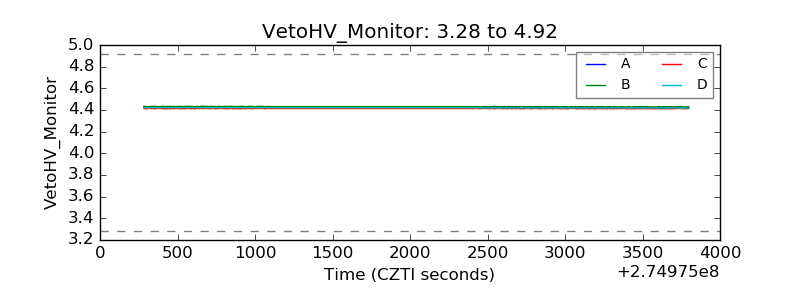 |
| Veto LLD | 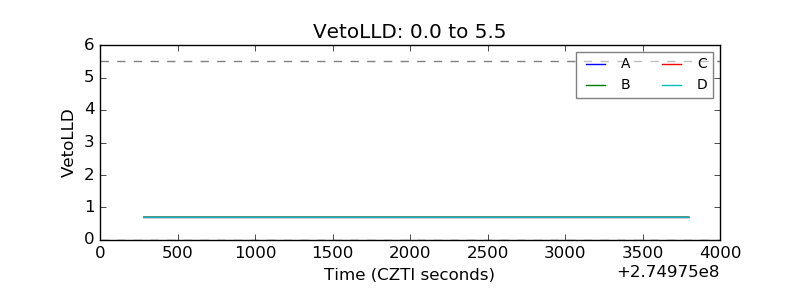 |
| Alpha Counter | 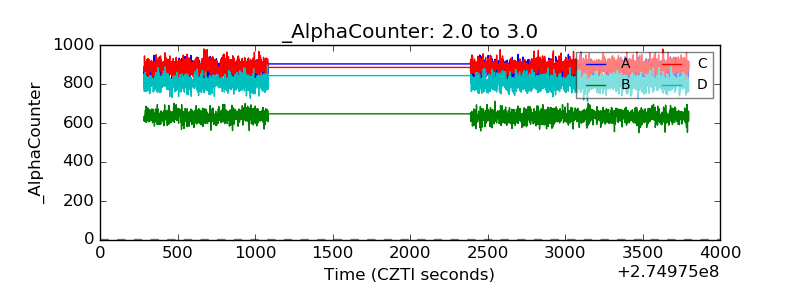 |
| _CPM_Rate | 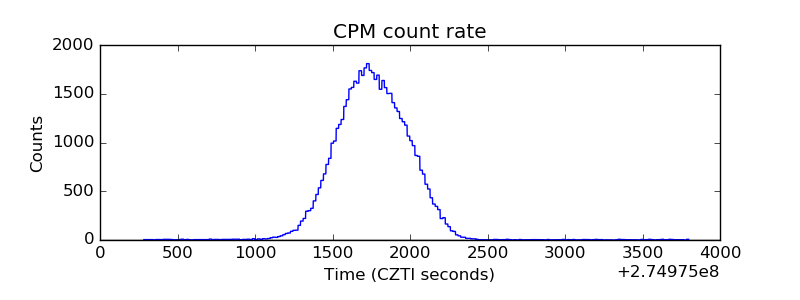 |
| CZT Counter | 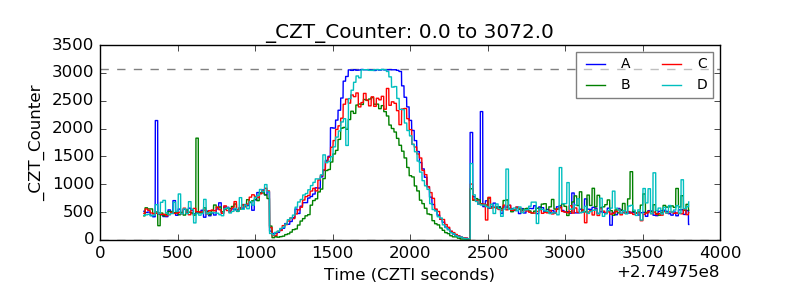 |
| +2.5 Volts monitor |  |
| +5 Volts monitor |  |
| _ROLL_ROT | 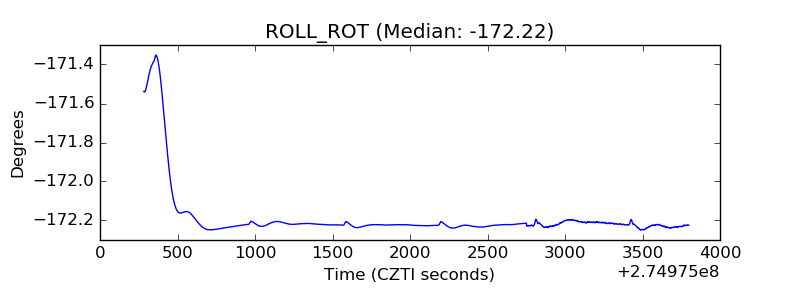 |
| _Roll_DEC | 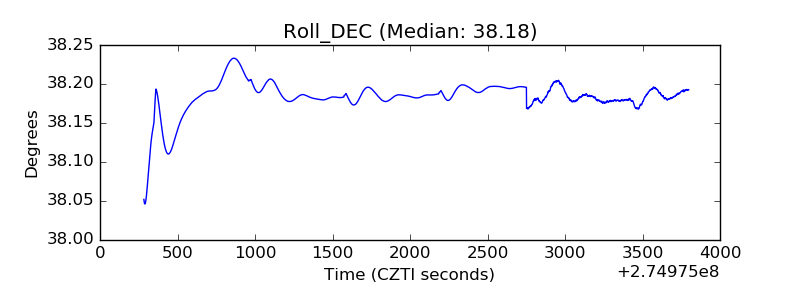 |
| _Roll_RA | 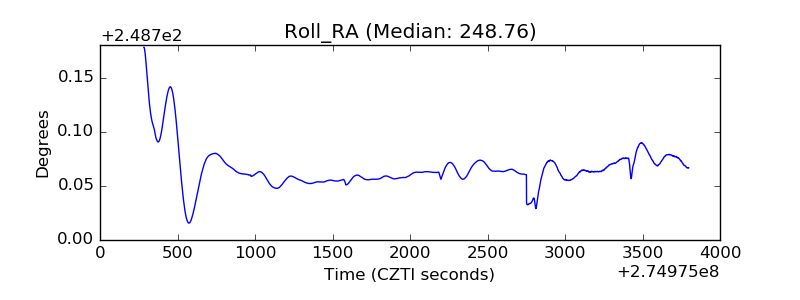 |
| Veto Counter | 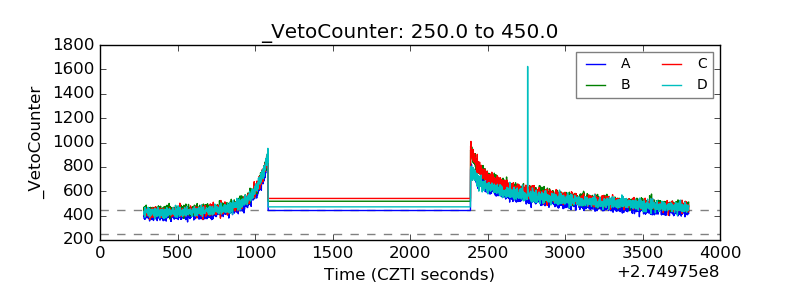 |