| Param | Original file | Final file |
|---|---|---|
| Filename | modeM0/AS1T02_110T01_9000002376_16082cztM0_level2.evt | modeM0/AS1T02_110T01_9000002376_16082cztM0_level2_quad_clean.evt |
| Size (bytes) | 434,678,400 | 86,397,120 |
| Size | 414.5 MB | 82.4 MB |
| Events in quadrant A | 3,063,159 | 564,618 |
| Events in quadrant B | 3,390,489 | 560,827 |
| Events in quadrant C | 3,005,853 | 532,751 |
| Events in quadrant D | 3,289,999 | 531,946 |
| Mode SS | |||
|---|---|---|---|
| Quadrant | BADHDUFLAG | Total packets | Discarded packets |
| A | 0 | 124 | 0 |
| B | 0 | 124 | 0 |
| C | 0 | 124 | 0 |
| D | 0 | 124 | 0 |
| Mode M9 | |||
|---|---|---|---|
| Quadrant | BADHDUFLAG | Total packets | Discarded packets |
| A | 0 | 12 | 0 |
| B | 0 | 12 | 0 |
| C | 0 | 12 | 0 |
| D | 0 | 12 | 0 |
| Mode M0 | |||
|---|---|---|---|
| Quadrant | BADHDUFLAG | Total packets | Discarded packets |
| A | 0 | 12945 | 2 |
| B | 0 | 14003 | 1 |
| C | 0 | 12710 | 1 |
| D | 0 | 13776 | 1 |
| Quadrant | Total seconds | Saturated seconds | Saturation percentage |
|---|---|---|---|
| A | 6104 | 100 | 1.638270% |
| B | 6104 | 96 | 1.572739% |
| C | 6104 | 86 | 1.408912% |
| D | 6104 | 84 | 1.376147% |
Noise dominated data is calculated using 1-second bins in cleaned event files. If a bin has >2000 counts, and if more than 50% of those come from <1% of pixels, then it is considered to be noise-dominated and hence unusable.
| Quadrant | # 1 sec bins | Bins with >0 counts | Bins with >2000 counts | High rate bins dominated by noise | Noise dominated (total time) | Noise dominated (detector-on time) | Marked lightcurve |
|---|---|---|---|---|---|---|---|
| A | 7345 | 6105 | 20 | 20 | 0.27% | 0.33% | 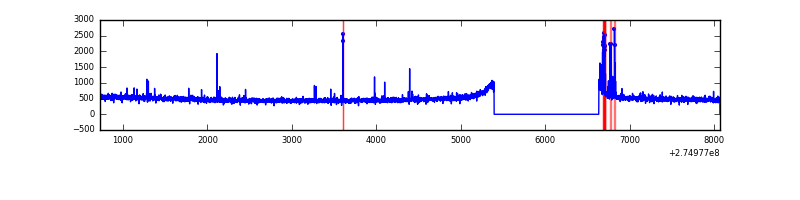 |
| B | 7345 | 6105 | 9 | 9 | 0.12% | 0.15% | 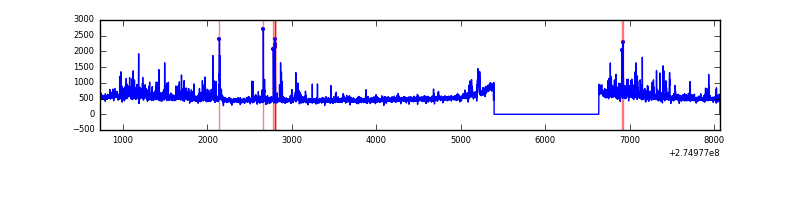 |
| C | 7345 | 6105 | 0 | 0 | 0.00% | 0.00% | 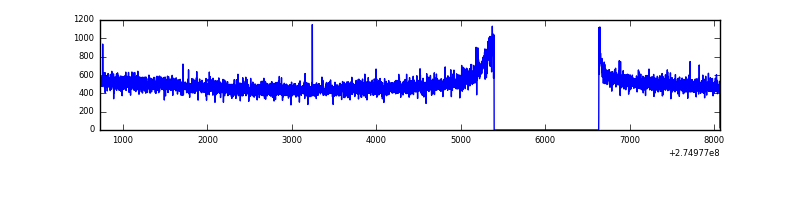 |
| D | 7345 | 6105 | 30 | 30 | 0.41% | 0.49% | 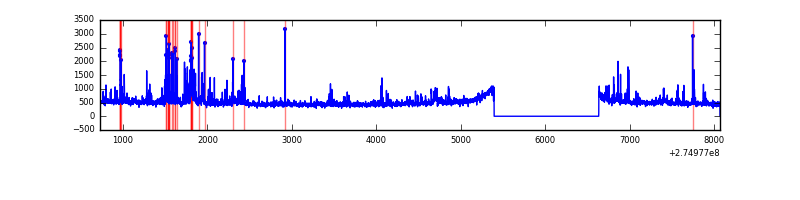 |
Top three noisy pixels from each quadrant. If the there are fewer than three noisy pixels in the level2.evt file, extra rows are filled as -1
| Pixel properties | Quadrant properties | ||||||
|---|---|---|---|---|---|---|---|
| Quadrant | DetID | PixID | Counts | Sigma | Mean | Median | Sigma |
| A | 9 | 143 | 89073 | 573.62 | 763 | 747 | 154.0 |
| A | 3 | 80 | 16476 | 102.15 | 763 | 747 | 154.0 |
| A | 15 | 239 | 11304 | 68.56 | 763 | 747 | 154.0 |
| B | 7 | 220 | 186523 | 1297.74 | 762 | 746 | 143.2 |
| B | 0 | 189 | 109625 | 760.57 | 762 | 746 | 143.2 |
| B | 0 | 190 | 48244 | 331.8 | 762 | 746 | 143.2 |
| C | 14 | 238 | 112100 | 657.09 | 730 | 736 | 169.5 |
| C | 3 | 233 | 27908 | 160.33 | 730 | 736 | 169.5 |
| C | 10 | 22 | 6705 | 35.22 | 730 | 736 | 169.5 |
| D | 5 | 222 | 327783 | 1818.68 | 746 | 727 | 179.8 |
| D | 12 | 218 | 26351 | 142.49 | 746 | 727 | 179.8 |
| D | 2 | 234 | 24313 | 131.16 | 746 | 727 | 179.8 |
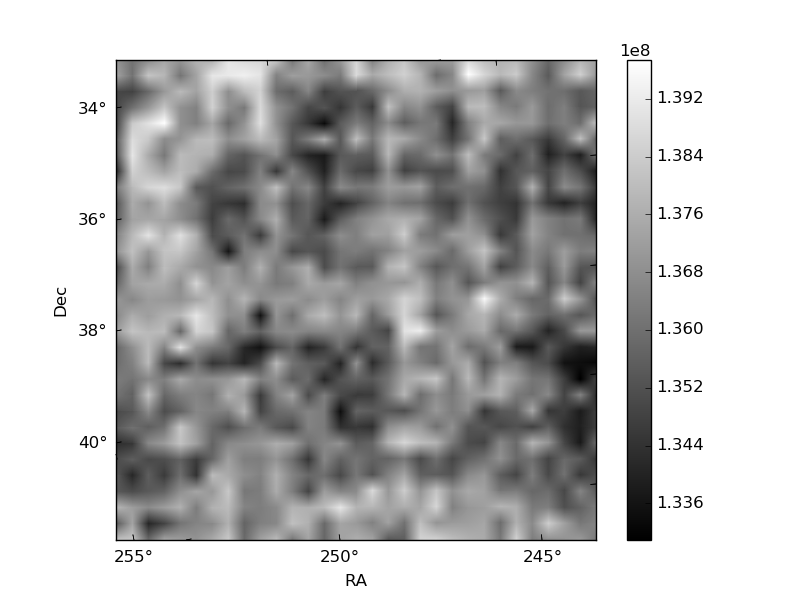
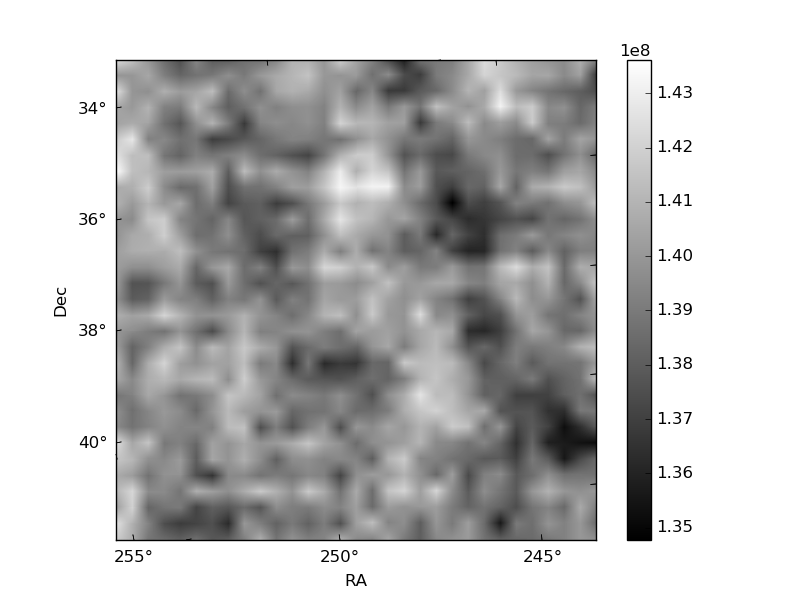
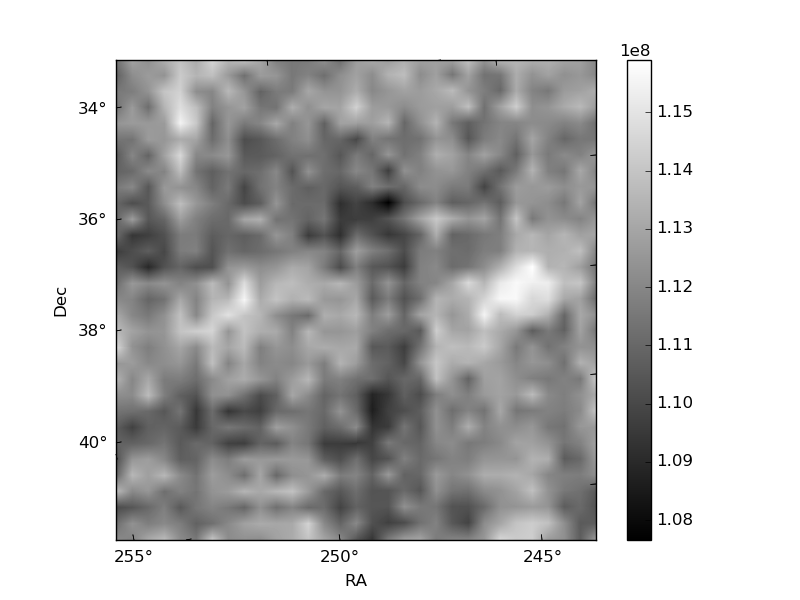
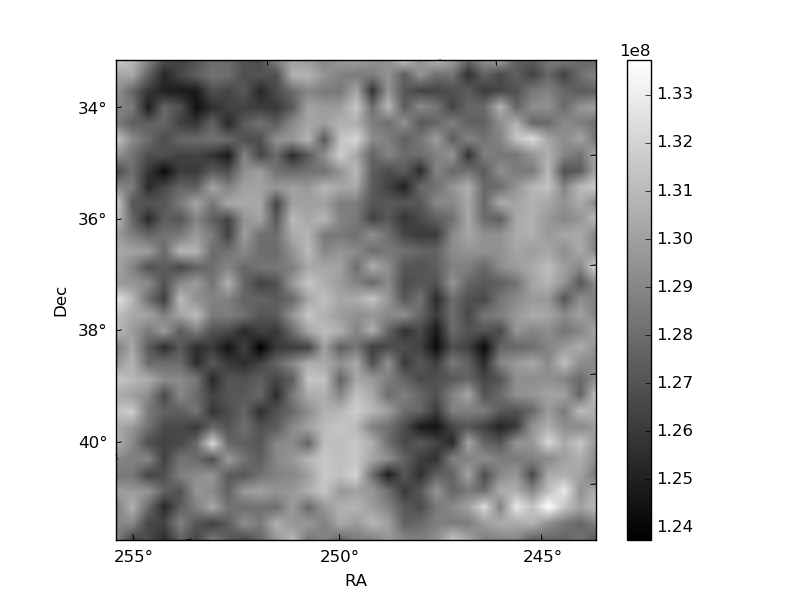
Histogram calculated using DETX and DETY for each event in the final _common_clean file
| Quadrant A | 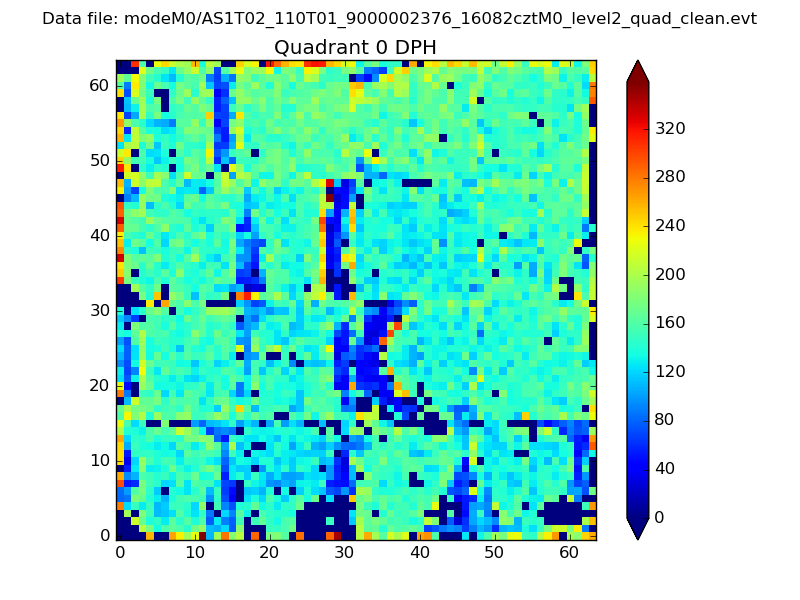 |
 |
Quadrant B |
|---|---|---|---|
| Quadrant D | 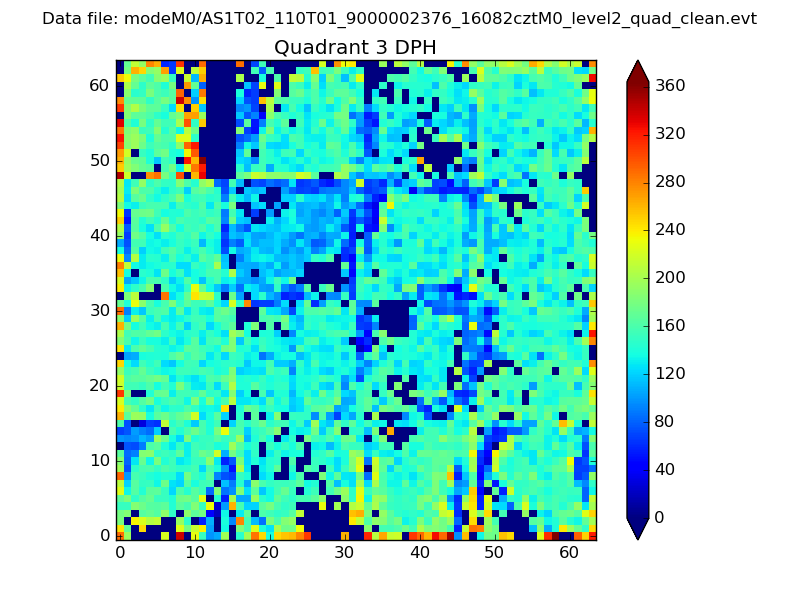 |
 |
Quadrant C |
| Plot type | Count rate plots | Images |
|---|---|---|
| Comparison with Poisson distribution Blue bars denote a histogram of data divided into 1 sec bins. Red curve is a Poisson curve with rate = median count rate of data. |
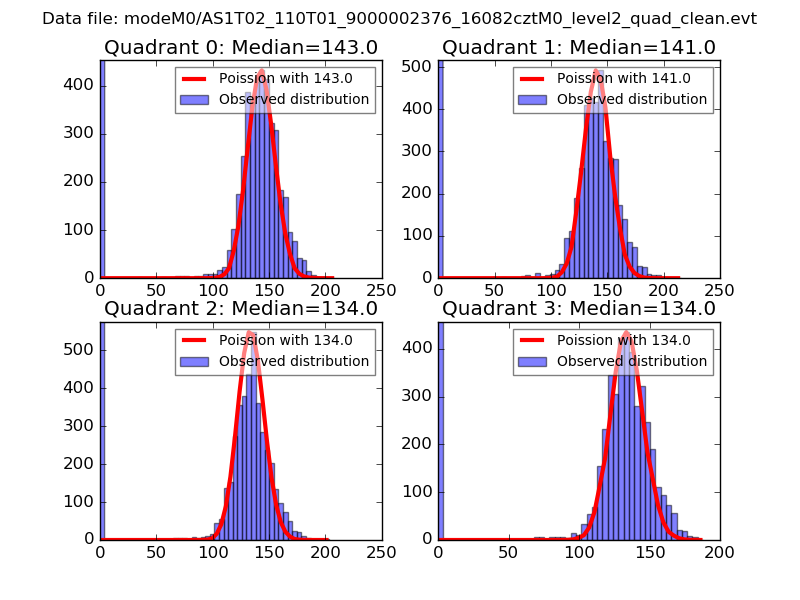 |
 |
| Quadrant-wise count rates Data is divided into 100 sec bins |
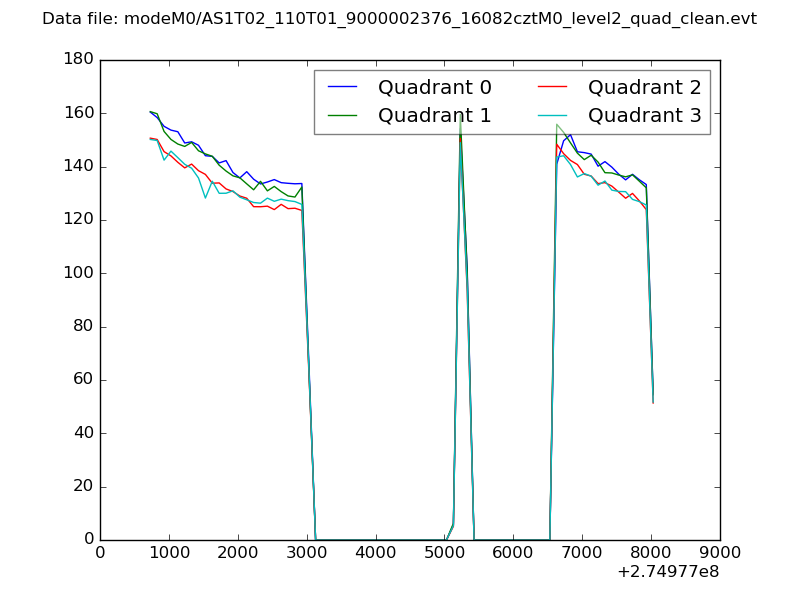 |
|
| Module-wise count rates for Quadrant A Data is divided into 100 sec bins |
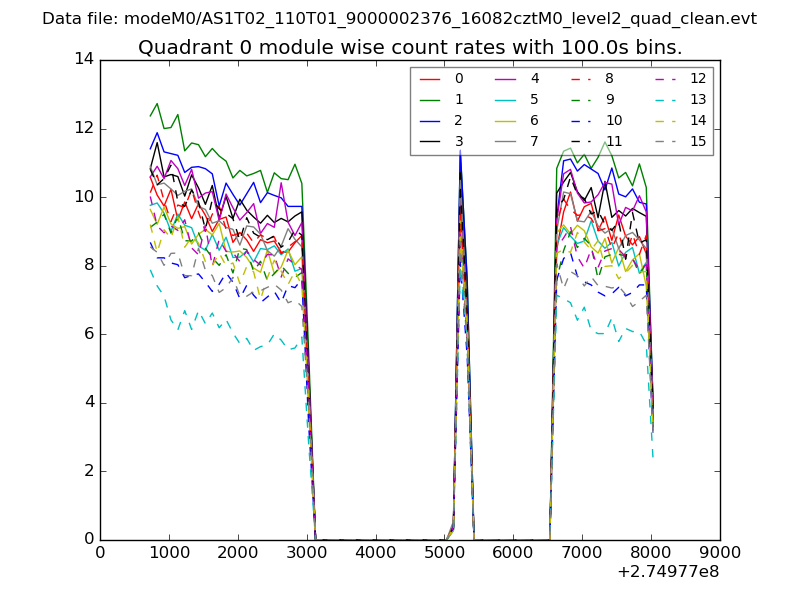 |
 |
| Module-wise count rates for Quadrant B Data is divided into 100 sec bins |
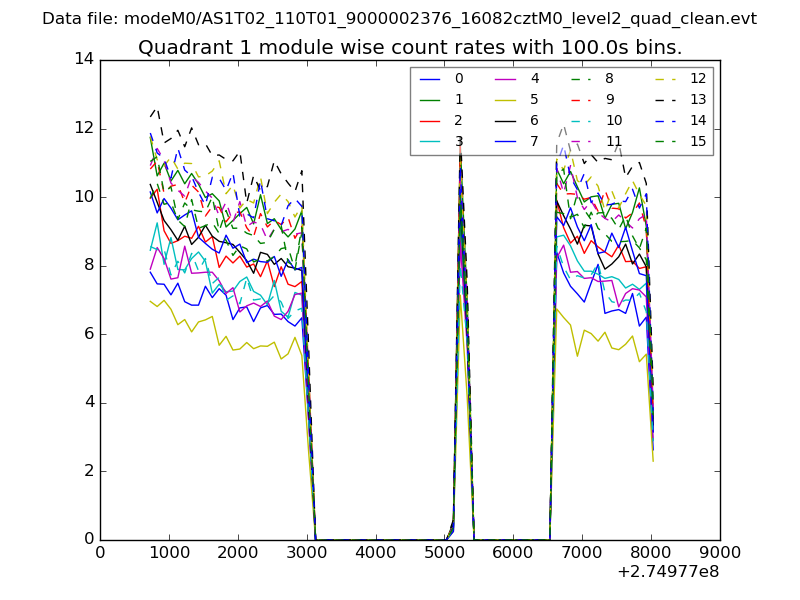 |
 |
| Module-wise count rates for Quadrant C Data is divided into 100 sec bins |
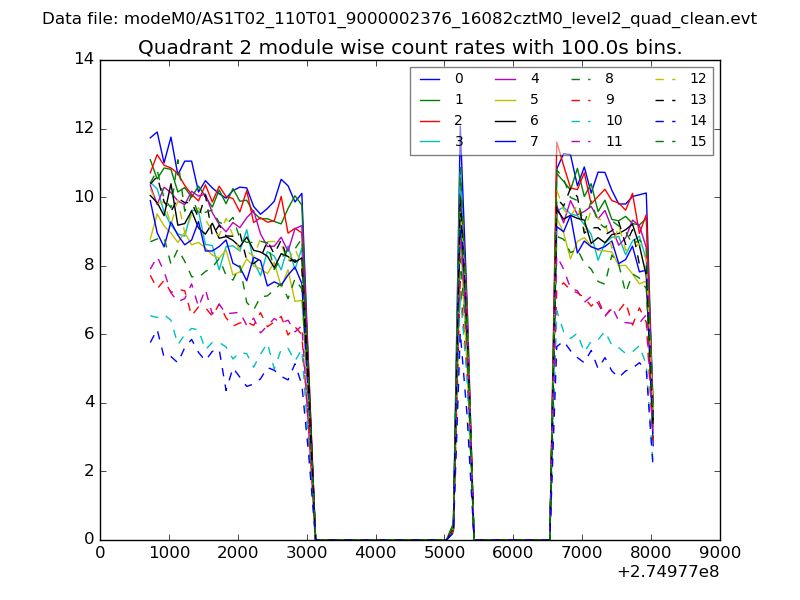 |
 |
| Module-wise count rates for Quadrant D Data is divided into 100 sec bins |
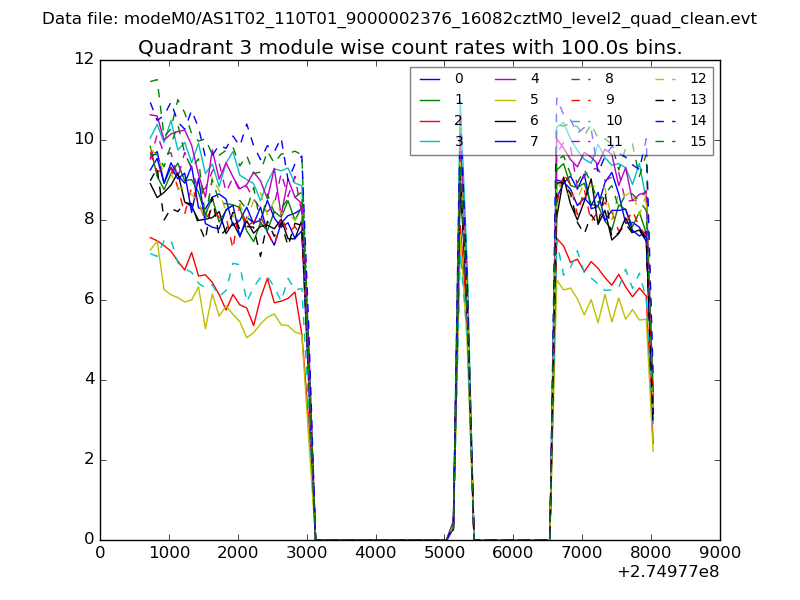 |
 |
| Parameter | Plot |
|---|---|
| CZT HV Monitor | 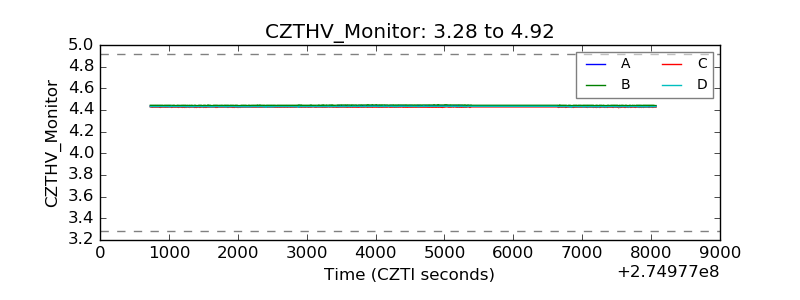 |
| D_VDD | 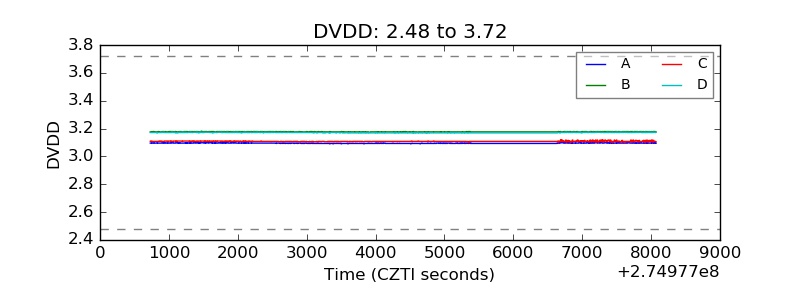 |
| Temperature 1 | 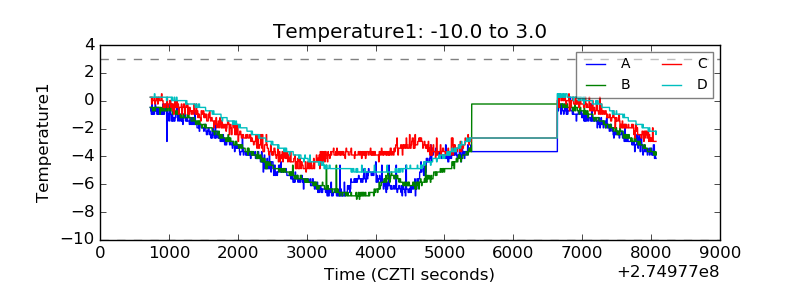 |
| Veto HV Monitor | 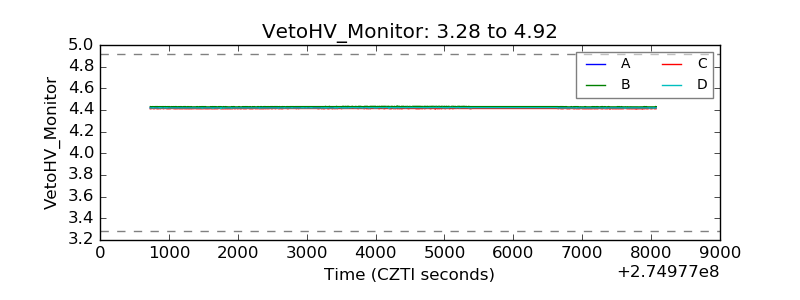 |
| Veto LLD | 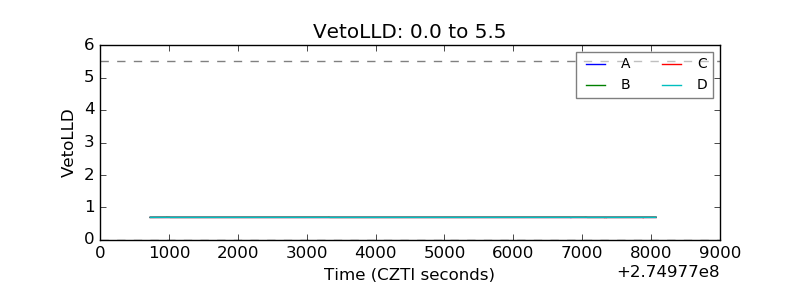 |
| Alpha Counter | 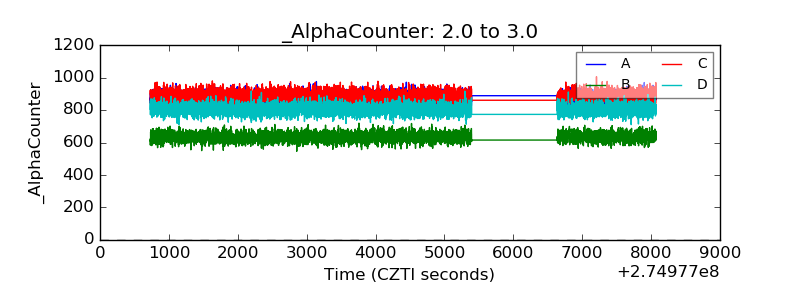 |
| _CPM_Rate | 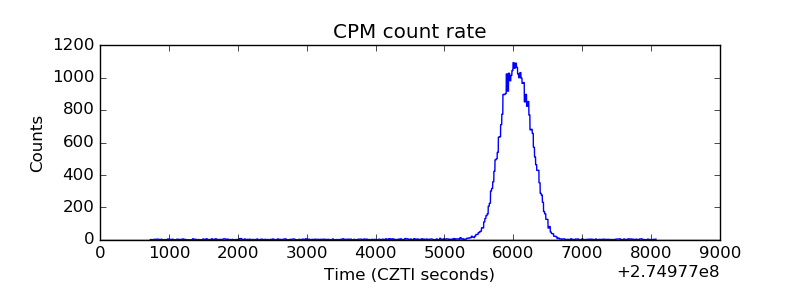 |
| CZT Counter | 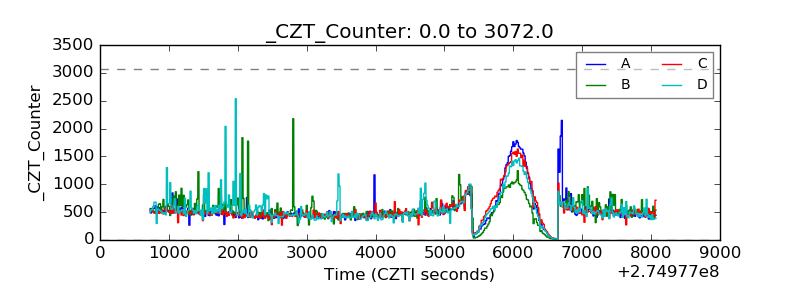 |
| +2.5 Volts monitor |  |
| +5 Volts monitor |  |
| _ROLL_ROT | 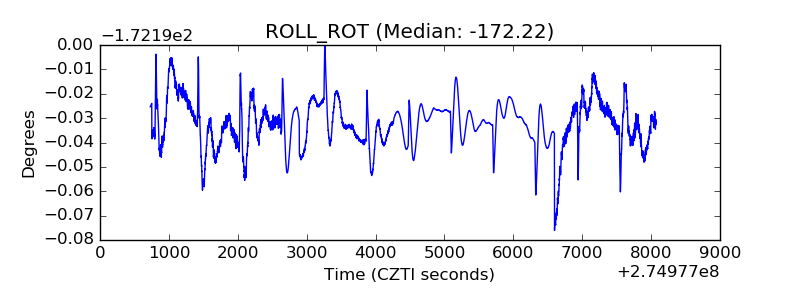 |
| _Roll_DEC | 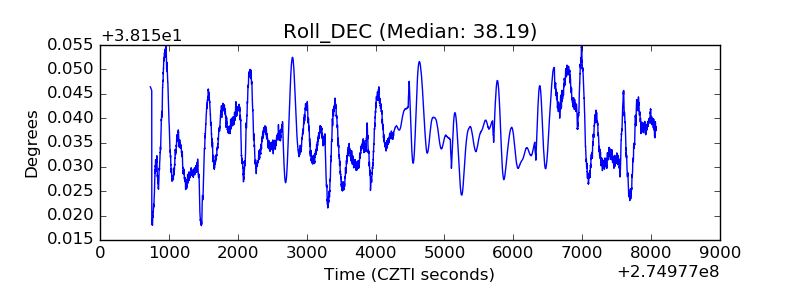 |
| _Roll_RA | 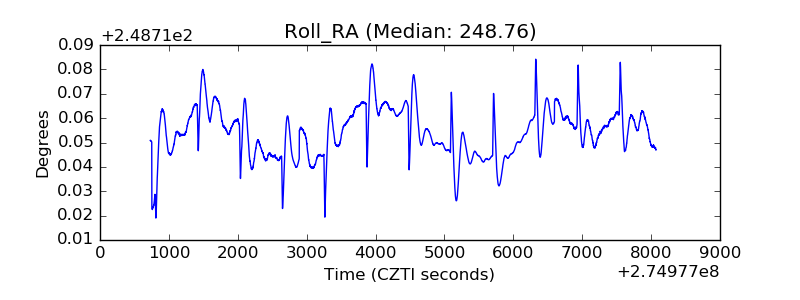 |
| Veto Counter | 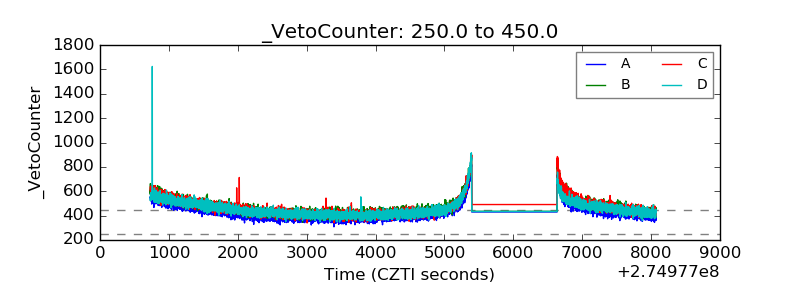 |