| Param | Original file | Final file |
|---|---|---|
| Filename | modeM0/AS1T02_110T01_9000002376_16083cztM0_level2.evt | modeM0/AS1T02_110T01_9000002376_16083cztM0_level2_quad_clean.evt |
| Size (bytes) | 441,460,800 | 90,020,160 |
| Size | 421.0 MB | 85.8 MB |
| Events in quadrant A | 3,206,160 | 581,857 |
| Events in quadrant B | 3,542,309 | 581,725 |
| Events in quadrant C | 3,107,640 | 556,573 |
| Events in quadrant D | 3,076,622 | 557,440 |
| Mode SS | |||
|---|---|---|---|
| Quadrant | BADHDUFLAG | Total packets | Discarded packets |
| A | 0 | 130 | 0 |
| B | 0 | 130 | 0 |
| C | 0 | 130 | 0 |
| D | 0 | 130 | 0 |
| Mode M9 | |||
|---|---|---|---|
| Quadrant | BADHDUFLAG | Total packets | Discarded packets |
| A | 0 | 12 | 0 |
| B | 0 | 12 | 0 |
| C | 0 | 12 | 0 |
| D | 0 | 13 | 0 |
| Mode M0 | |||
|---|---|---|---|
| Quadrant | BADHDUFLAG | Total packets | Discarded packets |
| A | 0 | 13759 | 3 |
| B | 0 | 14729 | 2 |
| C | 0 | 13295 | 2 |
| D | 0 | 13612 | 2 |
| Quadrant | Total seconds | Saturated seconds | Saturation percentage |
|---|---|---|---|
| A | 6431 | 74 | 1.150676% |
| B | 6431 | 77 | 1.197325% |
| C | 6431 | 62 | 0.964080% |
| D | 6431 | 24 | 0.373192% |
Noise dominated data is calculated using 1-second bins in cleaned event files. If a bin has >2000 counts, and if more than 50% of those come from <1% of pixels, then it is considered to be noise-dominated and hence unusable.
| Quadrant | # 1 sec bins | Bins with >0 counts | Bins with >2000 counts | High rate bins dominated by noise | Noise dominated (total time) | Noise dominated (detector-on time) | Marked lightcurve |
|---|---|---|---|---|---|---|---|
| A | 7502 | 6432 | 24 | 24 | 0.32% | 0.37% | 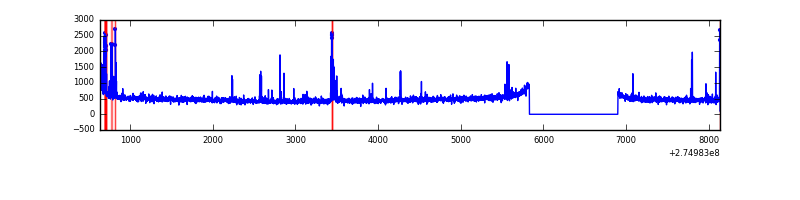 |
| B | 7502 | 6432 | 20 | 20 | 0.27% | 0.31% | 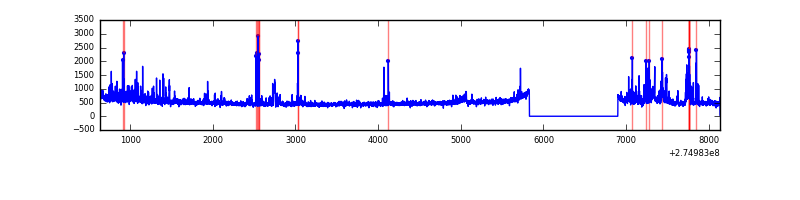 |
| C | 7502 | 6432 | 0 | 0 | 0.00% | 0.00% | 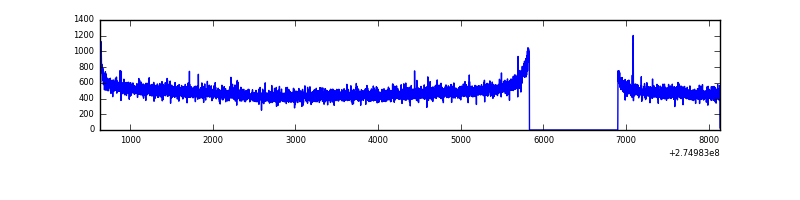 |
| D | 7502 | 6433 | 5 | 5 | 0.07% | 0.08% | 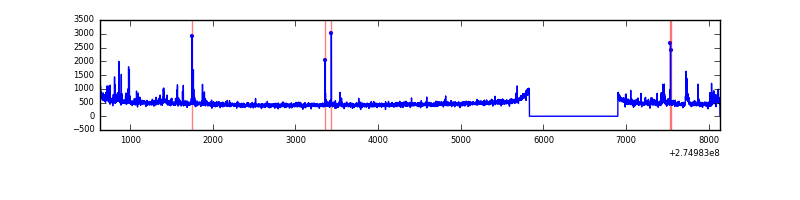 |
Top three noisy pixels from each quadrant. If the there are fewer than three noisy pixels in the level2.evt file, extra rows are filled as -1
| Pixel properties | Quadrant properties | ||||||
|---|---|---|---|---|---|---|---|
| Quadrant | DetID | PixID | Counts | Sigma | Mean | Median | Sigma |
| A | 15 | 239 | 94183 | 584.78 | 780 | 761 | 159.8 |
| A | 9 | 143 | 89756 | 557.07 | 780 | 761 | 159.8 |
| A | 12 | 96 | 16190 | 96.58 | 780 | 761 | 159.8 |
| B | 7 | 220 | 166990 | 1125.95 | 783 | 764 | 147.6 |
| B | 0 | 189 | 87409 | 586.9 | 783 | 764 | 147.6 |
| B | 0 | 190 | 75217 | 504.31 | 783 | 764 | 147.6 |
| C | 14 | 238 | 114976 | 653.69 | 753 | 759 | 174.7 |
| C | 3 | 233 | 28411 | 158.26 | 753 | 759 | 174.7 |
| C | 0 | 207 | 11024 | 58.75 | 753 | 759 | 174.7 |
| D | 5 | 222 | 53801 | 283.55 | 768 | 744 | 187.1 |
| D | 7 | 38 | 36673 | 192.01 | 768 | 744 | 187.1 |
| D | 2 | 234 | 25096 | 130.14 | 768 | 744 | 187.1 |
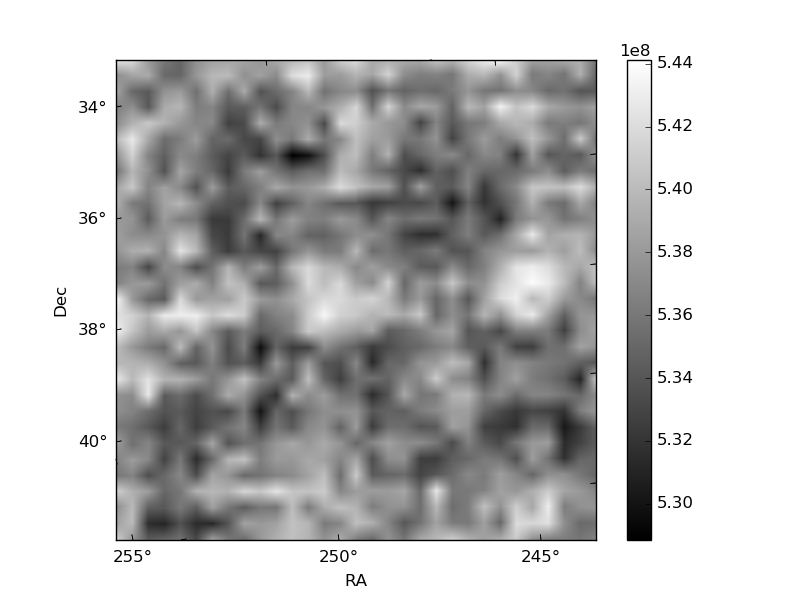
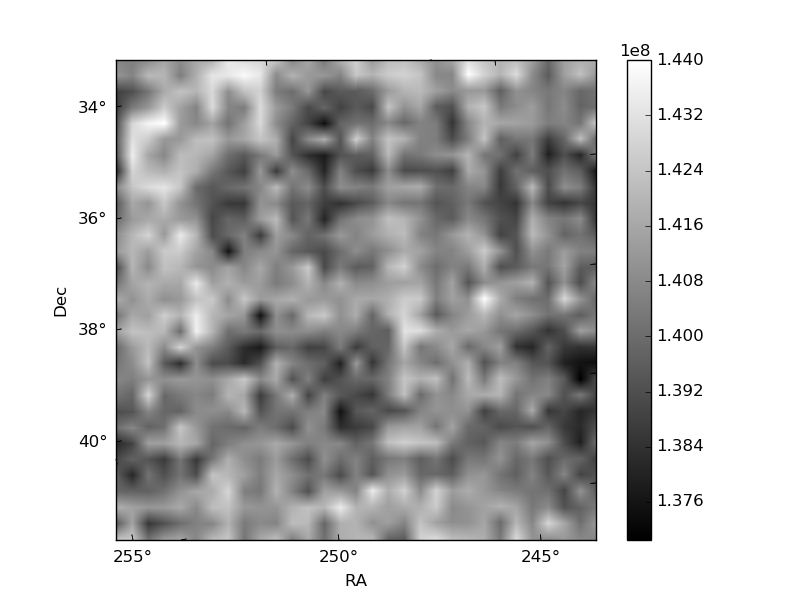
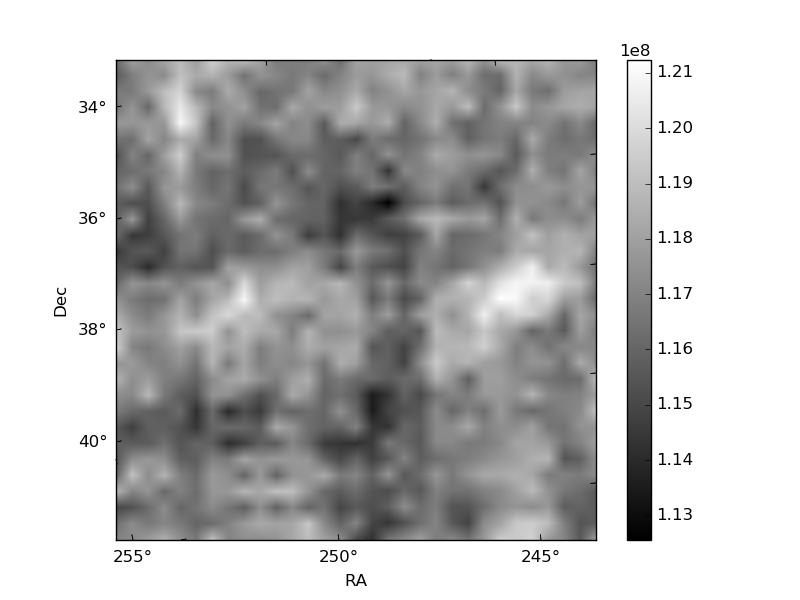
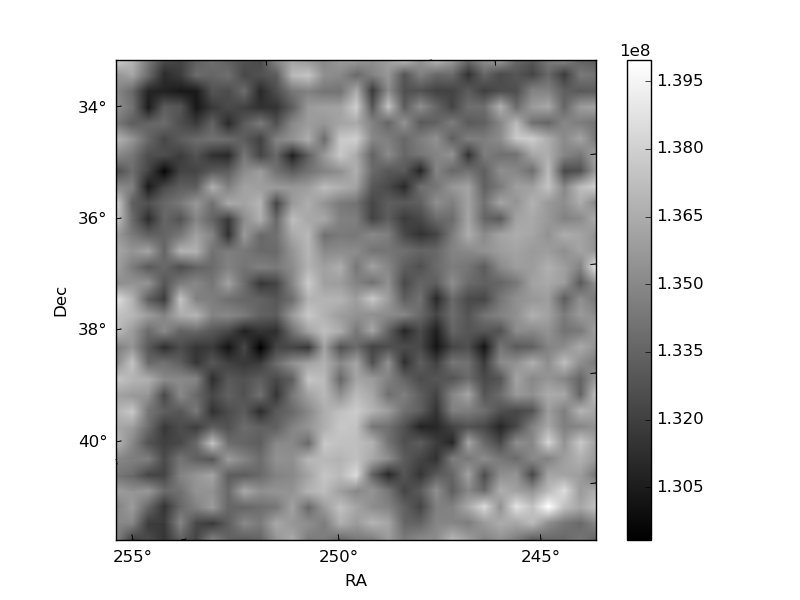
Histogram calculated using DETX and DETY for each event in the final _common_clean file
| Quadrant A | 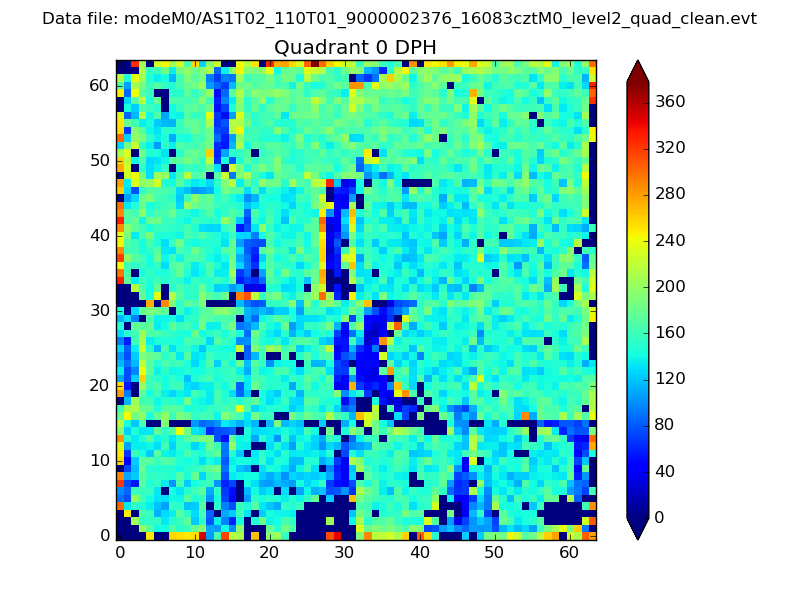 |
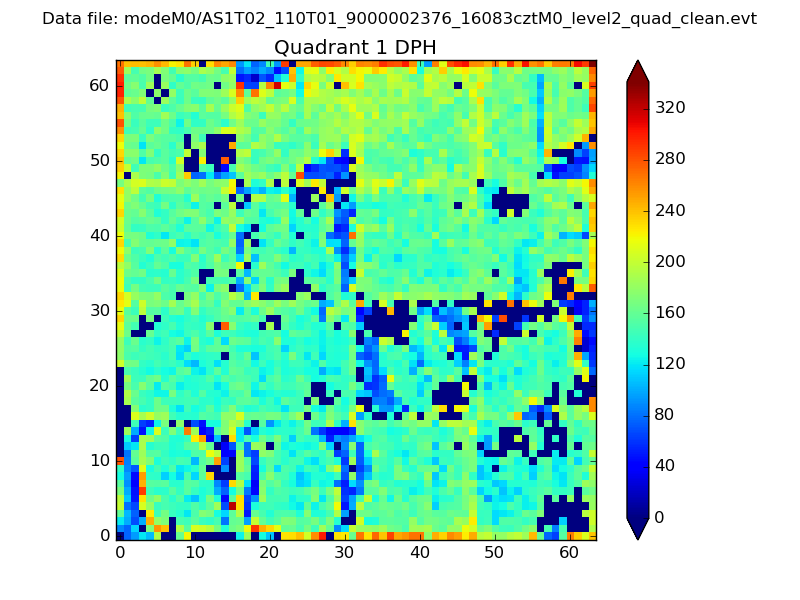 |
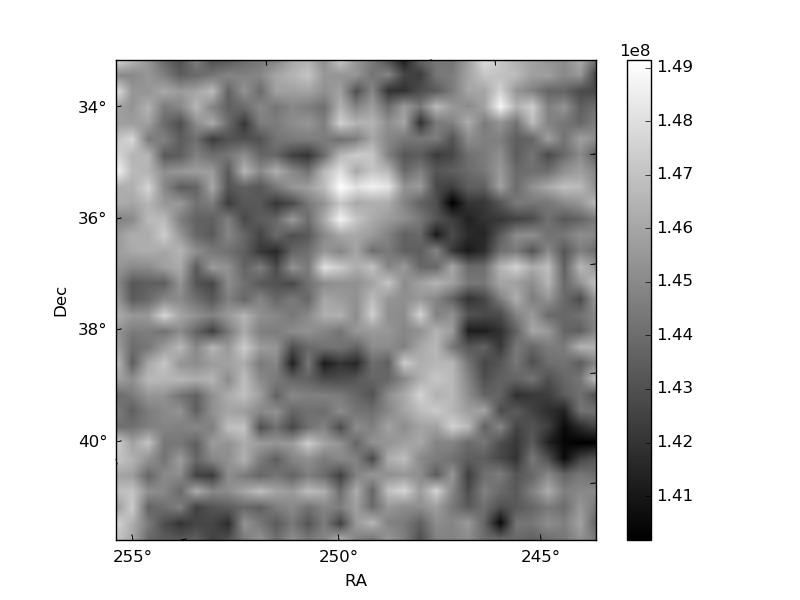
Quadrant B |
|---|---|---|---|
| Quadrant D | 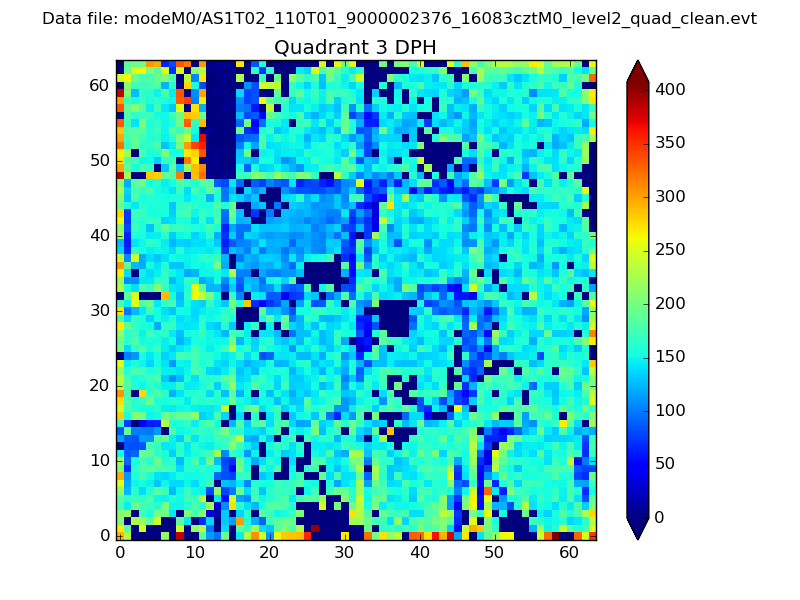 |
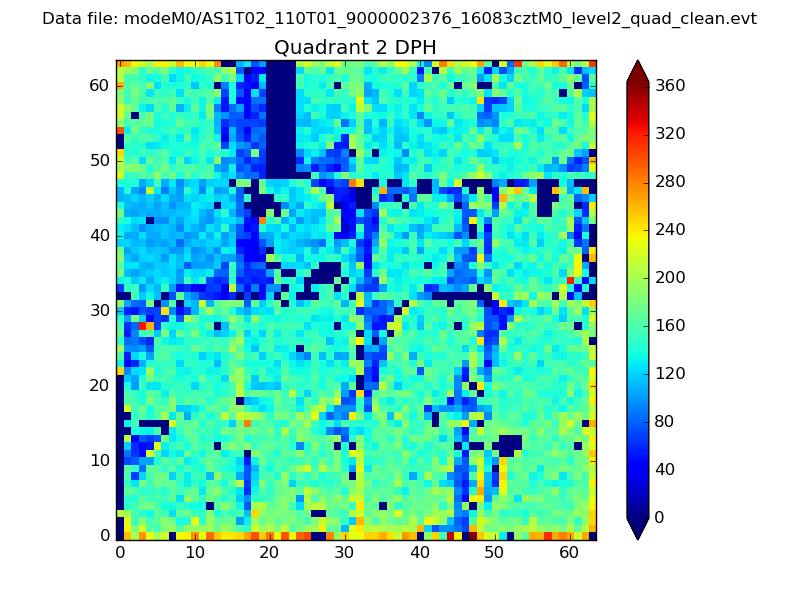 |
Quadrant C |
| Plot type | Count rate plots | Images |
|---|---|---|
| Comparison with Poisson distribution Blue bars denote a histogram of data divided into 1 sec bins. Red curve is a Poisson curve with rate = median count rate of data. |
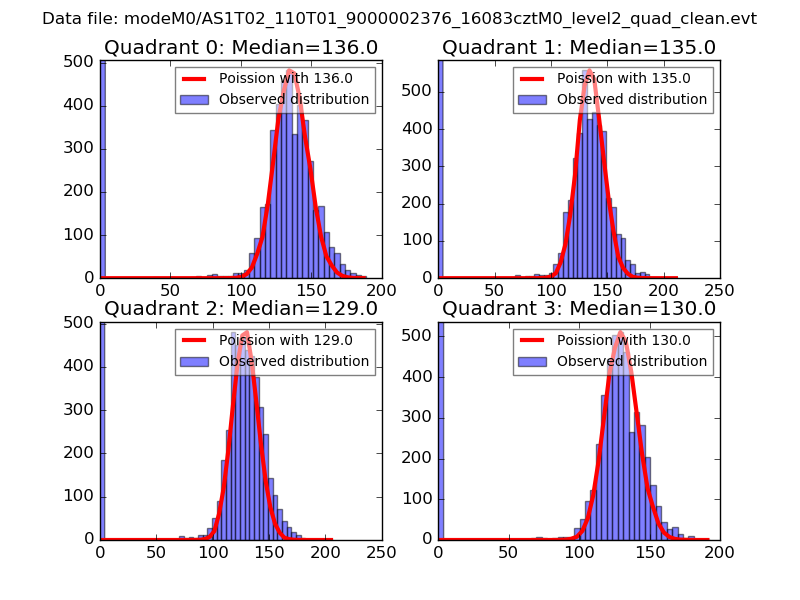 |
 |
| Quadrant-wise count rates Data is divided into 100 sec bins |
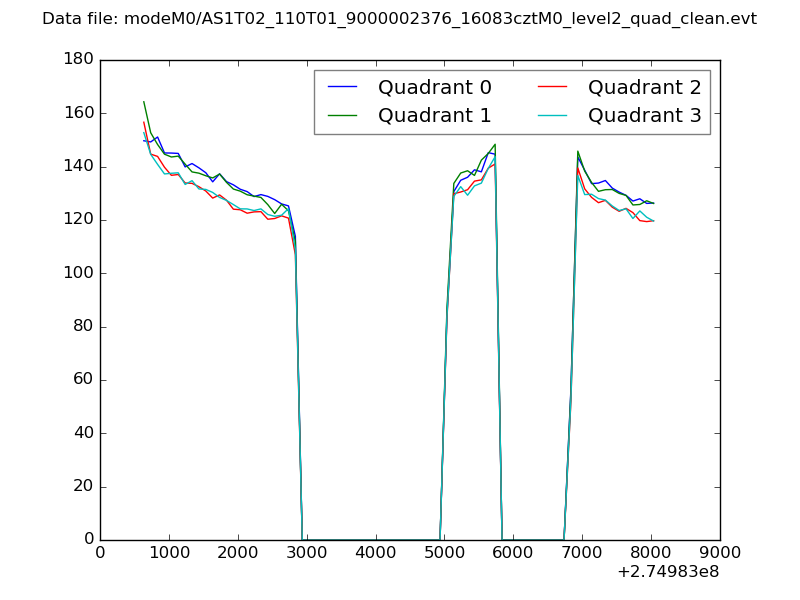 |
|
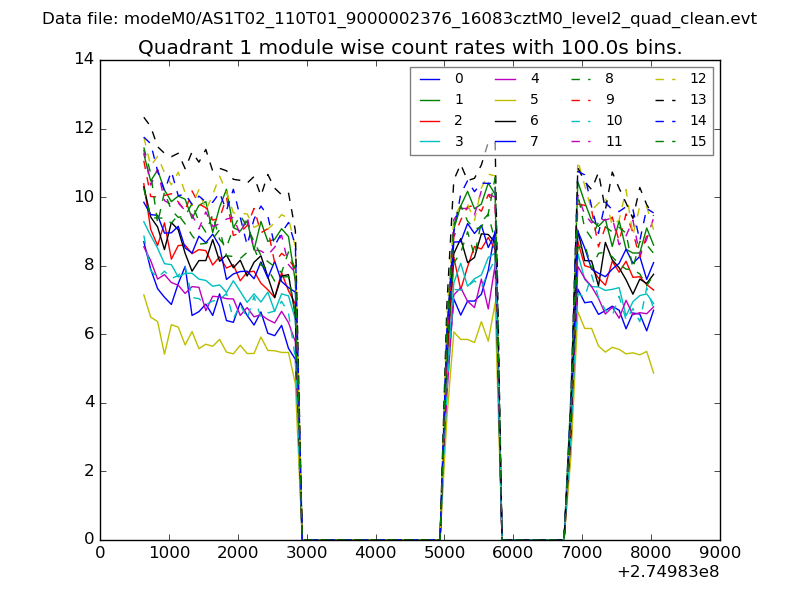
| Module-wise count rates for Quadrant A Data is divided into 100 sec bins |
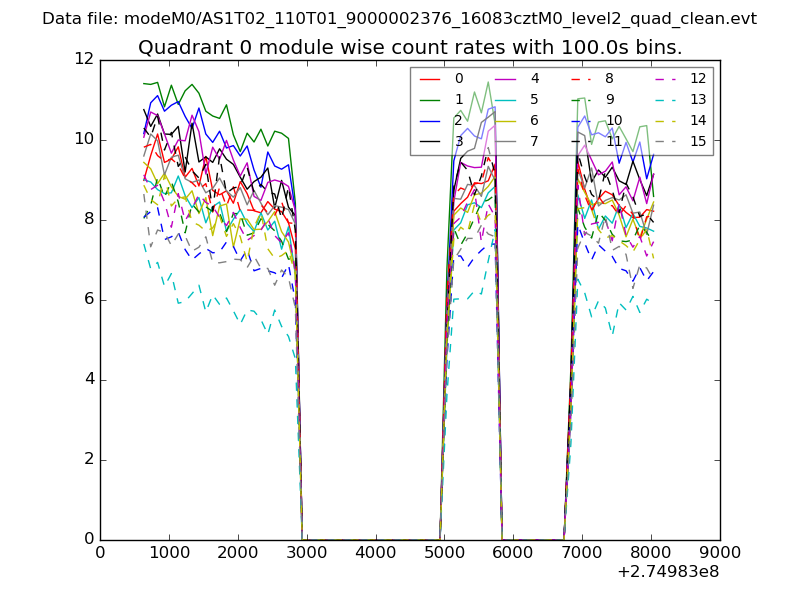 |
 |
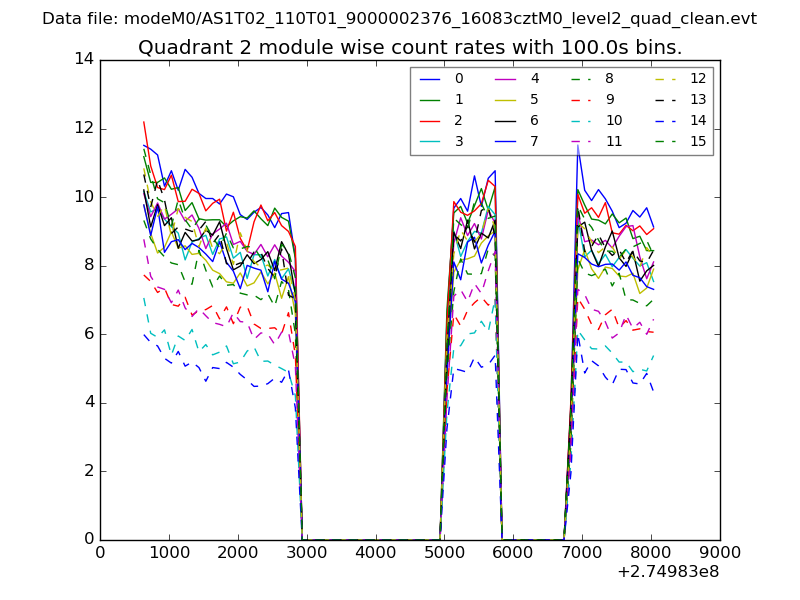
| Module-wise count rates for Quadrant B Data is divided into 100 sec bins |
 |
 |
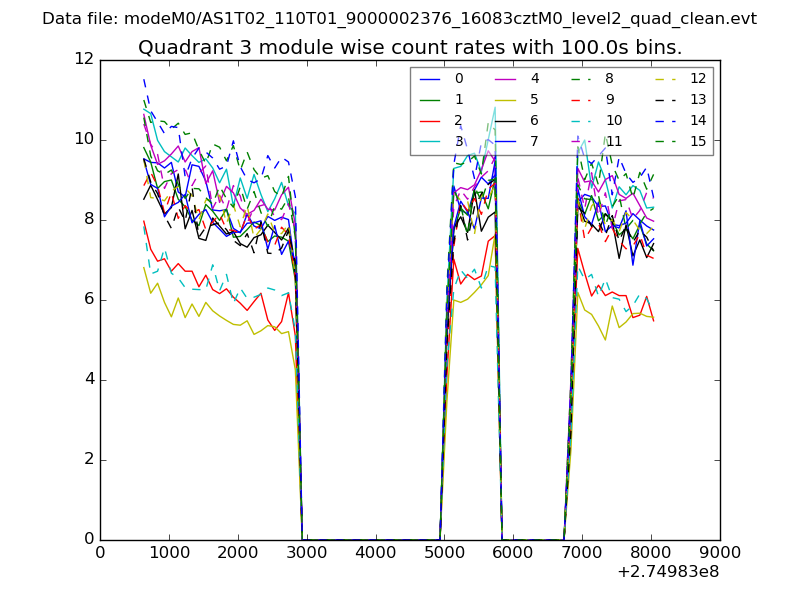
| Module-wise count rates for Quadrant C Data is divided into 100 sec bins |
 |
 |
| Module-wise count rates for Quadrant D Data is divided into 100 sec bins |
 |
 |
| Parameter | Plot |
|---|---|
| CZT HV Monitor | 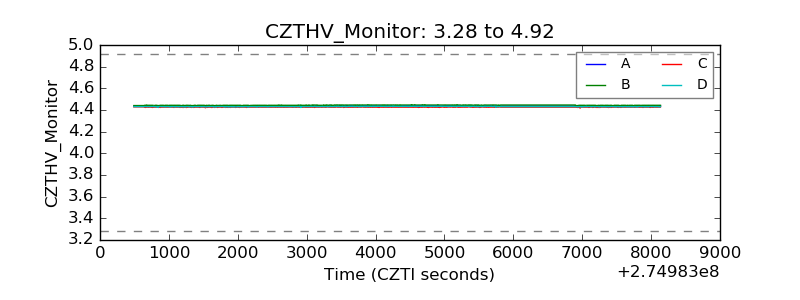 |
| D_VDD | 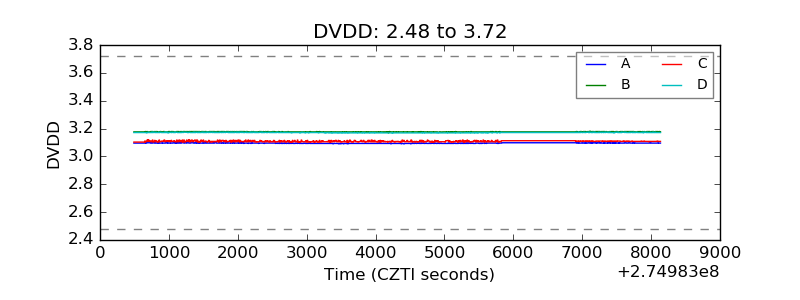 |
| Temperature 1 | 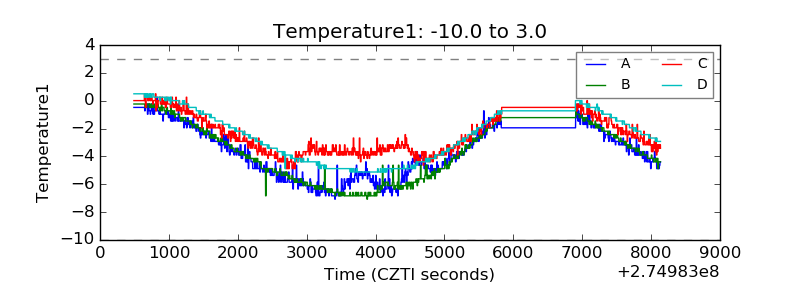 |
| Veto HV Monitor | 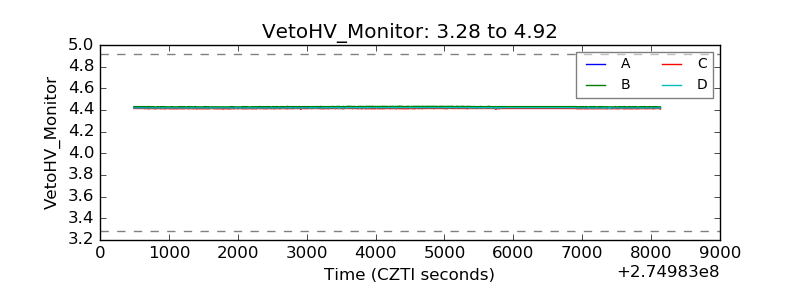 |
| Veto LLD | 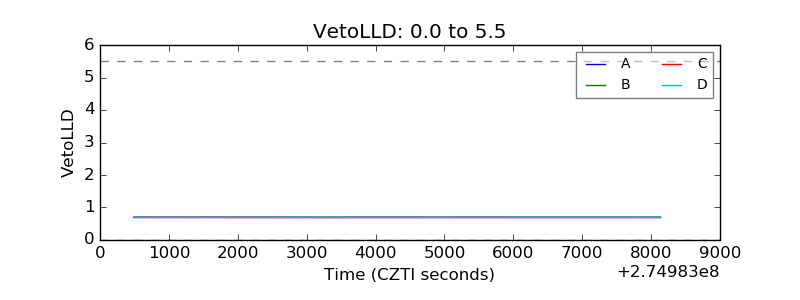 |
| Alpha Counter | 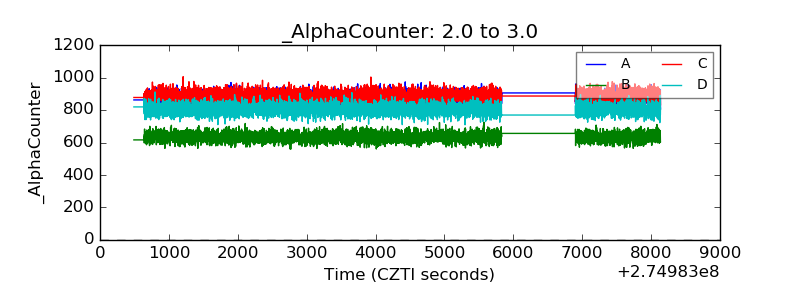 |
| _CPM_Rate | 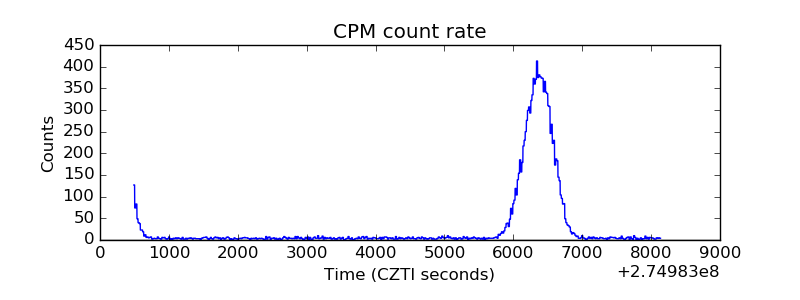 |
| CZT Counter | 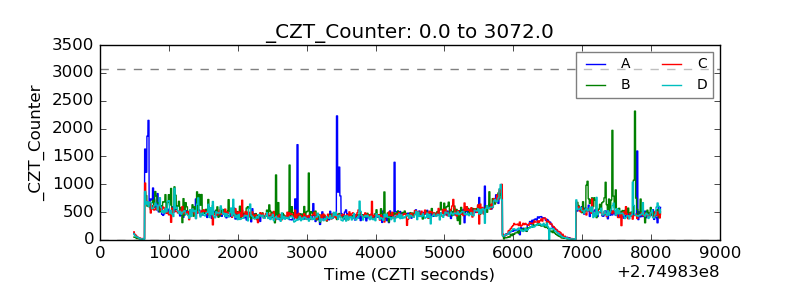 |
| +2.5 Volts monitor | 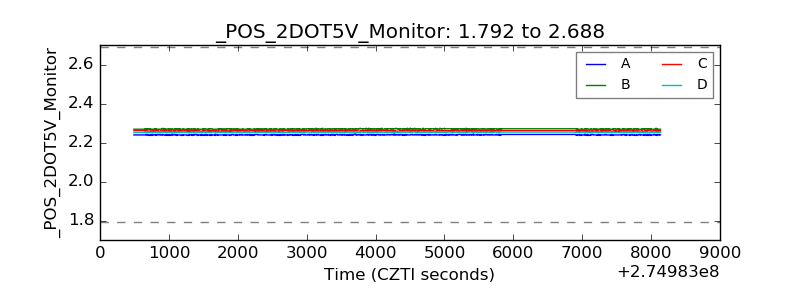 |
| +5 Volts monitor |  |
| _ROLL_ROT | 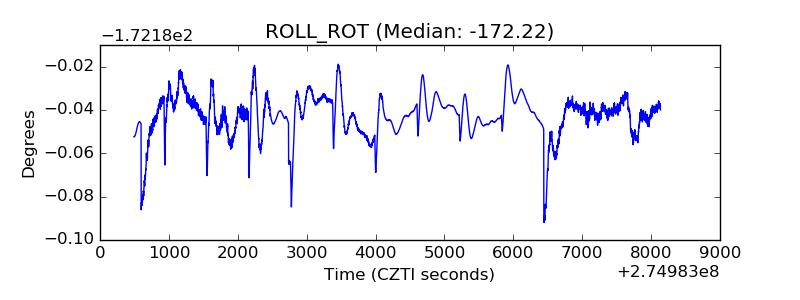 |
| _Roll_DEC | 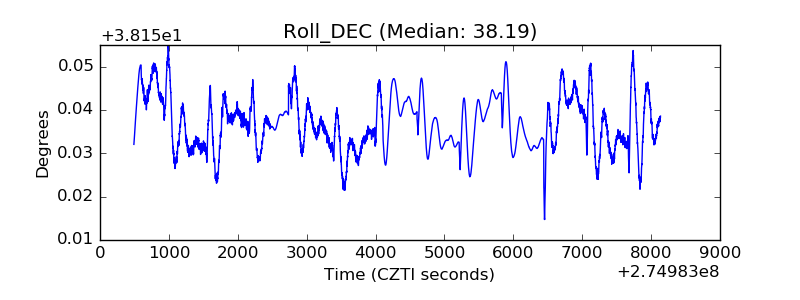 |
| _Roll_RA | 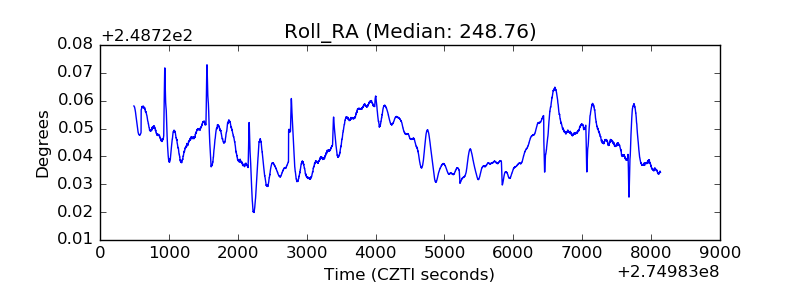 |
| Veto Counter | 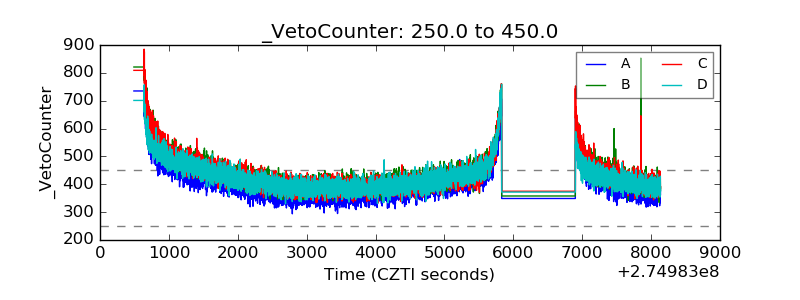 |