| Param | Original file | Final file |
|---|---|---|
| Filename | modeM0/AS1T02_110T01_9000002376_16085cztM0_level2.evt | modeM0/AS1T02_110T01_9000002376_16085cztM0_level2_quad_clean.evt |
| Size (bytes) | 529,752,960 | 96,137,280 |
| Size | 505.2 MB | 91.7 MB |
| Events in quadrant A | 3,727,363 | 613,090 |
| Events in quadrant B | 3,734,956 | 619,040 |
| Events in quadrant C | 3,426,242 | 594,154 |
| Events in quadrant D | 4,661,996 | 579,489 |
| Mode SS | |||
|---|---|---|---|
| Quadrant | BADHDUFLAG | Total packets | Discarded packets |
| A | 0 | 146 | 0 |
| B | 0 | 146 | 0 |
| C | 0 | 146 | 0 |
| D | 0 | 146 | 0 |
| Mode M9 | |||
|---|---|---|---|
| Quadrant | BADHDUFLAG | Total packets | Discarded packets |
| A | 0 | 9 | 0 |
| B | 0 | 9 | 0 |
| C | 0 | 9 | 0 |
| D | 0 | 10 | 0 |
| Mode M0 | |||
|---|---|---|---|
| Quadrant | BADHDUFLAG | Total packets | Discarded packets |
| A | 0 | 16114 | 3 |
| B | 0 | 15957 | 2 |
| C | 0 | 15005 | 2 |
| D | 0 | 18963 | 2 |
| Quadrant | Total seconds | Saturated seconds | Saturation percentage |
|---|---|---|---|
| A | 7264 | 166 | 2.285242% |
| B | 7264 | 75 | 1.032489% |
| C | 7264 | 81 | 1.115088% |
| D | 7264 | 414 | 5.699339% |
Noise dominated data is calculated using 1-second bins in cleaned event files. If a bin has >2000 counts, and if more than 50% of those come from <1% of pixels, then it is considered to be noise-dominated and hence unusable.
| Quadrant | # 1 sec bins | Bins with >0 counts | Bins with >2000 counts | High rate bins dominated by noise | Noise dominated (total time) | Noise dominated (detector-on time) | Marked lightcurve |
|---|---|---|---|---|---|---|---|
| A | 7640 | 7266 | 96 | 96 | 1.26% | 1.32% | 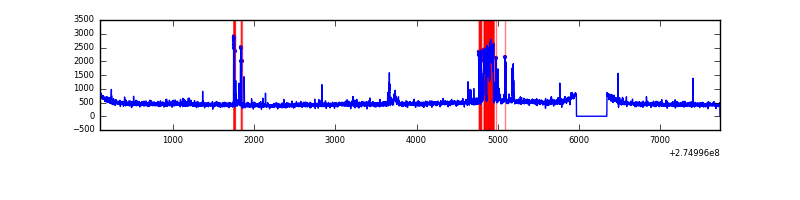 |
| B | 7640 | 7266 | 8 | 8 | 0.10% | 0.11% | 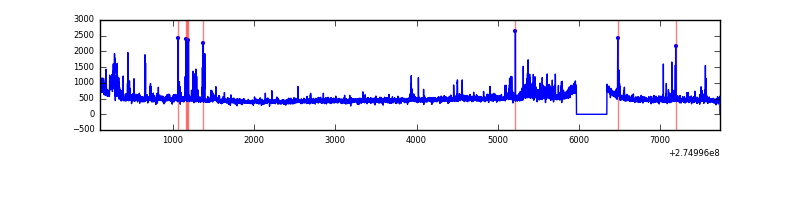 |
| C | 7640 | 7265 | 0 | 0 | 0.00% | 0.00% | 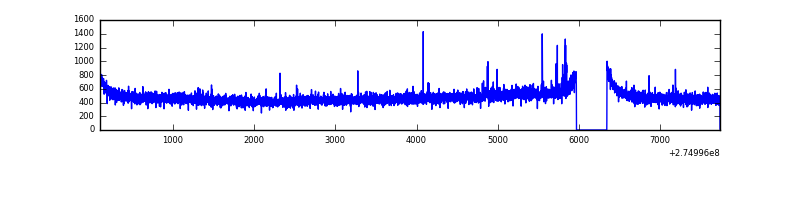 |
| D | 7640 | 7266 | 351 | 351 | 4.59% | 4.83% | 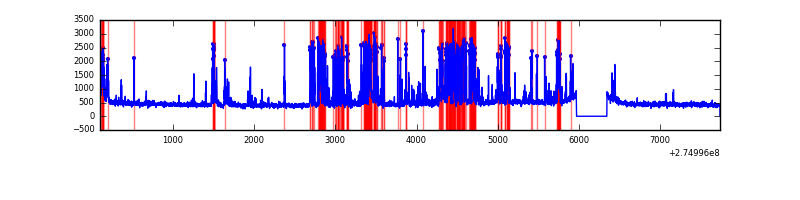 |
Top three noisy pixels from each quadrant. If the there are fewer than three noisy pixels in the level2.evt file, extra rows are filled as -1
| Pixel properties | Quadrant properties | ||||||
|---|---|---|---|---|---|---|---|
| Quadrant | DetID | PixID | Counts | Sigma | Mean | Median | Sigma |
| A | 12 | 96 | 202106 | 1169.48 | 852 | 832 | 172.1 |
| A | 15 | 174 | 152174 | 879.35 | 852 | 832 | 172.1 |
| A | 15 | 239 | 87060 | 501.02 | 852 | 832 | 172.1 |
| B | 0 | 189 | 102547 | 616.92 | 862 | 839 | 164.9 |
| B | 7 | 220 | 98837 | 594.42 | 862 | 839 | 164.9 |
| B | 4 | 216 | 50024 | 298.34 | 862 | 839 | 164.9 |
| C | 14 | 238 | 125554 | 635.59 | 830 | 833 | 196.2 |
| C | 3 | 233 | 30242 | 149.87 | 830 | 833 | 196.2 |
| C | 0 | 207 | 24230 | 119.23 | 830 | 833 | 196.2 |
| D | 12 | 218 | 1291453 | 6333.54 | 825 | 800 | 203.8 |
| D | 7 | 38 | 93804 | 456.39 | 825 | 800 | 203.8 |
| D | 12 | 250 | 50368 | 243.24 | 825 | 800 | 203.8 |
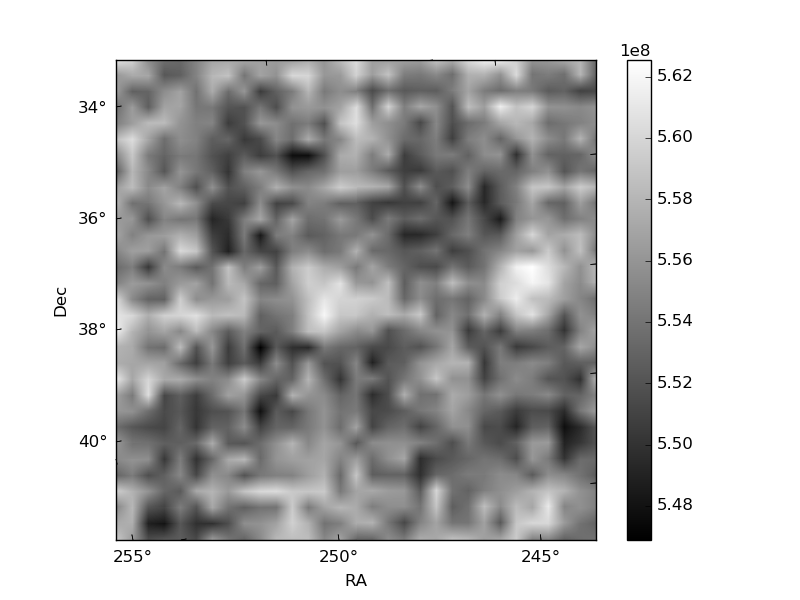
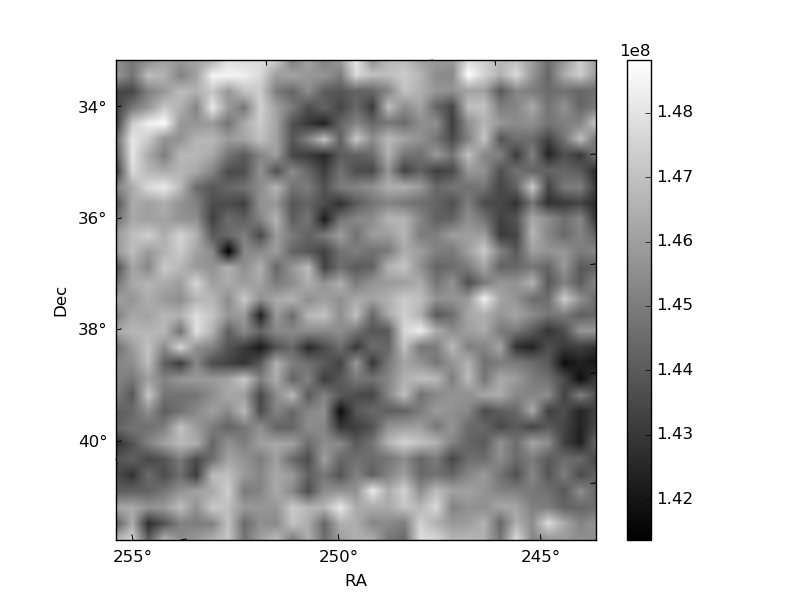
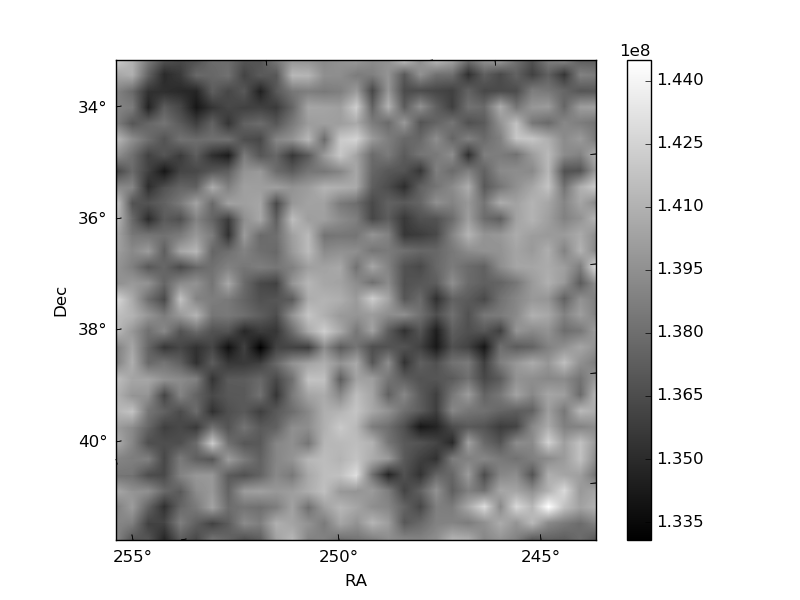
Histogram calculated using DETX and DETY for each event in the final _common_clean file
| Quadrant A | 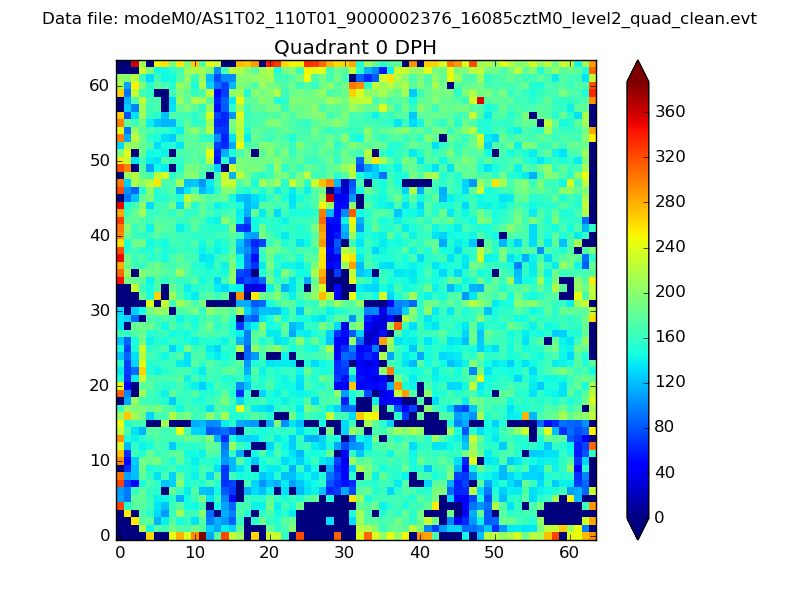 |
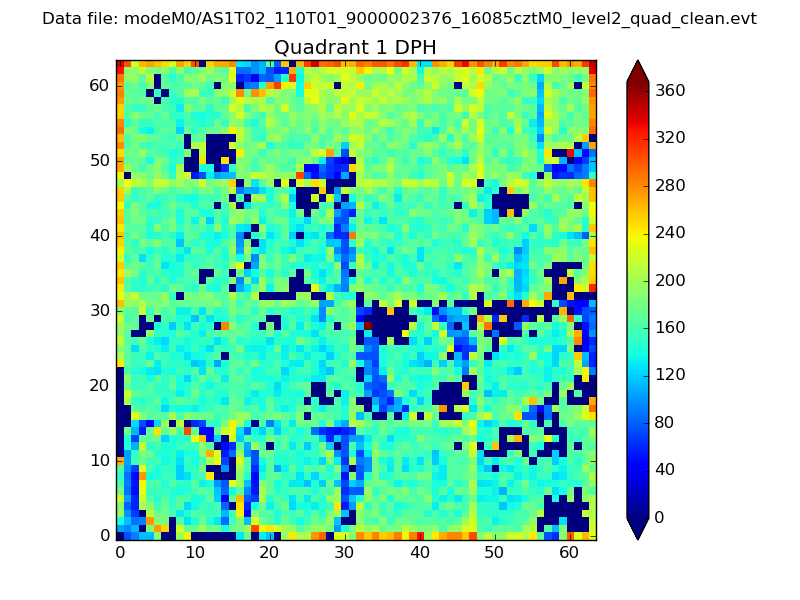 |
Quadrant B |
|---|---|---|---|
| Quadrant D | 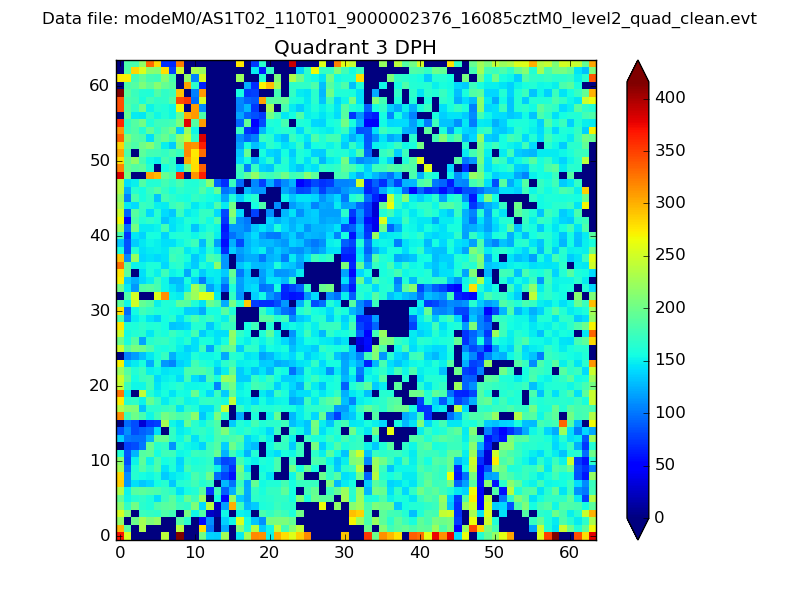 |
 |
Quadrant C |
| Plot type | Count rate plots | Images |
|---|---|---|
| Comparison with Poisson distribution Blue bars denote a histogram of data divided into 1 sec bins. Red curve is a Poisson curve with rate = median count rate of data. |
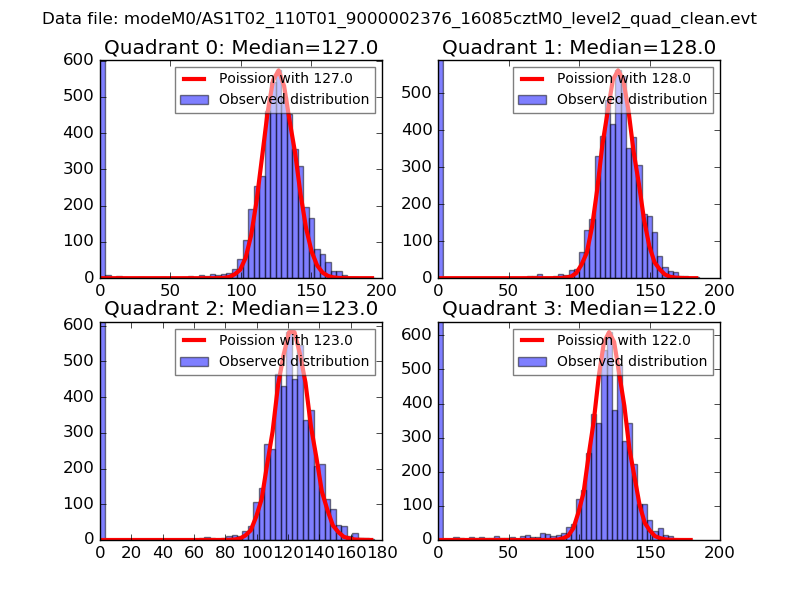 |
 |
| Quadrant-wise count rates Data is divided into 100 sec bins |
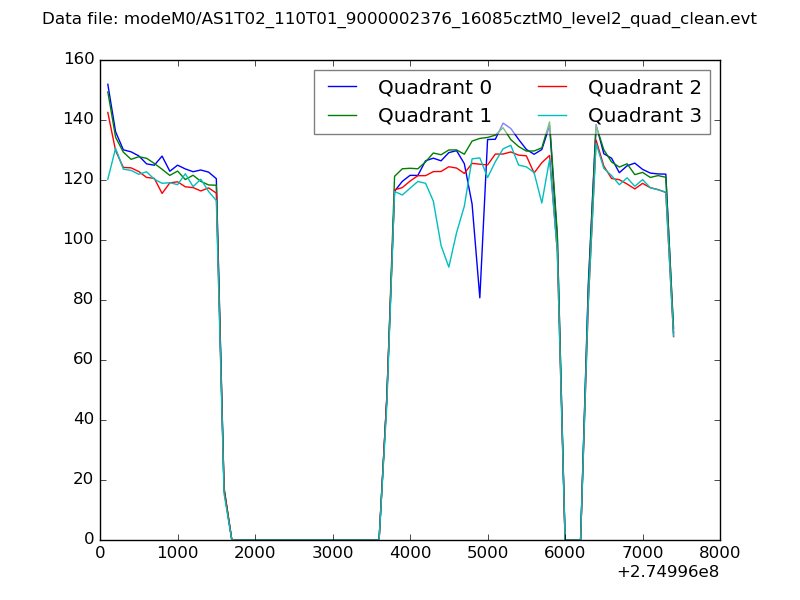 |
|
| Module-wise count rates for Quadrant A Data is divided into 100 sec bins |
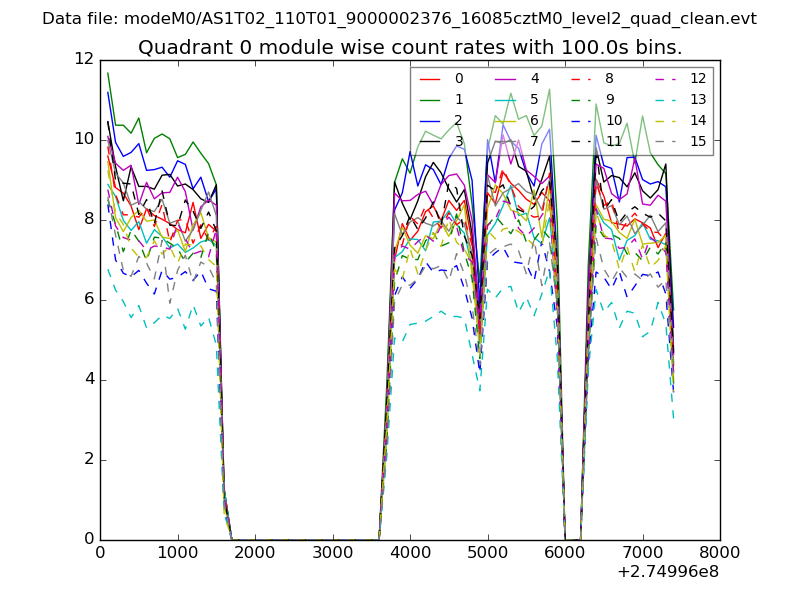 |
 |
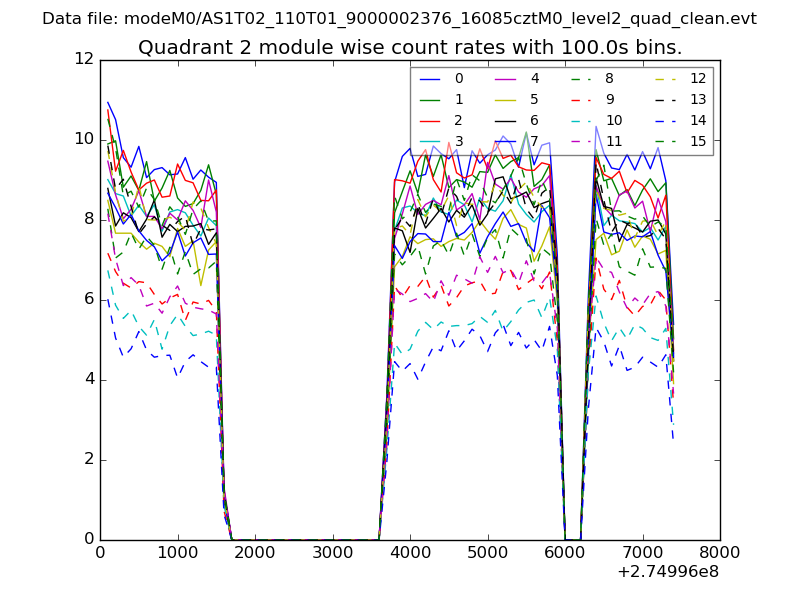
| Module-wise count rates for Quadrant B Data is divided into 100 sec bins |
 |
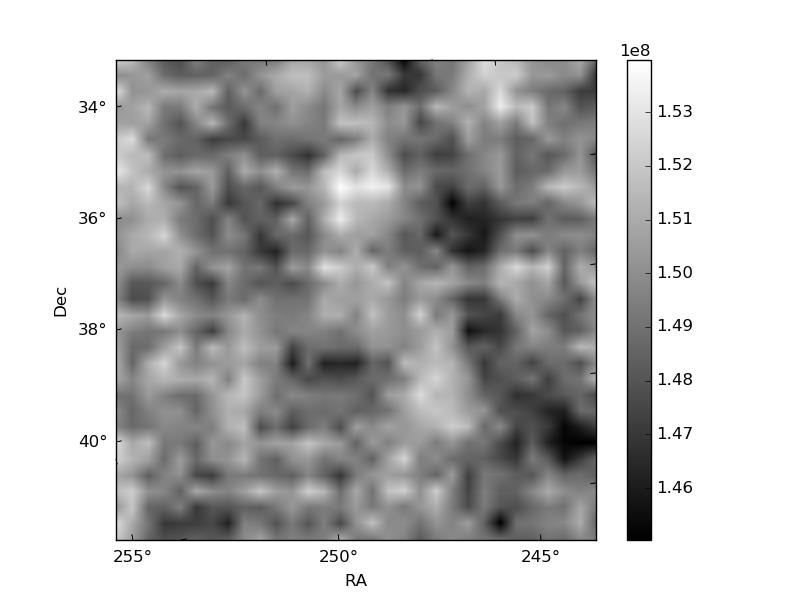 |
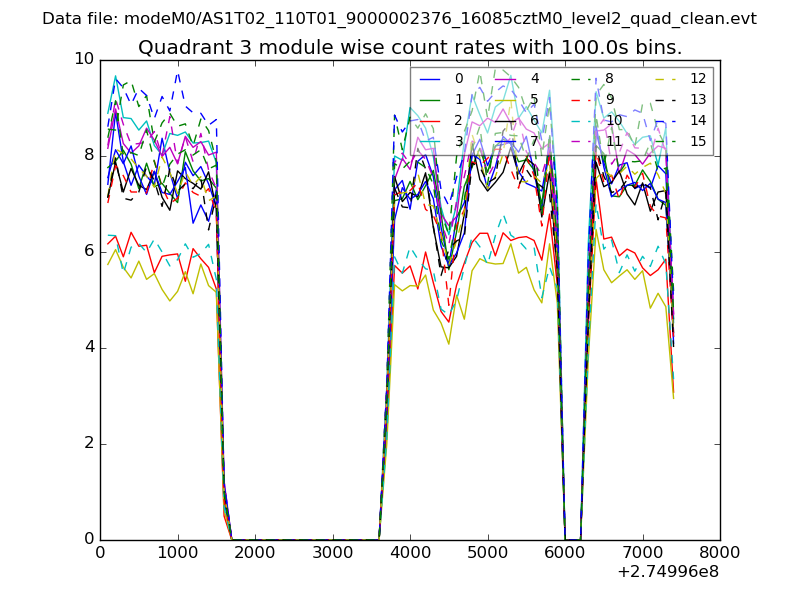
| Module-wise count rates for Quadrant C Data is divided into 100 sec bins |
 |
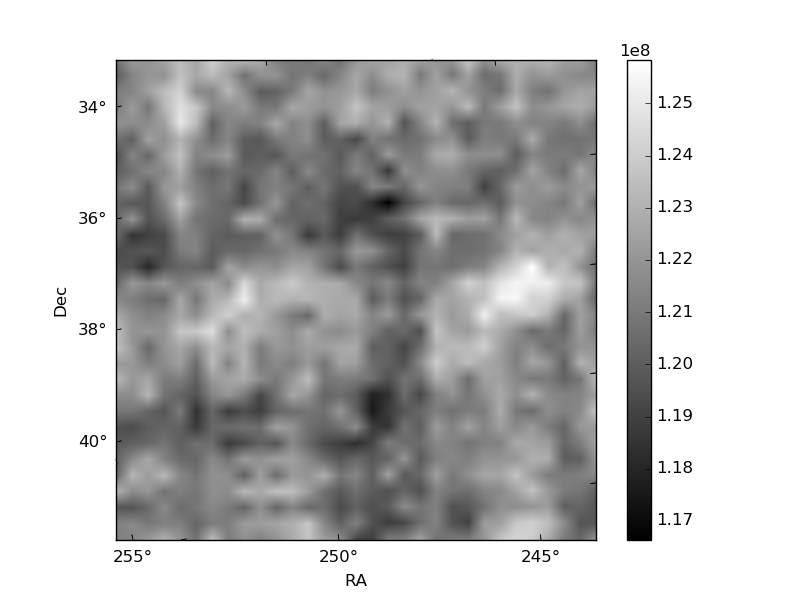 |
| Module-wise count rates for Quadrant D Data is divided into 100 sec bins |
 |
 |
| Parameter | Plot |
|---|---|
| CZT HV Monitor | 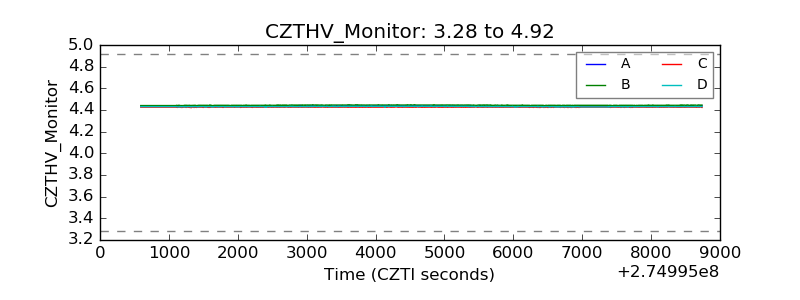 |
| D_VDD | 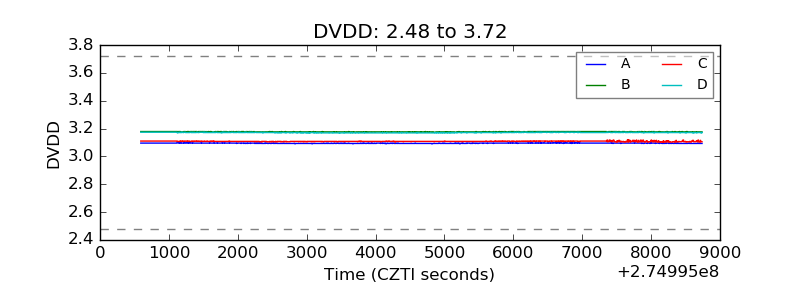 |
| Temperature 1 | 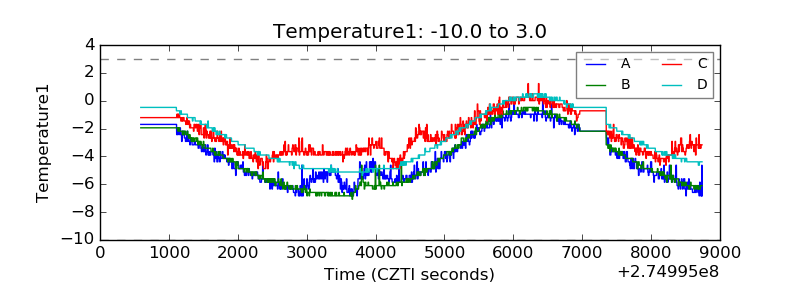 |
| Veto HV Monitor | 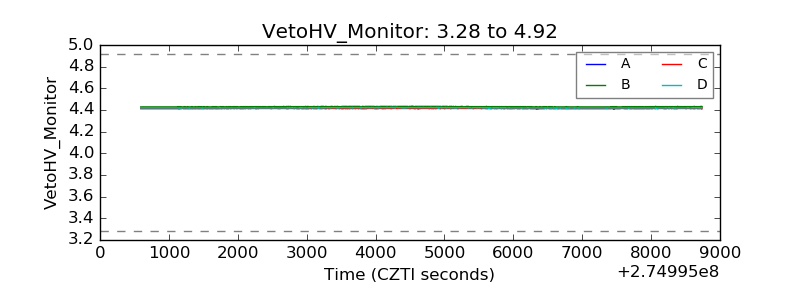 |
| Veto LLD | 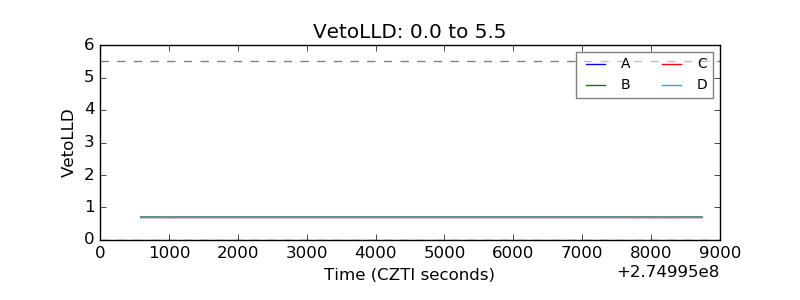 |
| Alpha Counter | 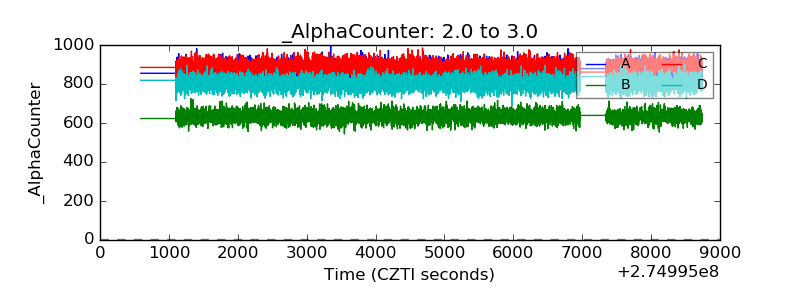 |
| _CPM_Rate | 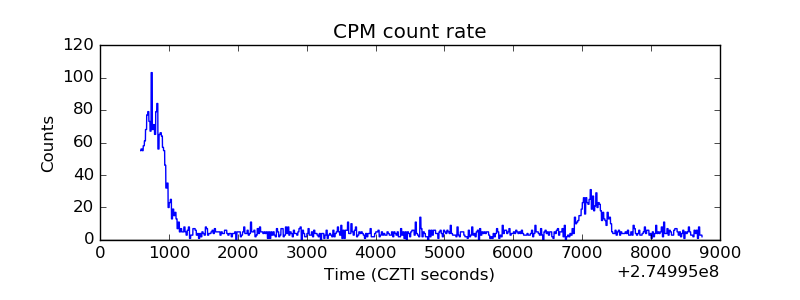 |
| CZT Counter |  |
| +2.5 Volts monitor | 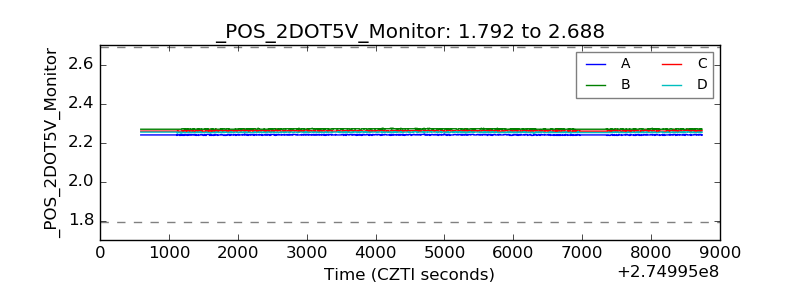 |
| +5 Volts monitor | 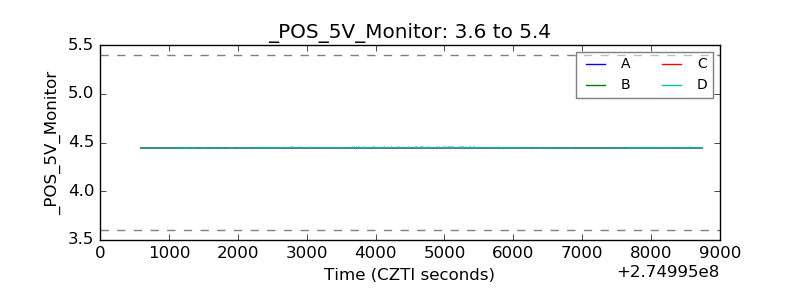 |
| _ROLL_ROT | 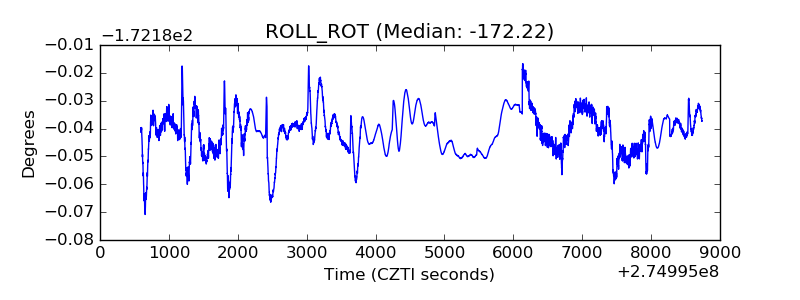 |
| _Roll_DEC | 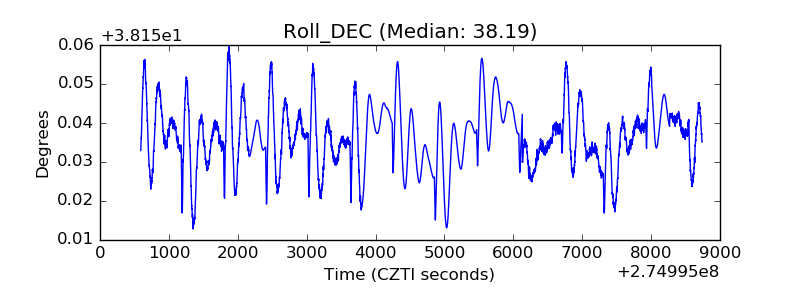 |
| _Roll_RA | 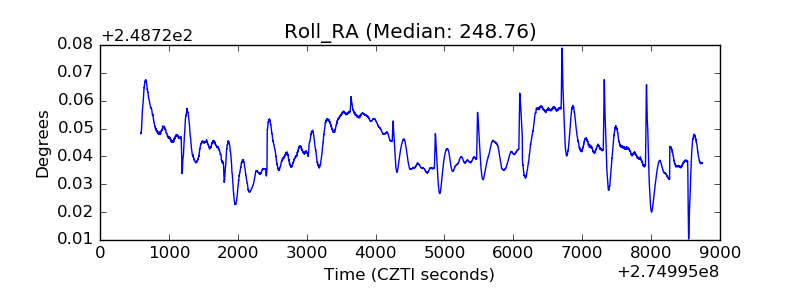 |
| Veto Counter | 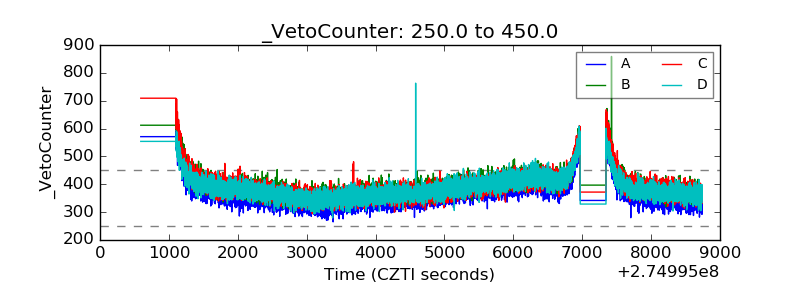 |