| Param | Original file | Final file |
|---|---|---|
| Filename | modeM0/AS1T02_110T01_9000002376_16086cztM0_level2.evt | modeM0/AS1T02_110T01_9000002376_16086cztM0_level2_quad_clean.evt |
| Size (bytes) | 532,895,040 | 92,272,320 |
| Size | 508.2 MB | 88.0 MB |
| Events in quadrant A | 3,635,822 | 582,509 |
| Events in quadrant B | 3,982,603 | 582,201 |
| Events in quadrant C | 3,736,489 | 558,278 |
| Events in quadrant D | 4,260,038 | 534,716 |
| Mode SS | |||
|---|---|---|---|
| Quadrant | BADHDUFLAG | Total packets | Discarded packets |
| A | 0 | 160 | 0 |
| B | 0 | 160 | 0 |
| C | 0 | 160 | 0 |
| D | 0 | 160 | 0 |
| Mode M9 | |||
|---|---|---|---|
| Quadrant | BADHDUFLAG | Total packets | Discarded packets |
| A | 0 | 7 | 0 |
| B | 0 | 7 | 0 |
| C | 0 | 7 | 0 |
| D | 0 | 7 | 0 |
| Mode M0 | |||
|---|---|---|---|
| Quadrant | BADHDUFLAG | Total packets | Discarded packets |
| A | 0 | 16168 | 3 |
| B | 0 | 17071 | 2 |
| C | 0 | 16130 | 2 |
| D | 0 | 18351 | 2 |
| Quadrant | Total seconds | Saturated seconds | Saturation percentage |
|---|---|---|---|
| A | 7707 | 81 | 1.050993% |
| B | 7707 | 122 | 1.582977% |
| C | 7707 | 109 | 1.414299% |
| D | 7707 | 343 | 4.450500% |
Noise dominated data is calculated using 1-second bins in cleaned event files. If a bin has >2000 counts, and if more than 50% of those come from <1% of pixels, then it is considered to be noise-dominated and hence unusable.
| Quadrant | # 1 sec bins | Bins with >0 counts | Bins with >2000 counts | High rate bins dominated by noise | Noise dominated (total time) | Noise dominated (detector-on time) | Marked lightcurve |
|---|---|---|---|---|---|---|---|
| A | 8443 | 7709 | 13 | 13 | 0.15% | 0.17% | 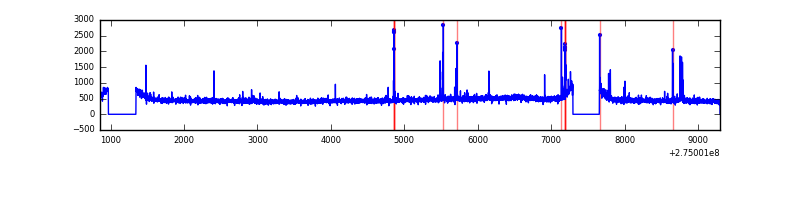 |
| B | 8443 | 7709 | 14 | 14 | 0.17% | 0.18% | 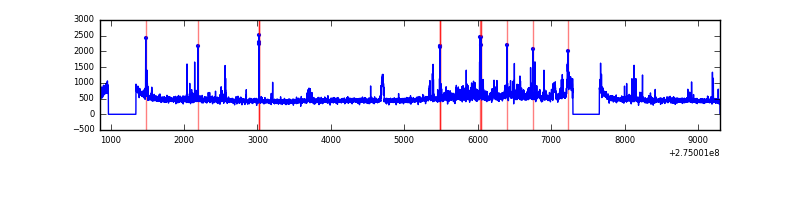 |
| C | 8443 | 7708 | 0 | 0 | 0.00% | 0.00% | 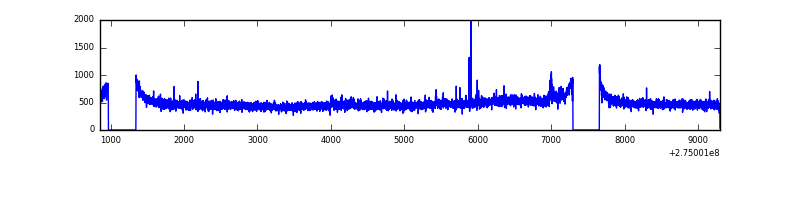 |
| D | 8443 | 7710 | 289 | 289 | 3.42% | 3.75% | 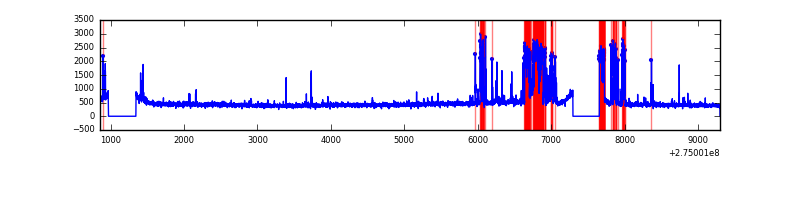 |
Top three noisy pixels from each quadrant. If the there are fewer than three noisy pixels in the level2.evt file, extra rows are filled as -1
| Pixel properties | Quadrant properties | ||||||
|---|---|---|---|---|---|---|---|
| Quadrant | DetID | PixID | Counts | Sigma | Mean | Median | Sigma |
| A | 15 | 239 | 69624 | 370.65 | 912 | 890 | 185.4 |
| A | 12 | 96 | 47282 | 250.17 | 912 | 890 | 185.4 |
| A | 9 | 143 | 10771 | 53.28 | 912 | 890 | 185.4 |
| B | 0 | 189 | 145705 | 821.19 | 915 | 889 | 176.3 |
| B | 7 | 220 | 55627 | 310.4 | 915 | 889 | 176.3 |
| B | 3 | 209 | 50651 | 282.18 | 915 | 889 | 176.3 |
| C | 3 | 233 | 139606 | 669.46 | 881 | 884 | 207.2 |
| C | 14 | 238 | 131571 | 630.68 | 881 | 884 | 207.2 |
| C | 8 | 128 | 11416 | 50.82 | 881 | 884 | 207.2 |
| D | 7 | 38 | 768783 | 3591.34 | 873 | 849 | 213.8 |
| D | 12 | 218 | 127621 | 592.87 | 873 | 849 | 213.8 |
| D | 2 | 234 | 28674 | 130.13 | 873 | 849 | 213.8 |
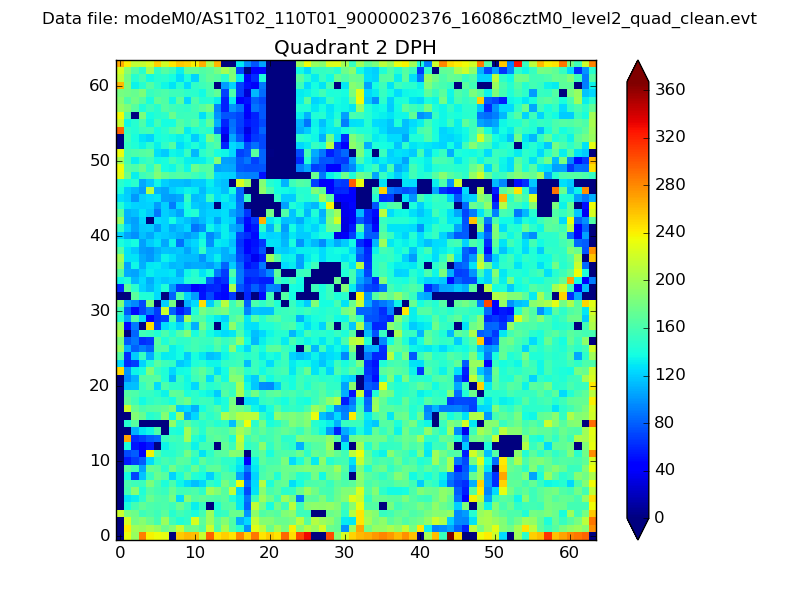
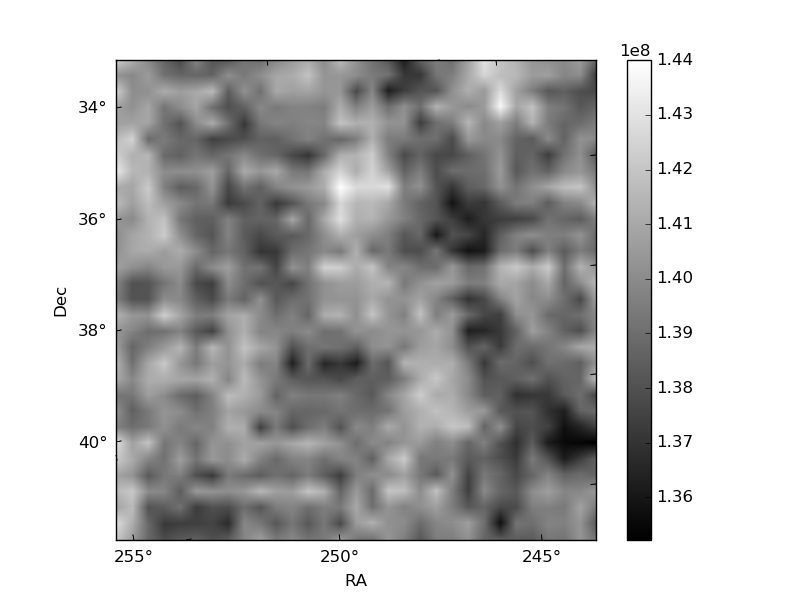
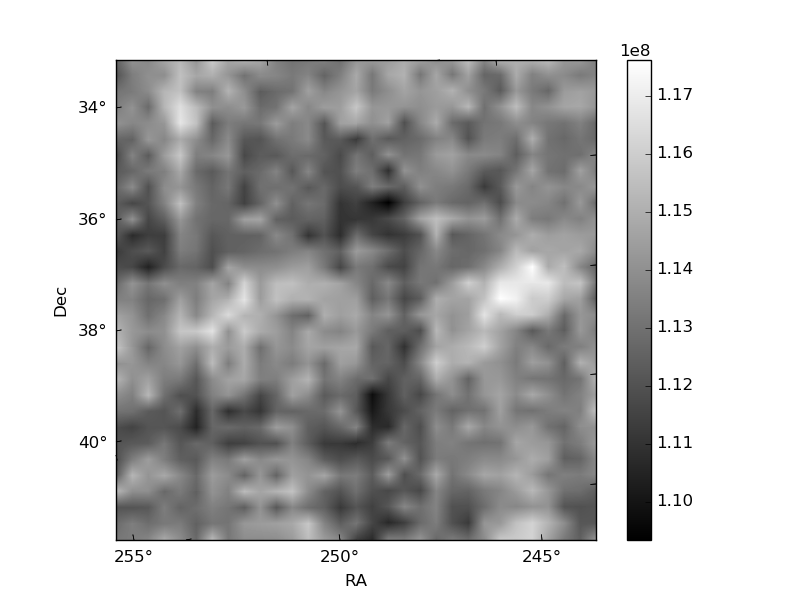
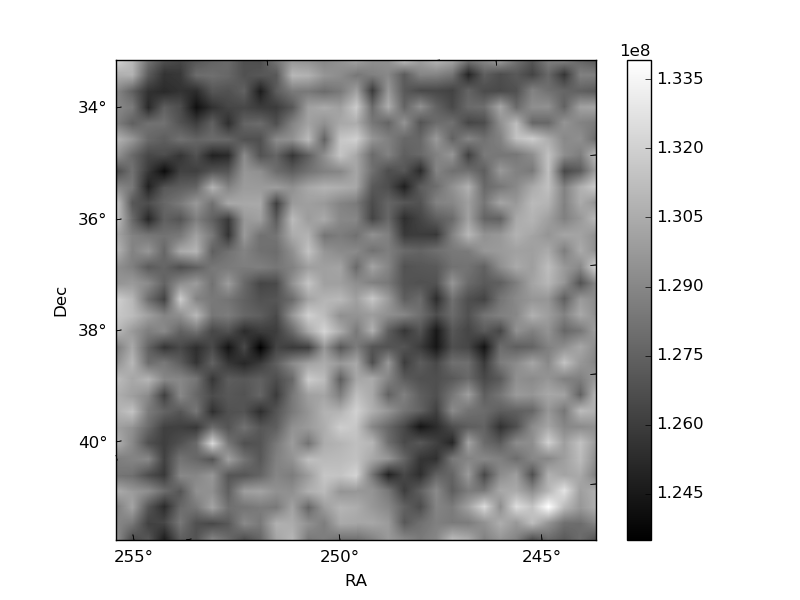
Histogram calculated using DETX and DETY for each event in the final _common_clean file
| Quadrant A | 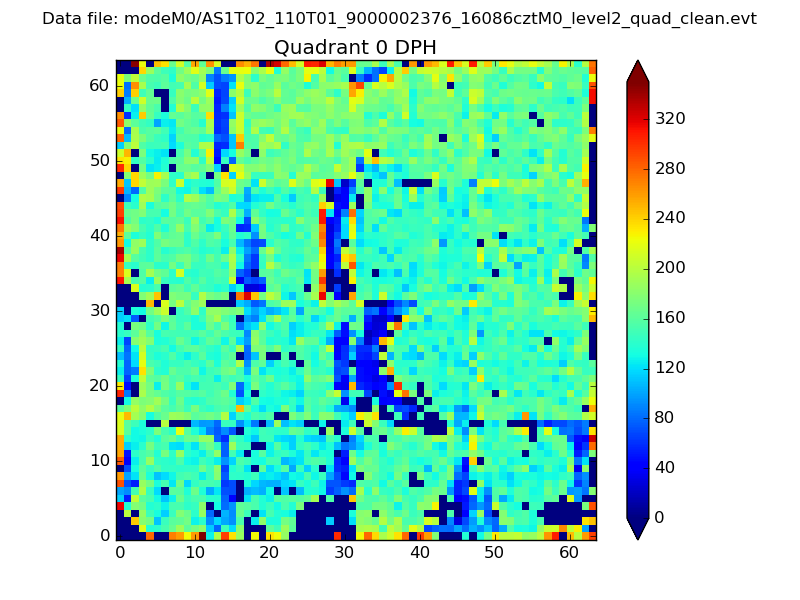 |
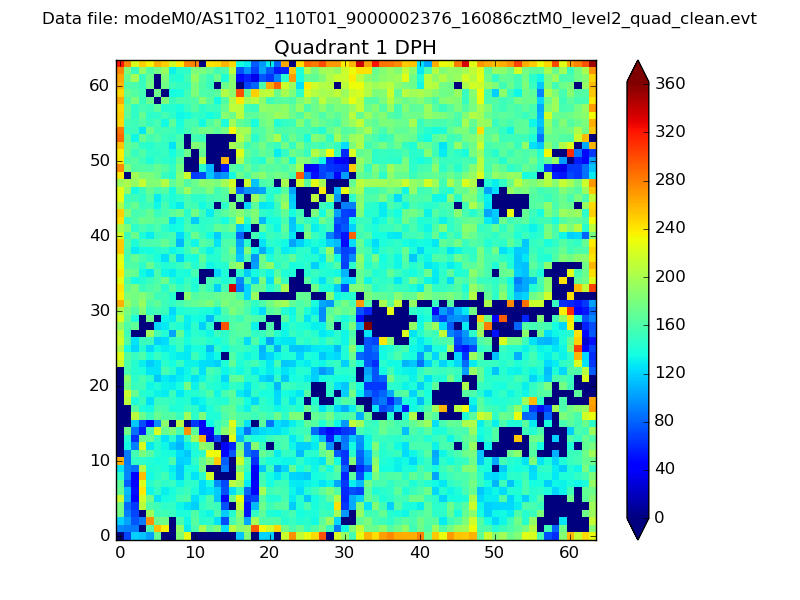 |
Quadrant B |
|---|---|---|---|
| Quadrant D | 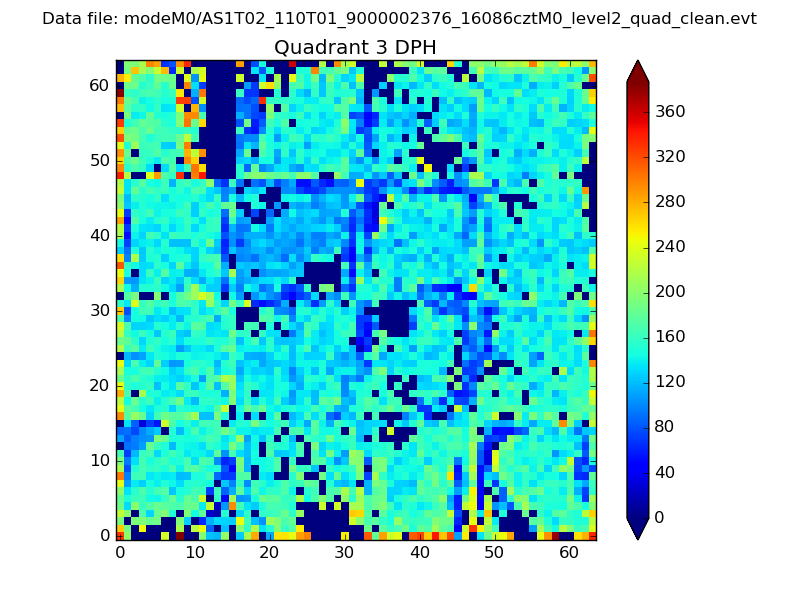 |
 |
Quadrant C |
| Plot type | Count rate plots | Images |
|---|---|---|
| Comparison with Poisson distribution Blue bars denote a histogram of data divided into 1 sec bins. Red curve is a Poisson curve with rate = median count rate of data. |
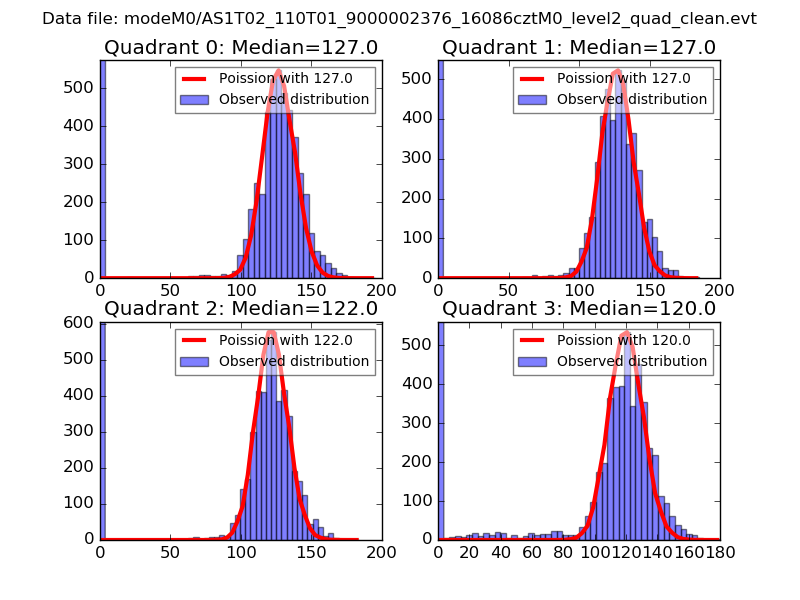 |
 |
| Quadrant-wise count rates Data is divided into 100 sec bins |
 |
|
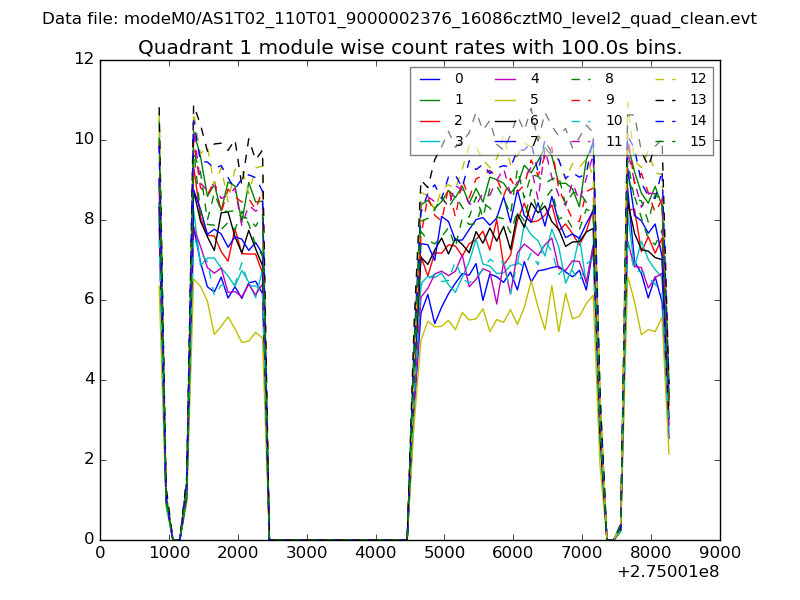
| Module-wise count rates for Quadrant A Data is divided into 100 sec bins |
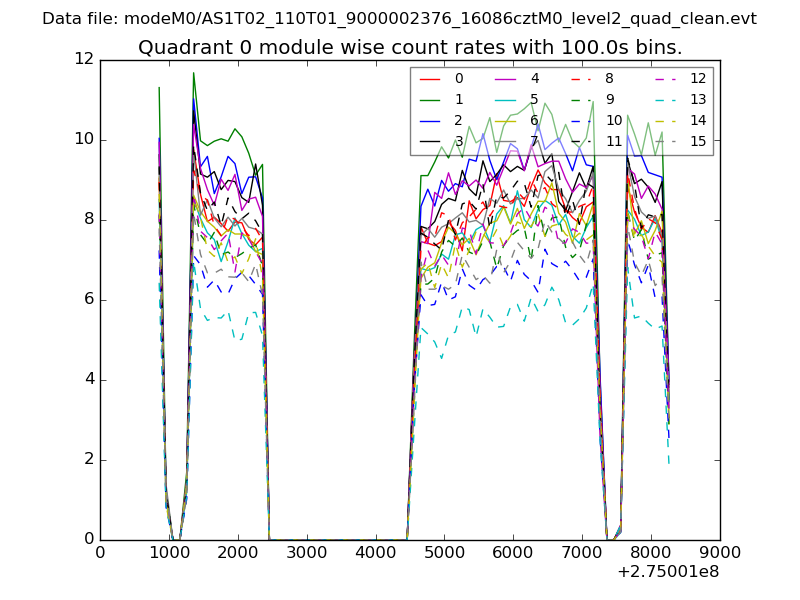 |
 |
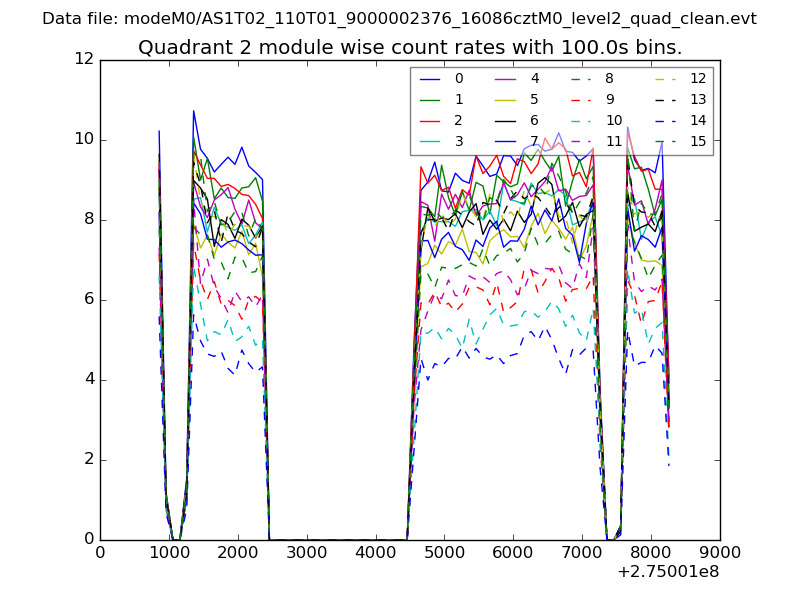
| Module-wise count rates for Quadrant B Data is divided into 100 sec bins |
 |
 |
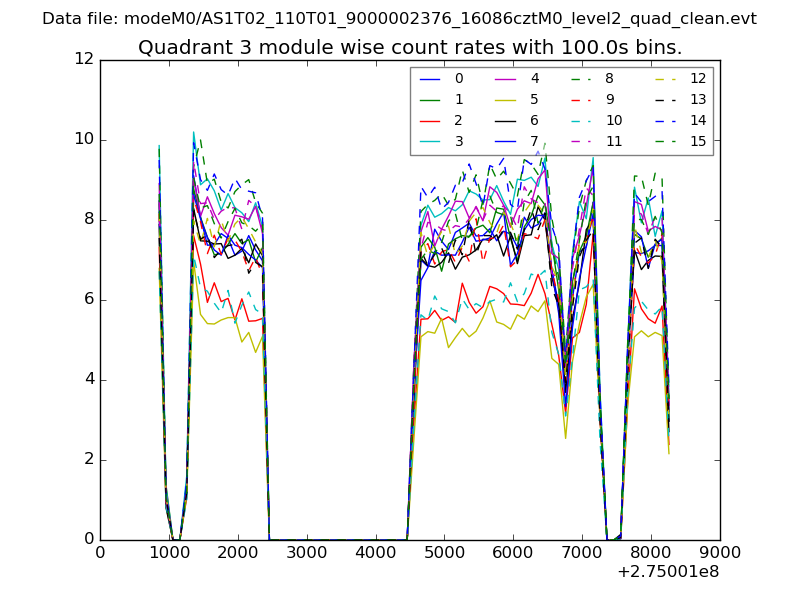
| Module-wise count rates for Quadrant C Data is divided into 100 sec bins |
 |
 |
| Module-wise count rates for Quadrant D Data is divided into 100 sec bins |
 |
 |
| Parameter | Plot |
|---|---|
| CZT HV Monitor | 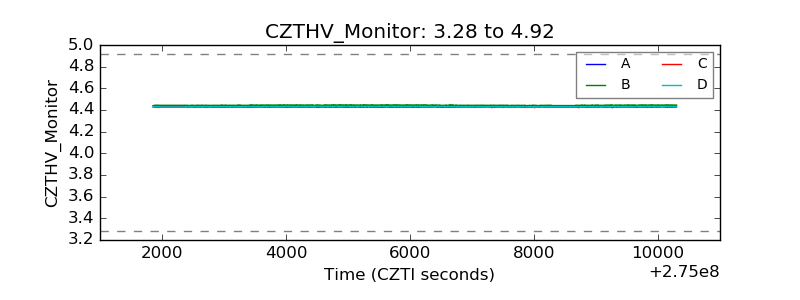 |
| D_VDD | 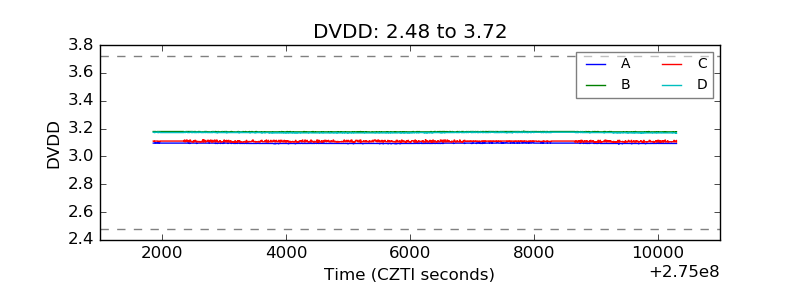 |
| Temperature 1 | 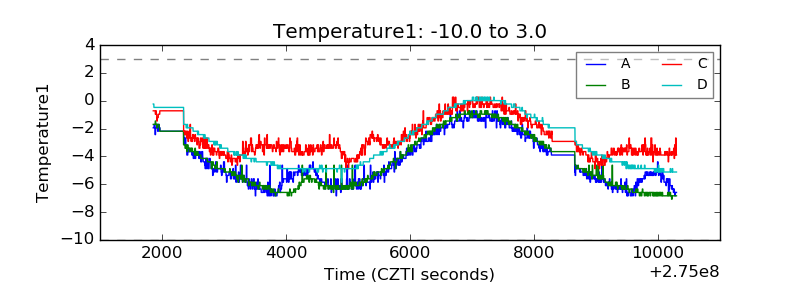 |
| Veto HV Monitor |  |
| Veto LLD | 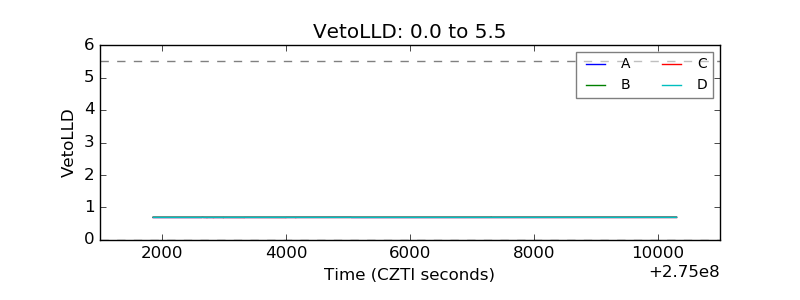 |
| Alpha Counter |  |
| _CPM_Rate | 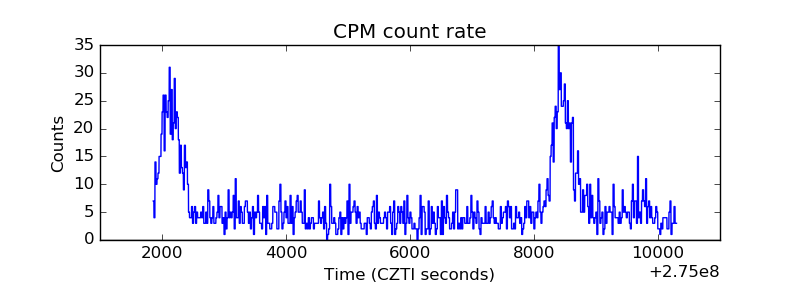 |
| CZT Counter | 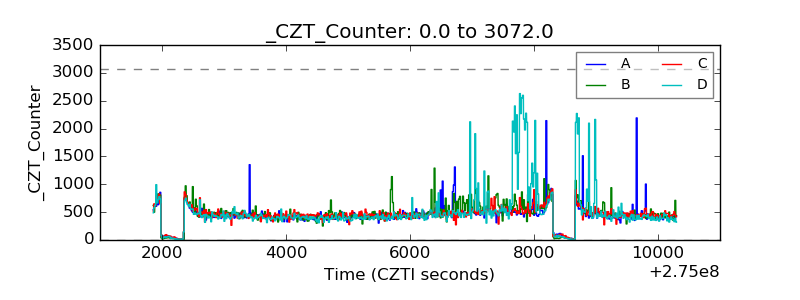 |
| +2.5 Volts monitor |  |
| +5 Volts monitor |  |
| _ROLL_ROT | 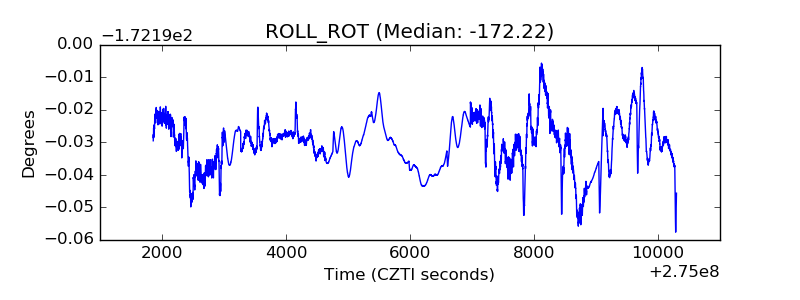 |
| _Roll_DEC | 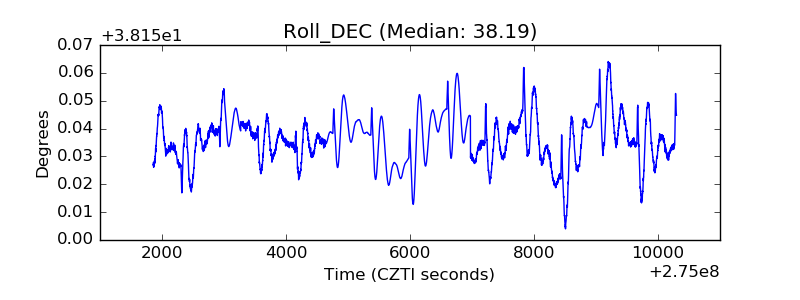 |
| _Roll_RA |  |
| Veto Counter | 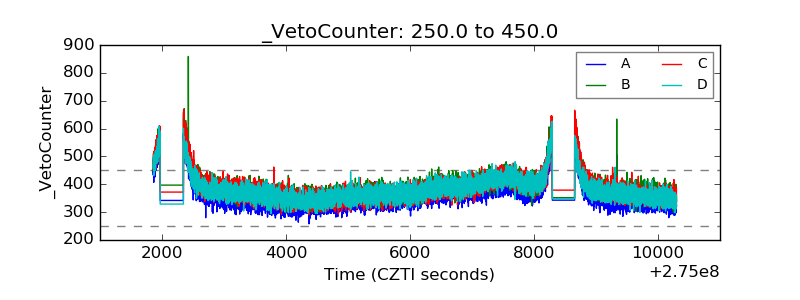 |