| Param | Original file | Final file |
|---|---|---|
| Filename | modeM0/AS1T02_110T01_9000002376_16089cztM0_level2.evt | modeM0/AS1T02_110T01_9000002376_16089cztM0_level2_quad_clean.evt |
| Size (bytes) | 1,324,857,600 | 216,921,600 |
| Size | 1.2 GB | 206.9 MB |
| Events in quadrant A | 8,982,628 | 1,365,903 |
| Events in quadrant B | 9,441,107 | 1,359,875 |
| Events in quadrant C | 9,069,952 | 1,308,585 |
| Events in quadrant D | 11,372,882 | 1,253,990 |
| Mode SS | |||
|---|---|---|---|
| Quadrant | BADHDUFLAG | Total packets | Discarded packets |
| A | 0 | 380 | 0 |
| B | 0 | 380 | 0 |
| C | 0 | 380 | 0 |
| D | 0 | 380 | 0 |
| Mode M9 | |||
|---|---|---|---|
| Quadrant | BADHDUFLAG | Total packets | Discarded packets |
| A | 0 | 20 | 0 |
| B | 0 | 20 | 0 |
| C | 0 | 20 | 0 |
| D | 0 | 20 | 0 |
| Mode M0 | |||
|---|---|---|---|
| Quadrant | BADHDUFLAG | Total packets | Discarded packets |
| A | 0 | 39234 | 5 |
| B | 0 | 39992 | 4 |
| C | 0 | 39036 | 4 |
| D | 0 | 47091 | 4 |
| Quadrant | Total seconds | Saturated seconds | Saturation percentage |
|---|---|---|---|
| A | 18583 | 203 | 1.092396% |
| B | 18583 | 234 | 1.259215% |
| C | 18583 | 215 | 1.156971% |
| D | 18583 | 930 | 5.004574% |
Noise dominated data is calculated using 1-second bins in cleaned event files. If a bin has >2000 counts, and if more than 50% of those come from <1% of pixels, then it is considered to be noise-dominated and hence unusable.
| Quadrant | # 1 sec bins | Bins with >0 counts | Bins with >2000 counts | High rate bins dominated by noise | Noise dominated (total time) | Noise dominated (detector-on time) | Marked lightcurve |
|---|---|---|---|---|---|---|---|
| A | 20444 | 18584 | 55 | 55 | 0.27% | 0.30% | 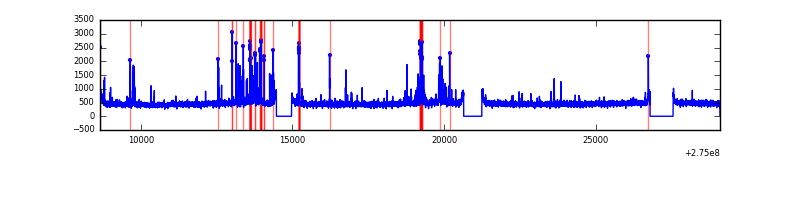 |
| B | 20444 | 18584 | 39 | 39 | 0.19% | 0.21% |  |
| C | 20444 | 18584 | 1 | 1 | 0.00% | 0.01% | 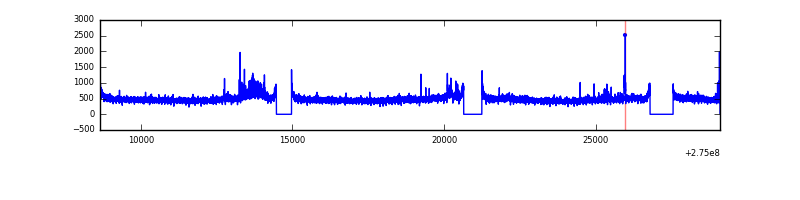 |
| D | 20444 | 18585 | 748 | 748 | 3.66% | 4.02% | 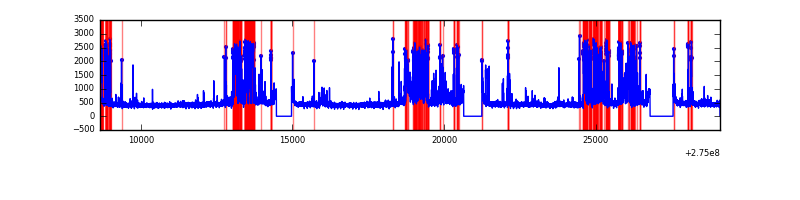 |
Top three noisy pixels from each quadrant. If the there are fewer than three noisy pixels in the level2.evt file, extra rows are filled as -1
| Pixel properties | Quadrant properties | ||||||
|---|---|---|---|---|---|---|---|
| Quadrant | DetID | PixID | Counts | Sigma | Mean | Median | Sigma |
| A | 15 | 239 | 396129 | 890.06 | 2199 | 2150 | 442.6 |
| A | 12 | 96 | 69014 | 151.06 | 2199 | 2150 | 442.6 |
| A | 15 | 174 | 61468 | 134.01 | 2199 | 2150 | 442.6 |
| B | 7 | 220 | 255328 | 601.99 | 2206 | 2148 | 420.6 |
| B | 15 | 201 | 94071 | 218.57 | 2206 | 2148 | 420.6 |
| B | 0 | 189 | 85911 | 199.16 | 2206 | 2148 | 420.6 |
| C | 3 | 233 | 445351 | 896.65 | 2114 | 2127 | 494.3 |
| C | 14 | 238 | 321603 | 646.31 | 2114 | 2127 | 494.3 |
| C | 7 | 247 | 27705 | 51.74 | 2114 | 2127 | 494.3 |
| D | 7 | 38 | 2469252 | 4813.72 | 2107 | 2041 | 512.5 |
| D | 12 | 218 | 623444 | 1212.41 | 2107 | 2041 | 512.5 |
| D | 13 | 112 | 74585 | 141.54 | 2107 | 2041 | 512.5 |
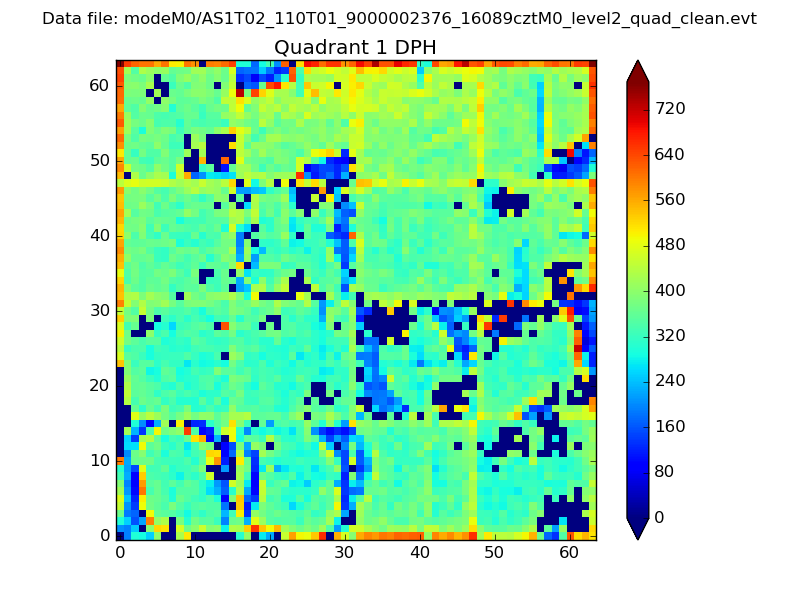
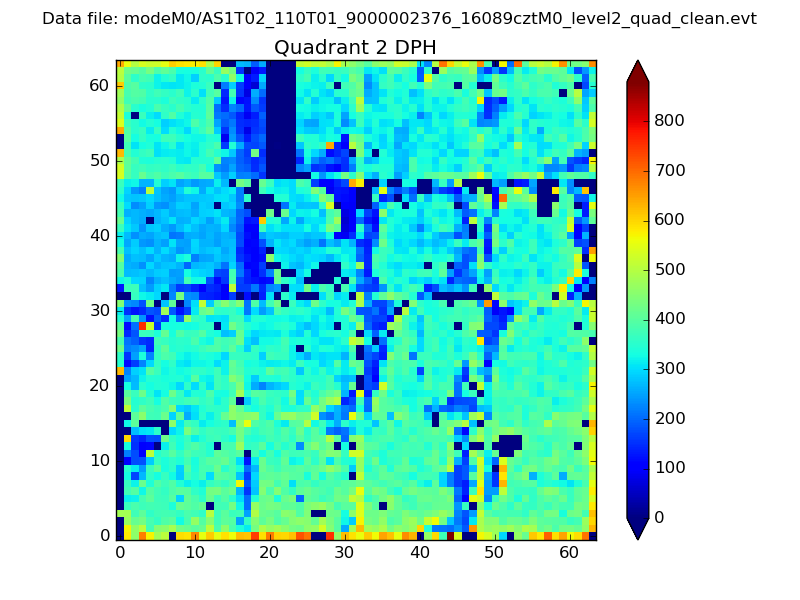
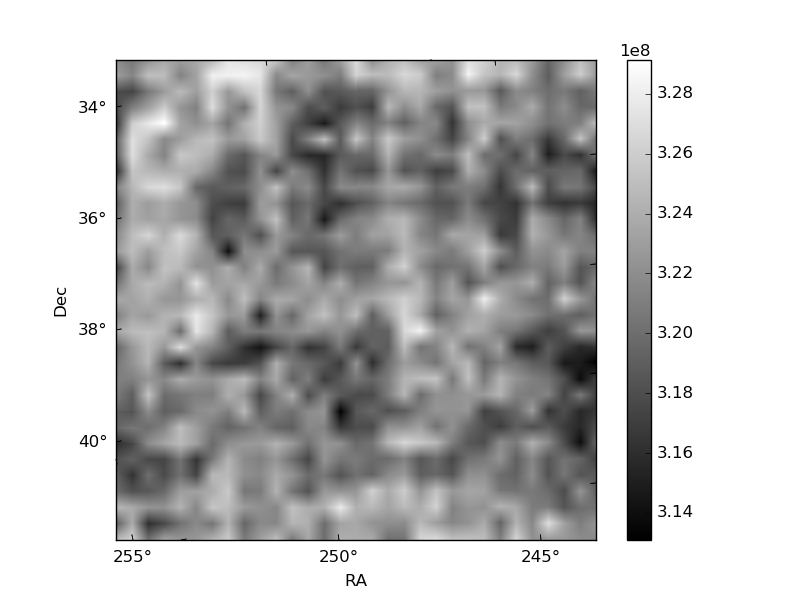
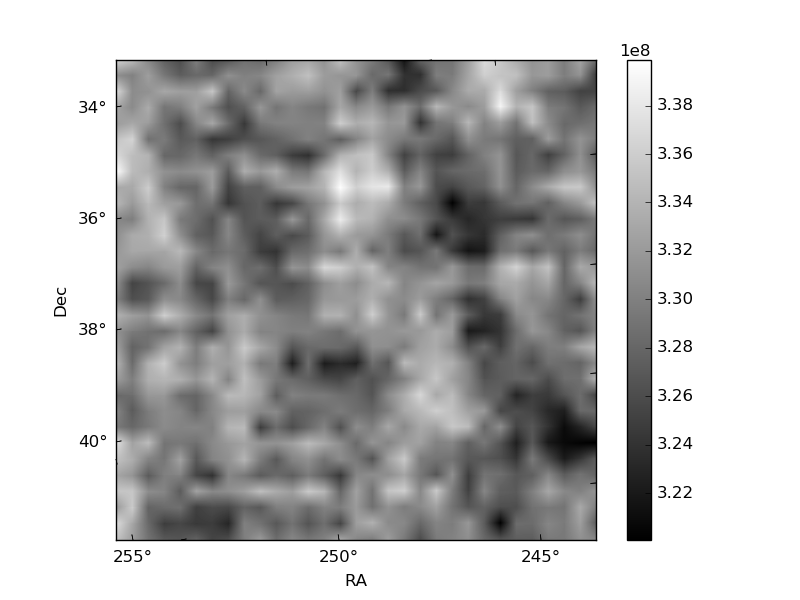
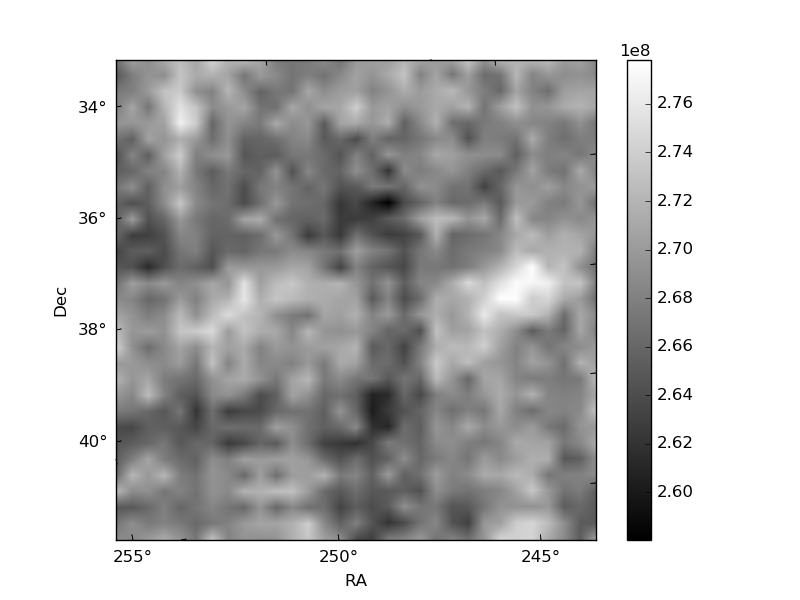
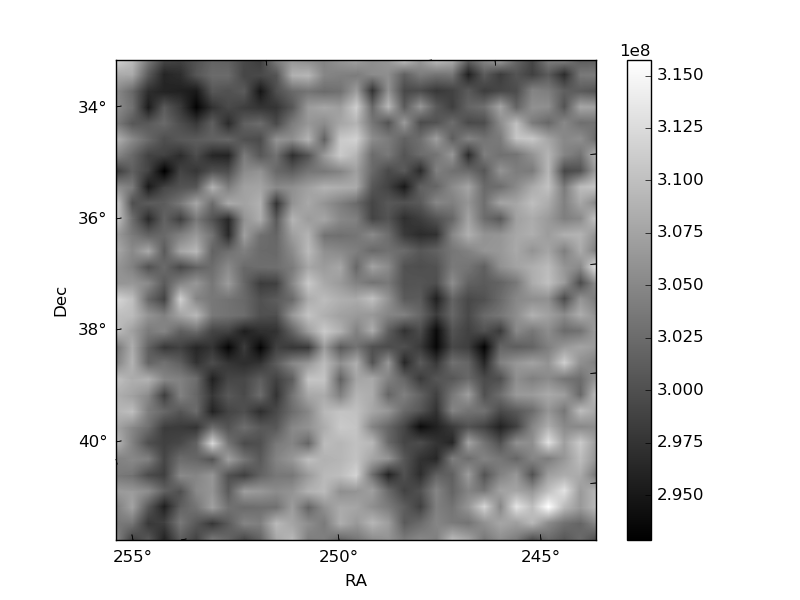
Histogram calculated using DETX and DETY for each event in the final _common_clean file
| Quadrant A | 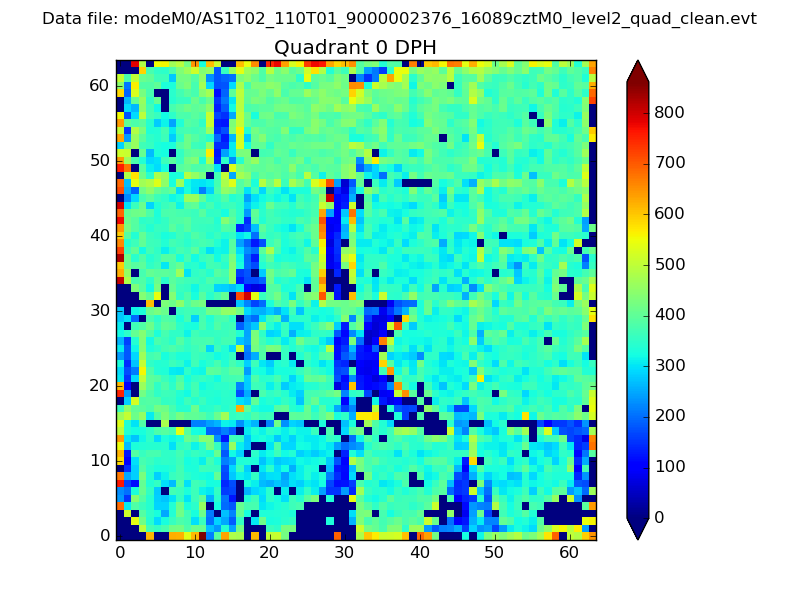 |
 |
Quadrant B |
|---|---|---|---|
| Quadrant D | 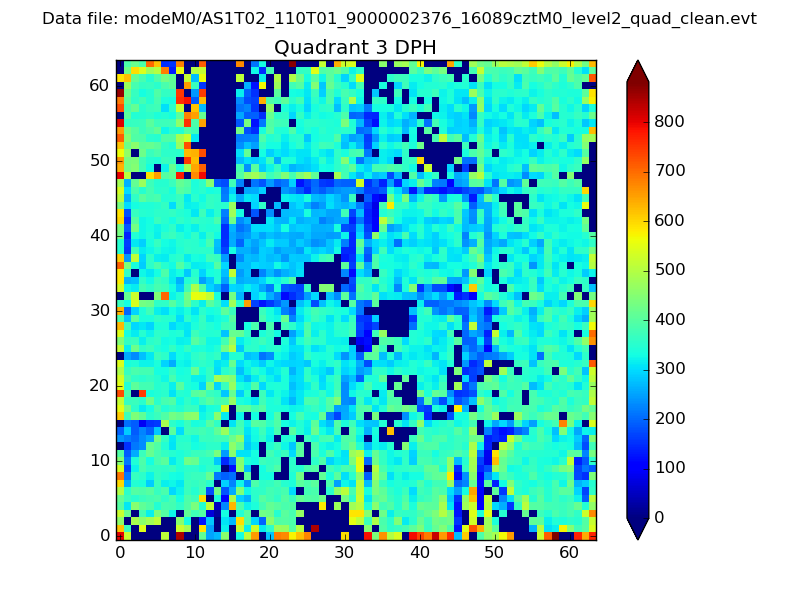 |
 |
Quadrant C |
| Plot type | Count rate plots | Images |
|---|---|---|
| Comparison with Poisson distribution Blue bars denote a histogram of data divided into 1 sec bins. Red curve is a Poisson curve with rate = median count rate of data. |
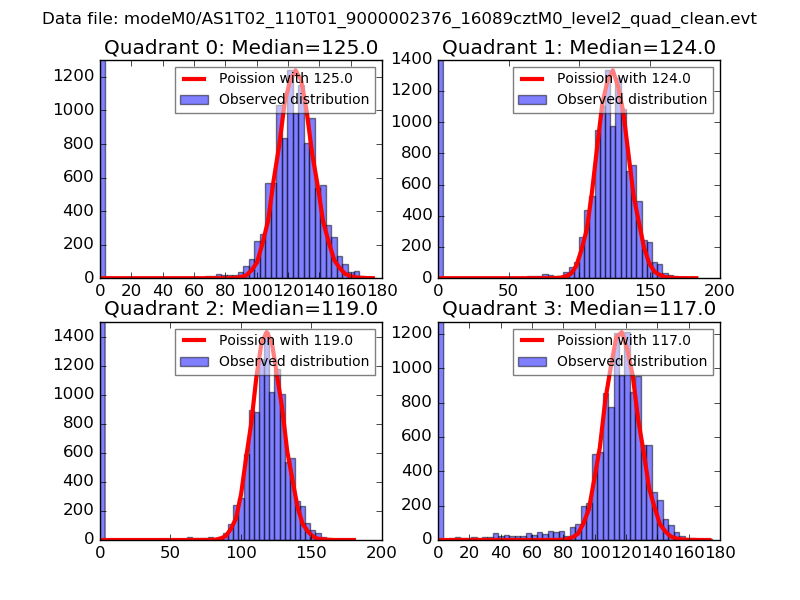 |
 |
| Quadrant-wise count rates Data is divided into 100 sec bins |
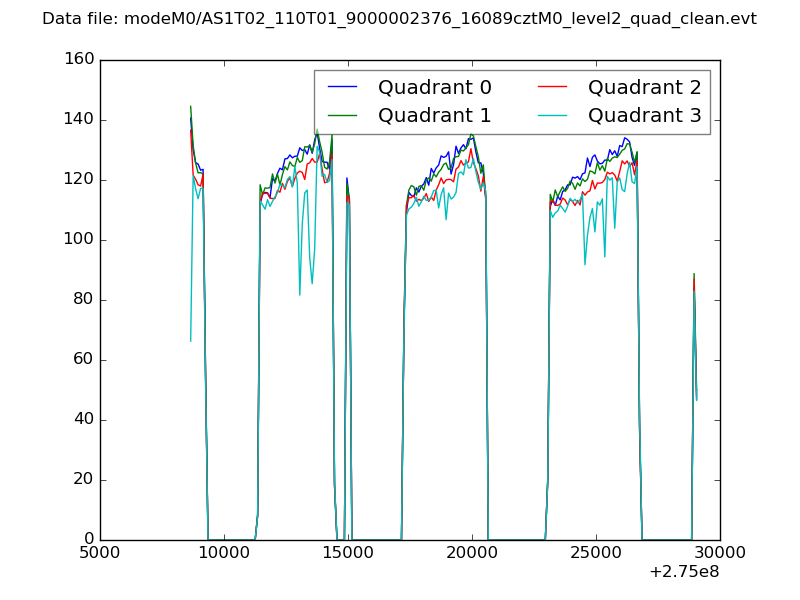 |
|
| Module-wise count rates for Quadrant A Data is divided into 100 sec bins |
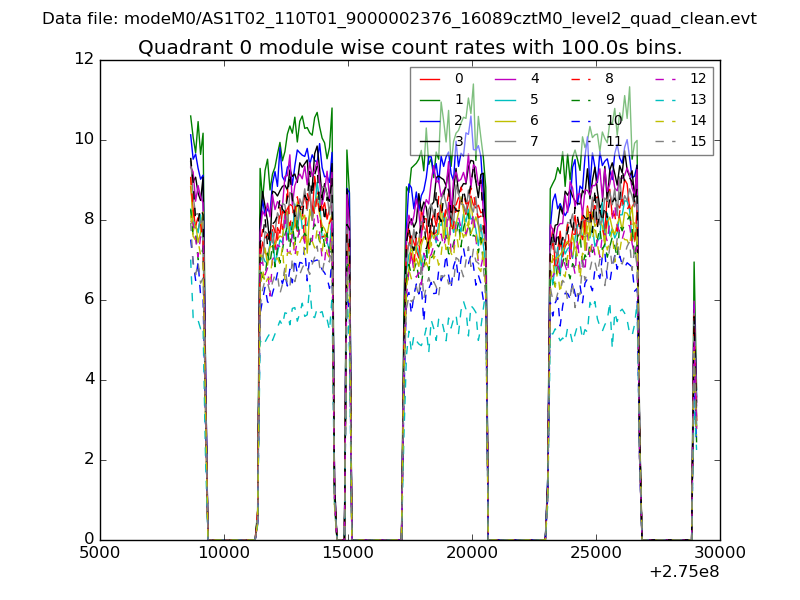 |
 |
| Module-wise count rates for Quadrant B Data is divided into 100 sec bins |
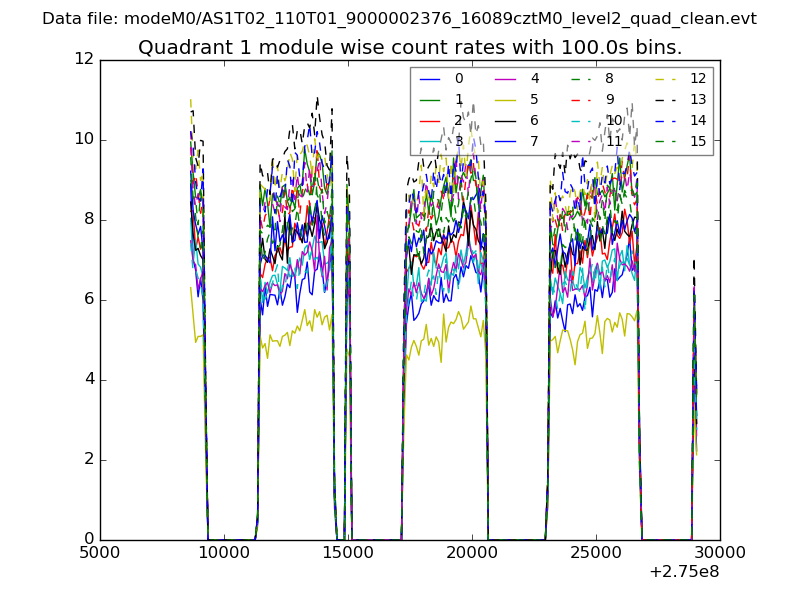 |
 |
| Module-wise count rates for Quadrant C Data is divided into 100 sec bins |
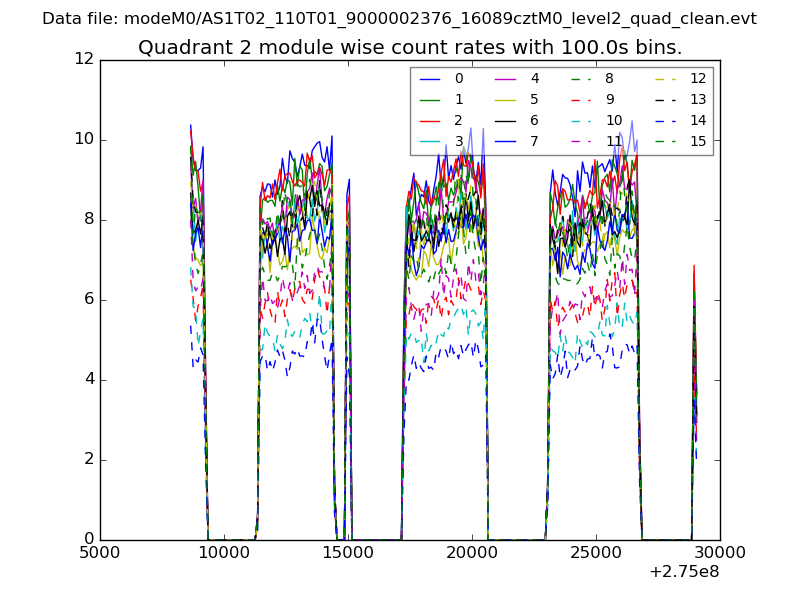 |
 |
| Module-wise count rates for Quadrant D Data is divided into 100 sec bins |
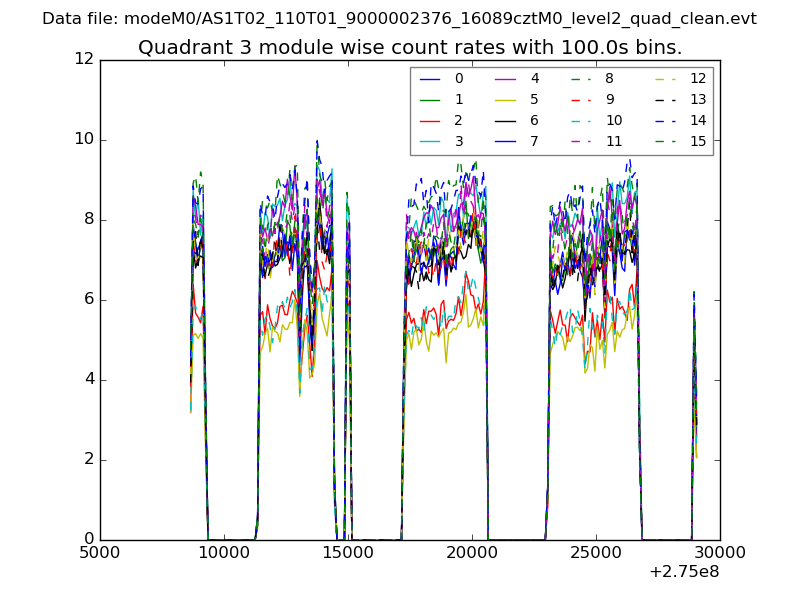 |
 |
| Parameter | Plot |
|---|---|
| CZT HV Monitor | 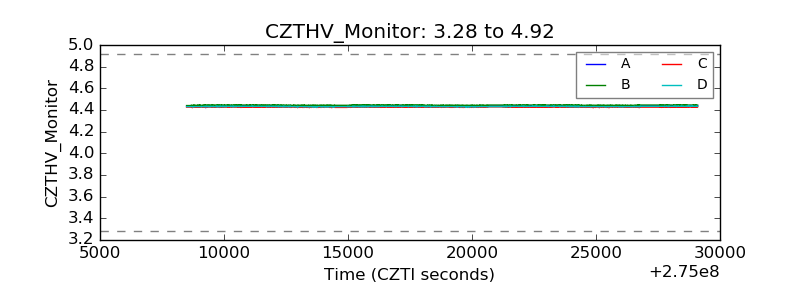 |
| D_VDD | 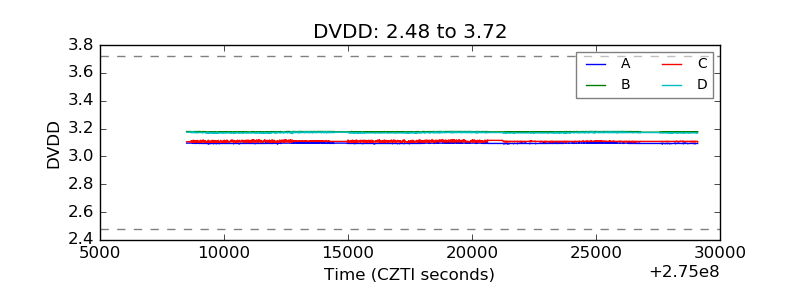 |
| Temperature 1 | 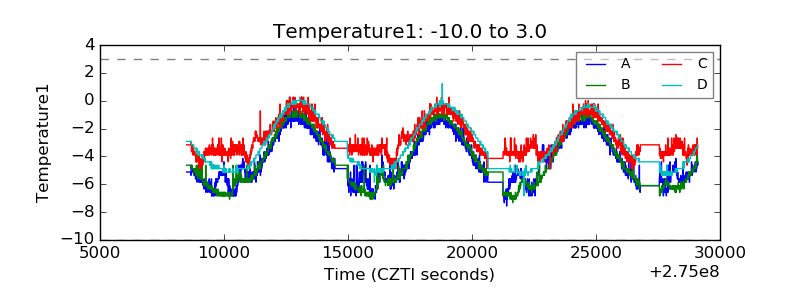 |
| Veto HV Monitor | 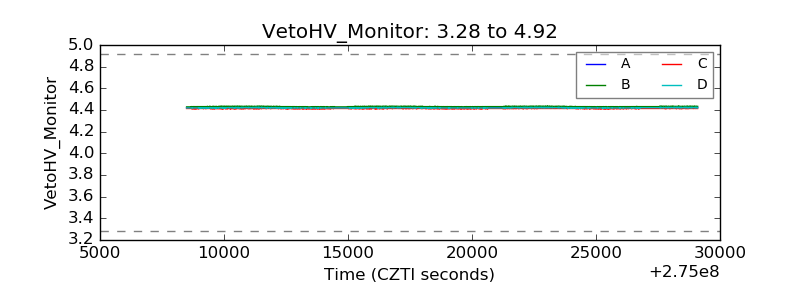 |
| Veto LLD | 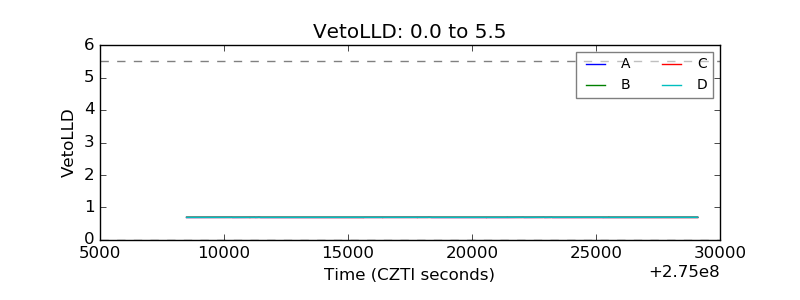 |
| Alpha Counter | 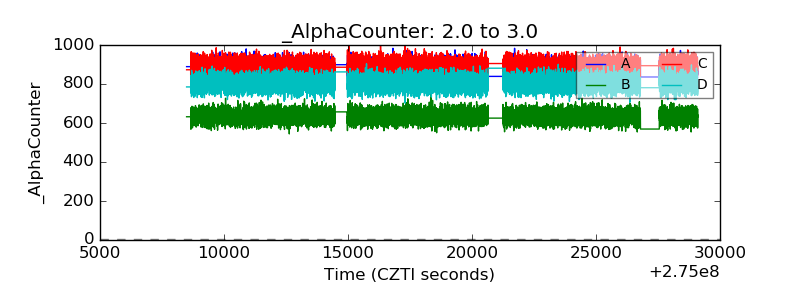 |
| _CPM_Rate | 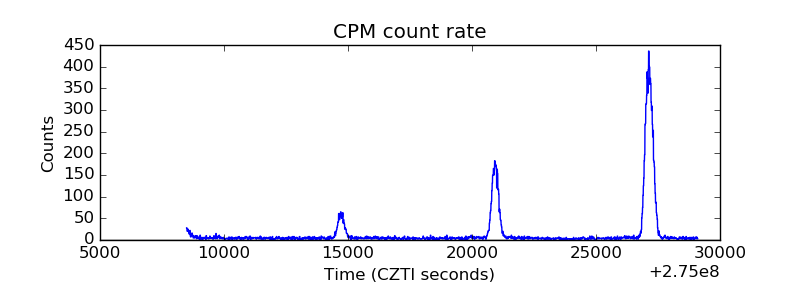 |
| CZT Counter | 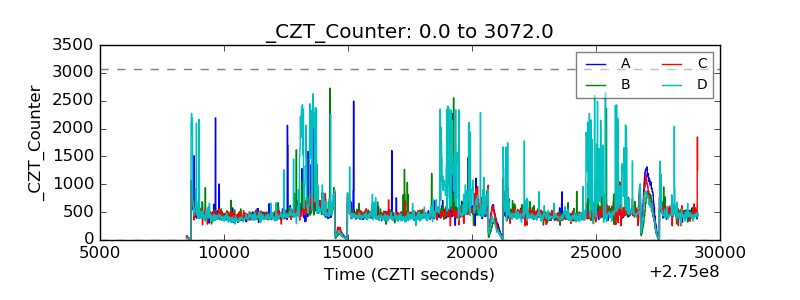 |
| +2.5 Volts monitor |  |
| +5 Volts monitor | 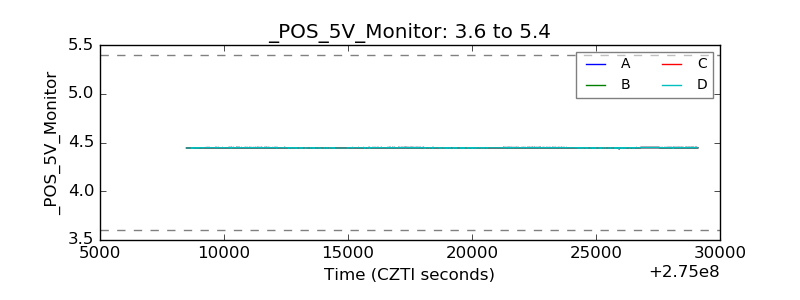 |
| _ROLL_ROT | 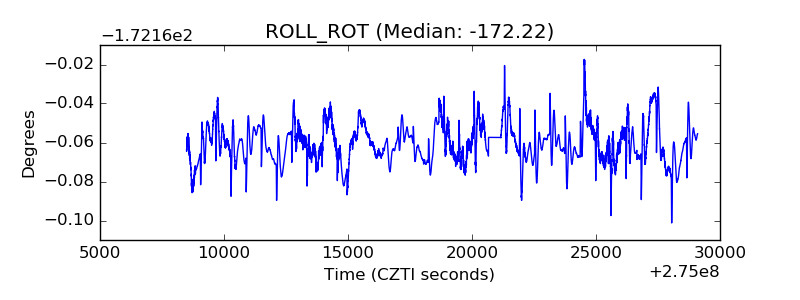 |
| _Roll_DEC | 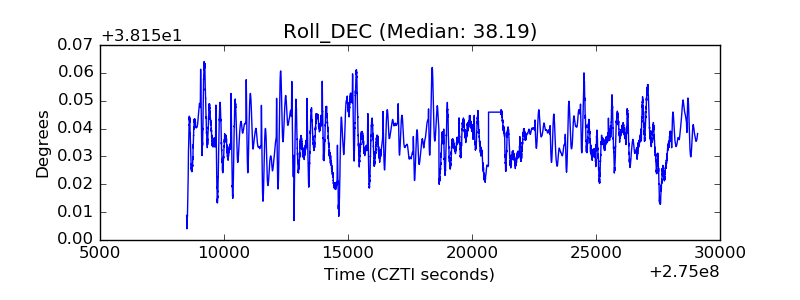 |
| _Roll_RA | 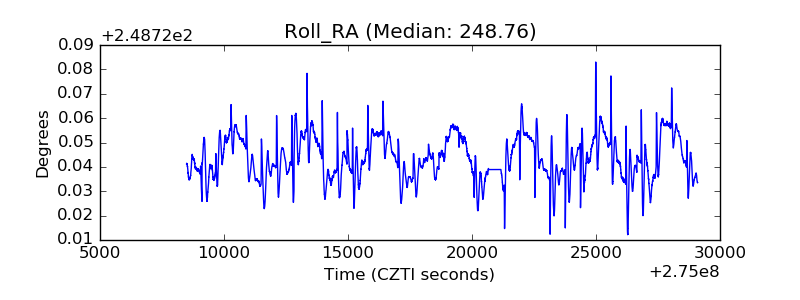 |
| Veto Counter | 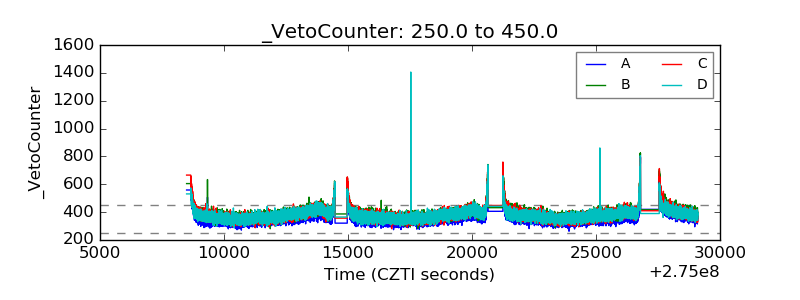 |