| Param | Original file | Final file |
|---|---|---|
| Filename | modeM0/AS1T02_110T01_9000002376_16090cztM0_level2.evt | modeM0/AS1T02_110T01_9000002376_16090cztM0_level2_quad_clean.evt |
| Size (bytes) | 509,996,160 | 79,816,320 |
| Size | 486.4 MB | 76.1 MB |
| Events in quadrant A | 3,451,679 | 506,207 |
| Events in quadrant B | 3,439,780 | 506,769 |
| Events in quadrant C | 3,590,572 | 482,917 |
| Events in quadrant D | 4,505,000 | 450,339 |
| Mode SS | |||
|---|---|---|---|
| Quadrant | BADHDUFLAG | Total packets | Discarded packets |
| A | 0 | 138 | 0 |
| B | 0 | 138 | 0 |
| C | 0 | 138 | 0 |
| D | 0 | 138 | 0 |
| Mode M9 | |||
|---|---|---|---|
| Quadrant | BADHDUFLAG | Total packets | Discarded packets |
| A | 0 | 11 | 0 |
| B | 0 | 11 | 0 |
| C | 0 | 11 | 0 |
| D | 0 | 12 | 0 |
| Mode M0 | |||
|---|---|---|---|
| Quadrant | BADHDUFLAG | Total packets | Discarded packets |
| A | 0 | 14605 | 3 |
| B | 0 | 14340 | 2 |
| C | 0 | 14767 | 2 |
| D | 0 | 17963 | 2 |
| Quadrant | Total seconds | Saturated seconds | Saturation percentage |
|---|---|---|---|
| A | 6746 | 124 | 1.838126% |
| B | 6746 | 72 | 1.067299% |
| C | 6746 | 77 | 1.141417% |
| D | 6746 | 492 | 7.293211% |
Noise dominated data is calculated using 1-second bins in cleaned event files. If a bin has >2000 counts, and if more than 50% of those come from <1% of pixels, then it is considered to be noise-dominated and hence unusable.
| Quadrant | # 1 sec bins | Bins with >0 counts | Bins with >2000 counts | High rate bins dominated by noise | Noise dominated (total time) | Noise dominated (detector-on time) | Marked lightcurve |
|---|---|---|---|---|---|---|---|
| A | 7687 | 6747 | 67 | 67 | 0.87% | 0.99% | 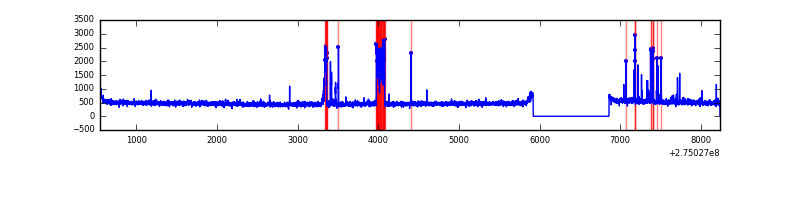 |
| B | 7687 | 6747 | 6 | 6 | 0.08% | 0.09% | 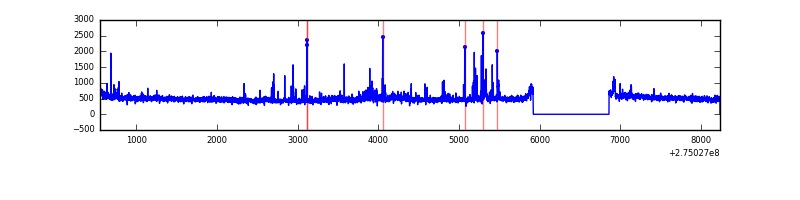 |
| C | 7687 | 6747 | 0 | 0 | 0.00% | 0.00% | 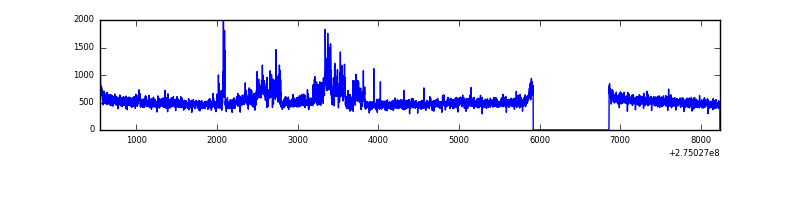 |
| D | 7687 | 6747 | 456 | 456 | 5.93% | 6.76% |  |
Top three noisy pixels from each quadrant. If the there are fewer than three noisy pixels in the level2.evt file, extra rows are filled as -1
| Pixel properties | Quadrant properties | ||||||
|---|---|---|---|---|---|---|---|
| Quadrant | DetID | PixID | Counts | Sigma | Mean | Median | Sigma |
| A | 15 | 239 | 215347 | 1293.14 | 818 | 802 | 165.9 |
| A | 9 | 143 | 56767 | 337.32 | 818 | 802 | 165.9 |
| A | 12 | 96 | 19728 | 114.07 | 818 | 802 | 165.9 |
| B | 0 | 189 | 85017 | 534.92 | 820 | 797 | 157.4 |
| B | 7 | 220 | 29355 | 181.38 | 820 | 797 | 157.4 |
| B | 4 | 173 | 24943 | 153.36 | 820 | 797 | 157.4 |
| C | 3 | 233 | 408130 | 2234.05 | 781 | 784 | 182.3 |
| C | 14 | 238 | 120728 | 657.82 | 781 | 784 | 182.3 |
| C | 0 | 207 | 10592 | 53.79 | 781 | 784 | 182.3 |
| D | 7 | 38 | 1293080 | 6866.82 | 768 | 743 | 188.2 |
| D | 1 | 52 | 123832 | 654.03 | 768 | 743 | 188.2 |
| D | 12 | 218 | 122739 | 648.22 | 768 | 743 | 188.2 |
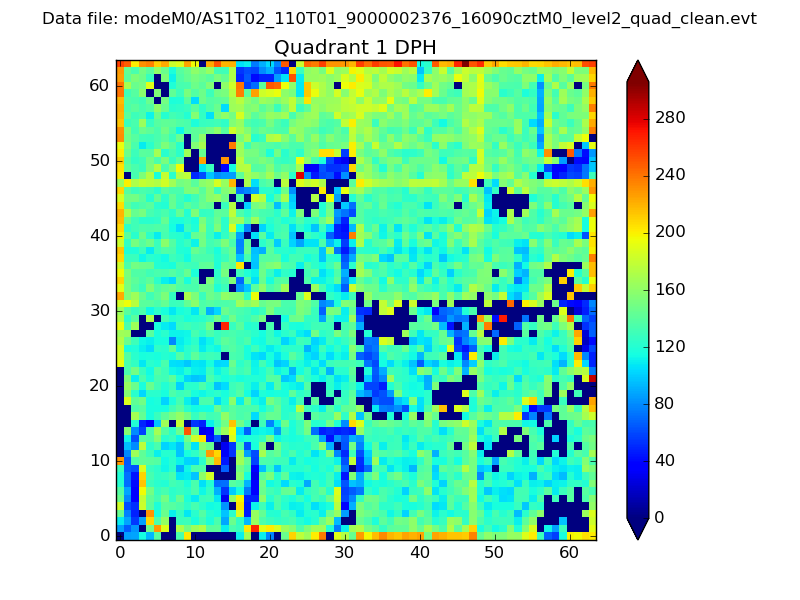
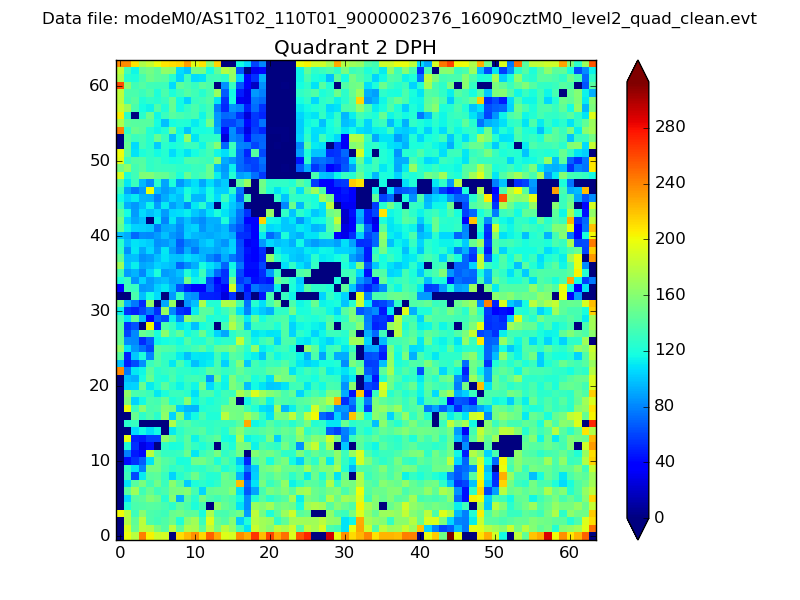
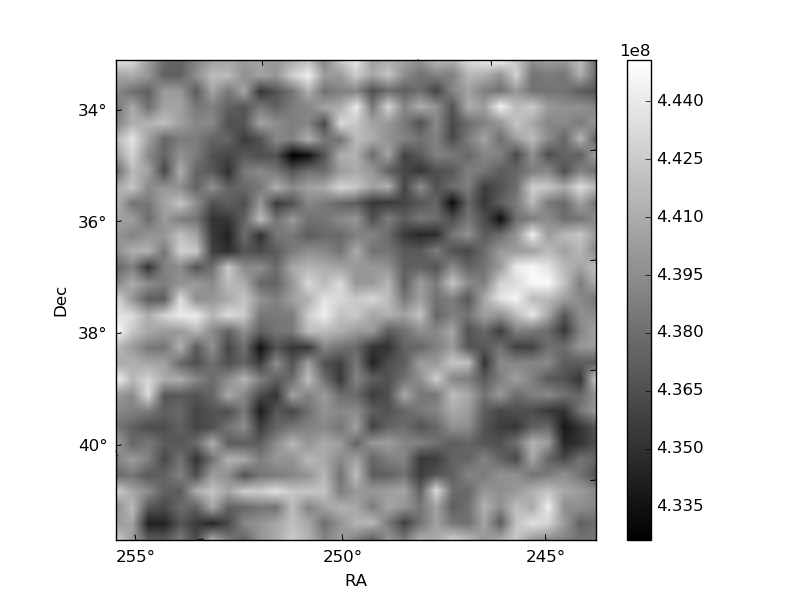
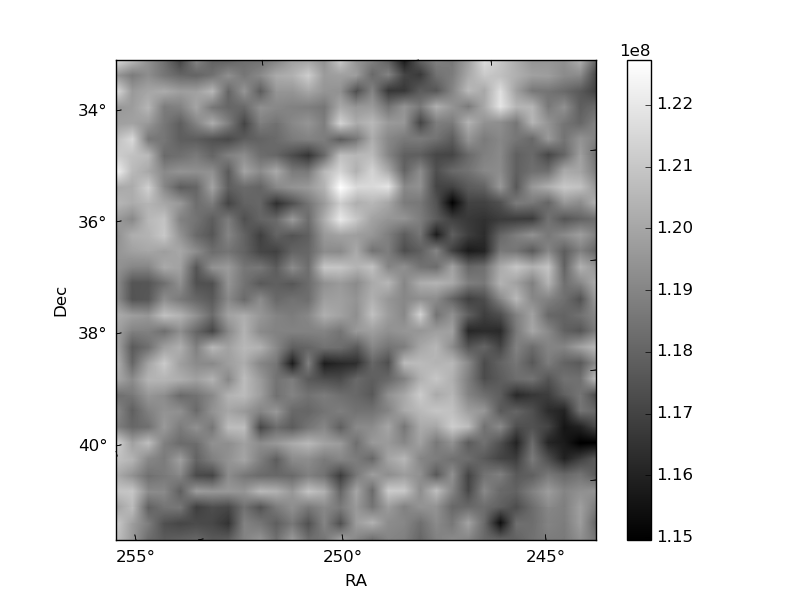
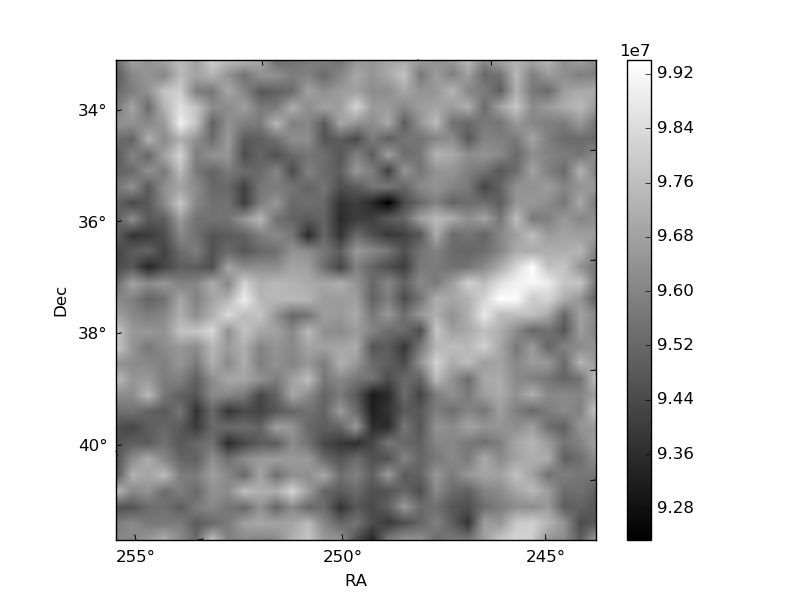
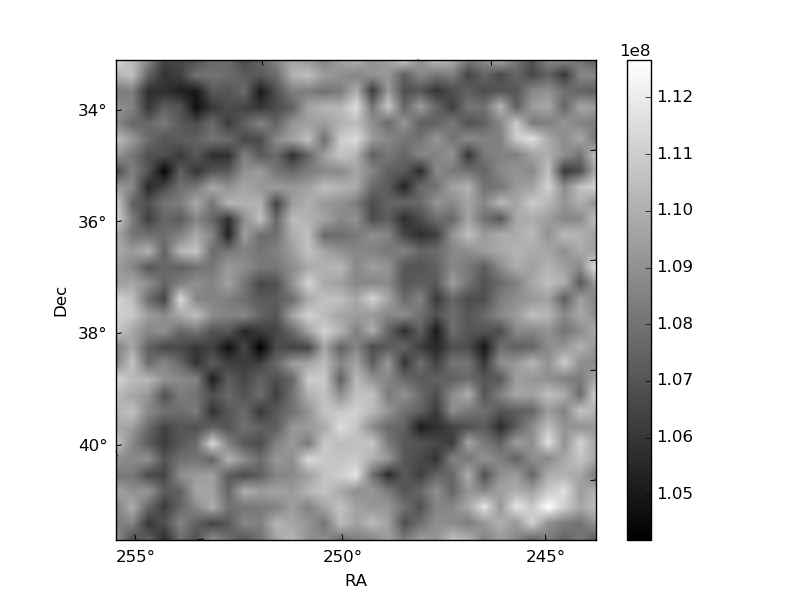
Histogram calculated using DETX and DETY for each event in the final _common_clean file
| Quadrant A | 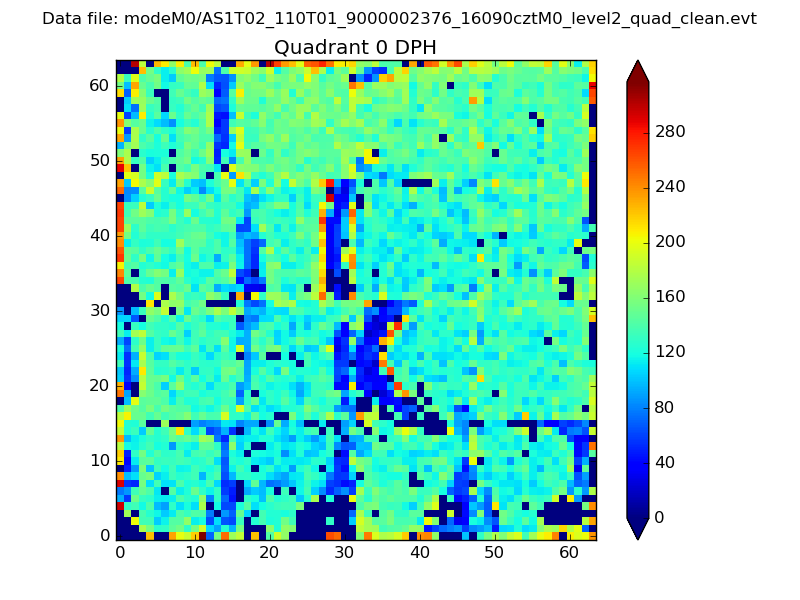 |
 |
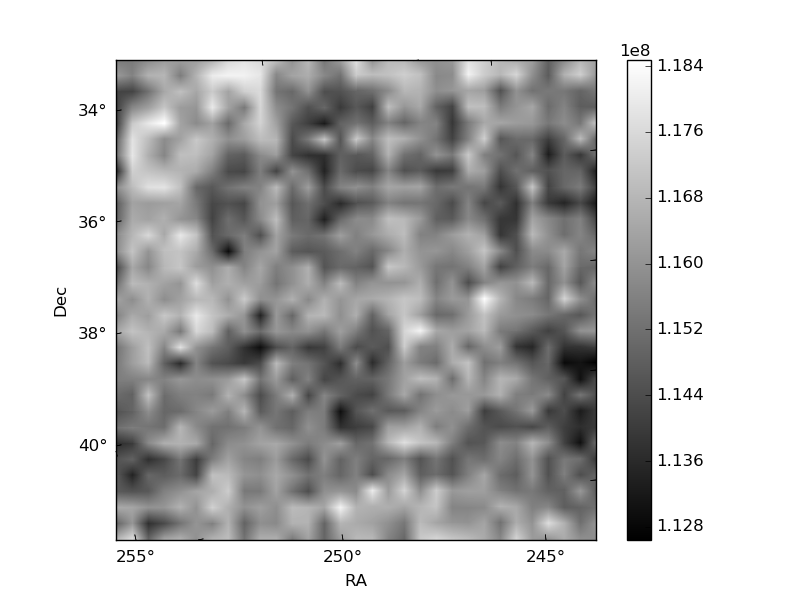
Quadrant B |
|---|---|---|---|
| Quadrant D | 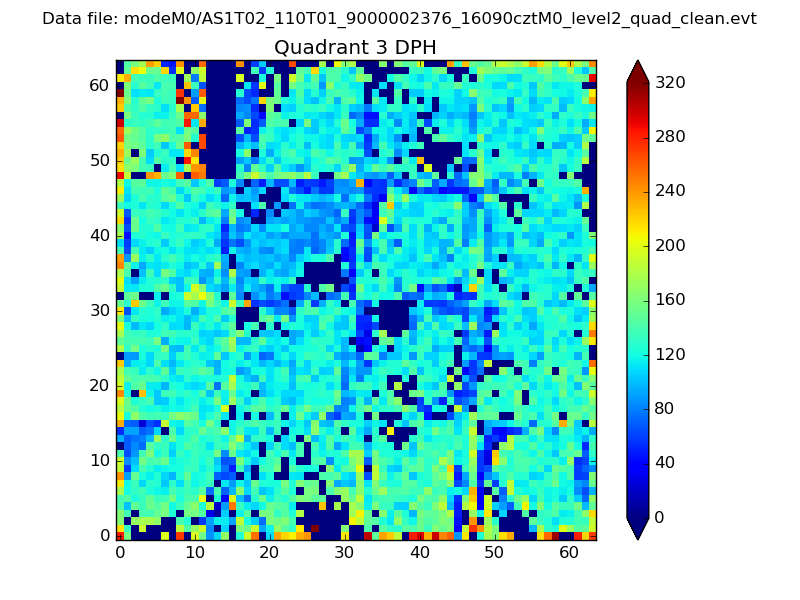 |
 |
Quadrant C |
| Plot type | Count rate plots | Images |
|---|---|---|
| Comparison with Poisson distribution Blue bars denote a histogram of data divided into 1 sec bins. Red curve is a Poisson curve with rate = median count rate of data. |
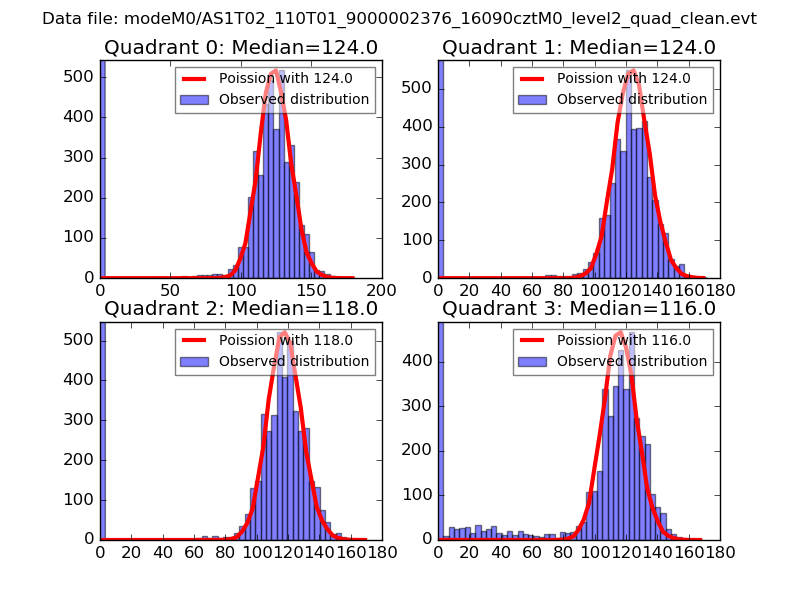 |
 |
| Quadrant-wise count rates Data is divided into 100 sec bins |
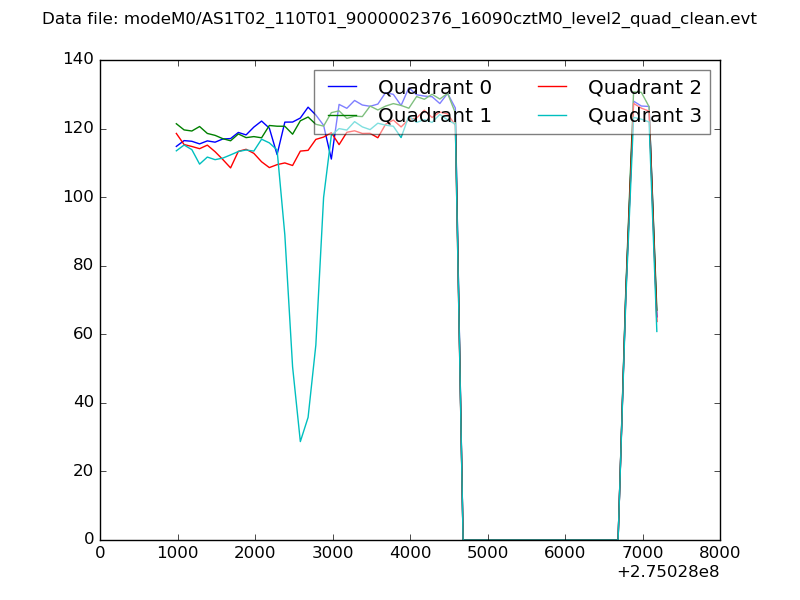 |
|
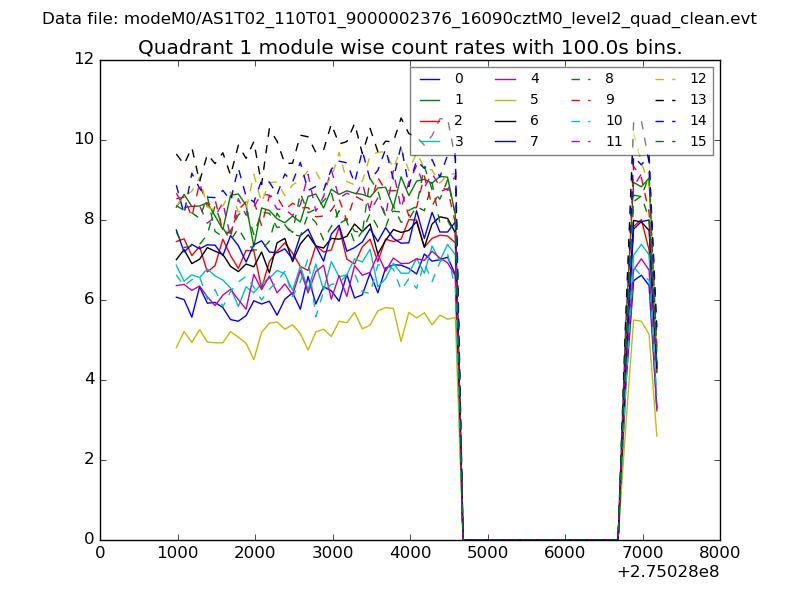
| Module-wise count rates for Quadrant A Data is divided into 100 sec bins |
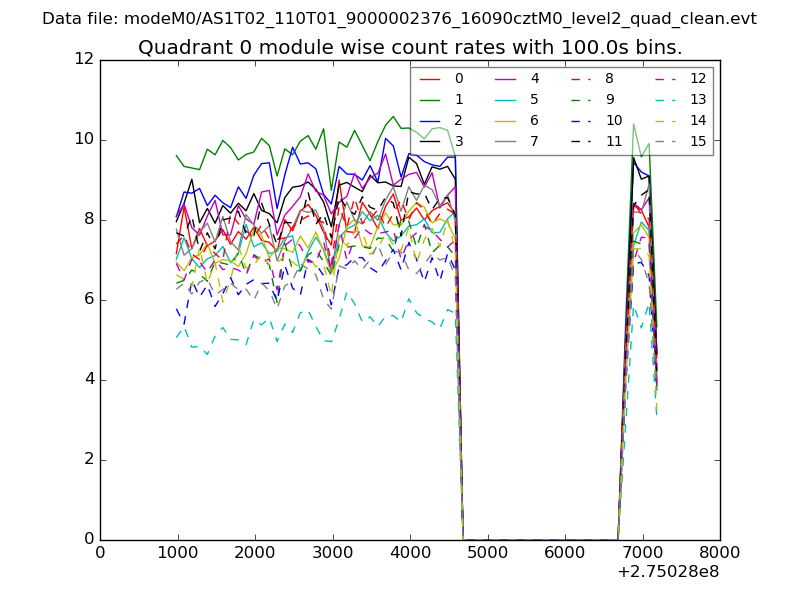 |
 |
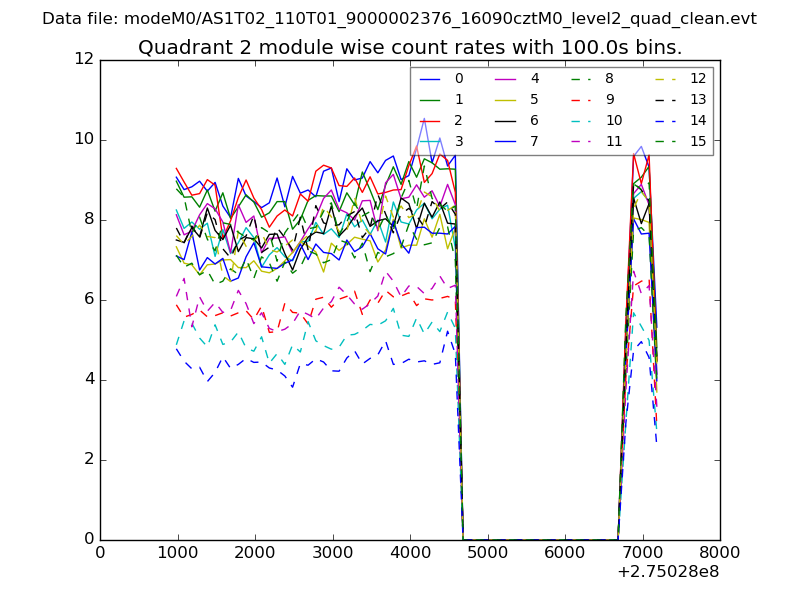
| Module-wise count rates for Quadrant B Data is divided into 100 sec bins |
 |
 |
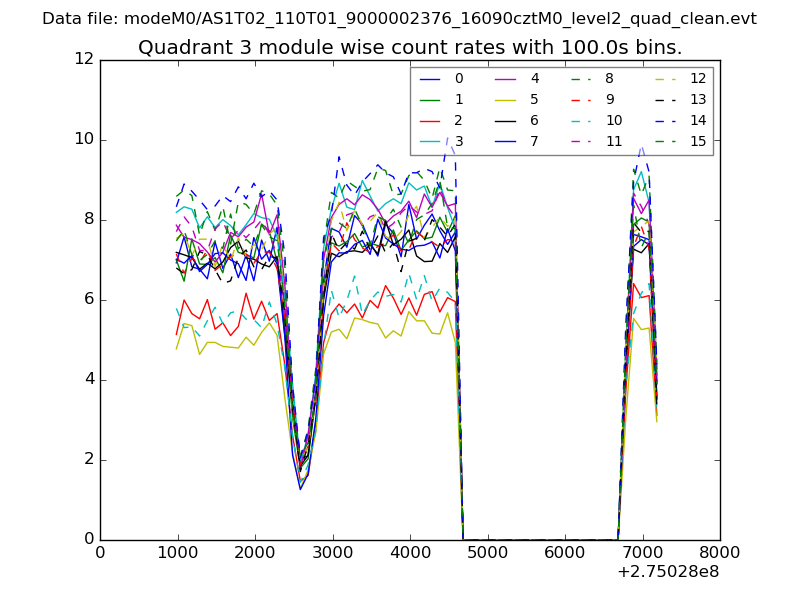
| Module-wise count rates for Quadrant C Data is divided into 100 sec bins |
 |
 |
| Module-wise count rates for Quadrant D Data is divided into 100 sec bins |
 |
 |
| Parameter | Plot |
|---|---|
| CZT HV Monitor | 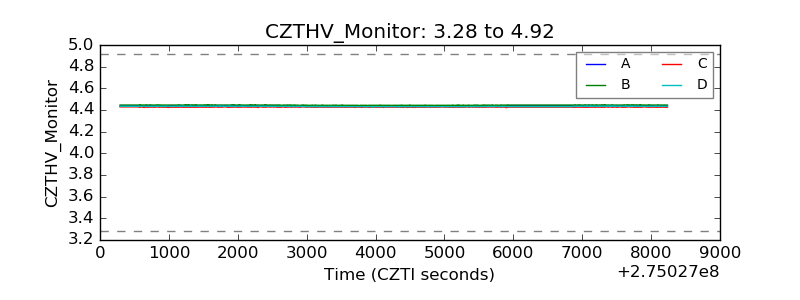 |
| D_VDD | 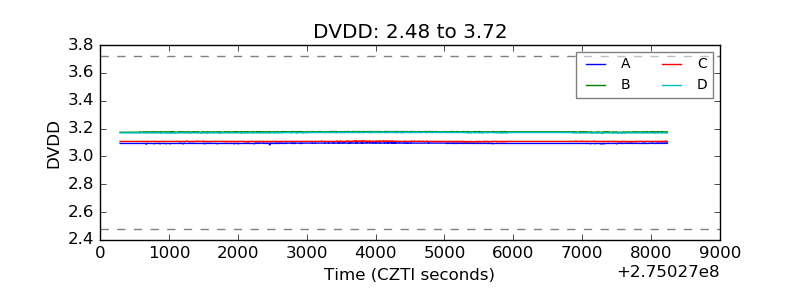 |
| Temperature 1 | 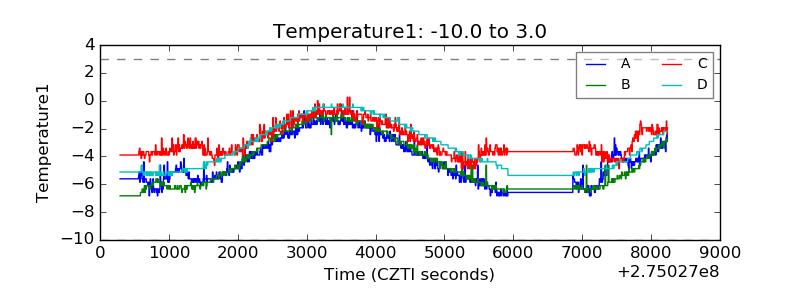 |
| Veto HV Monitor | 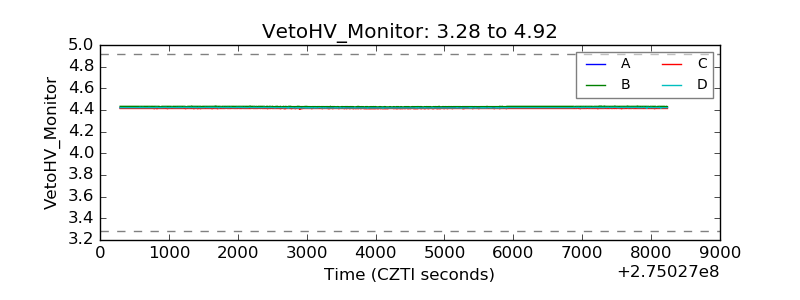 |
| Veto LLD | 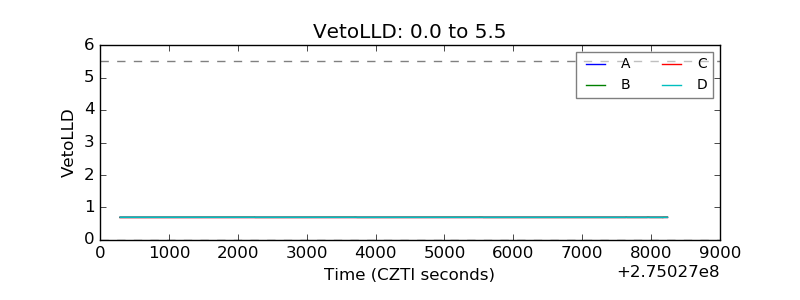 |
| Alpha Counter | 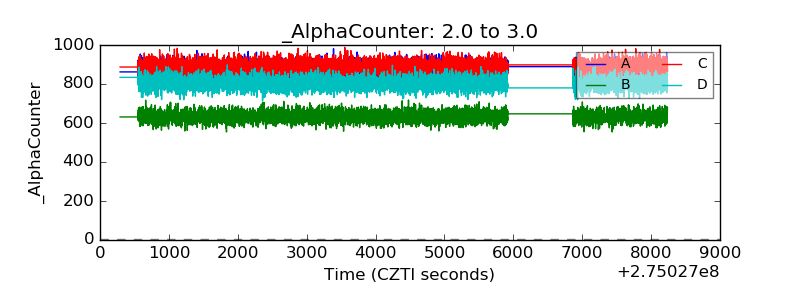 |
| _CPM_Rate | 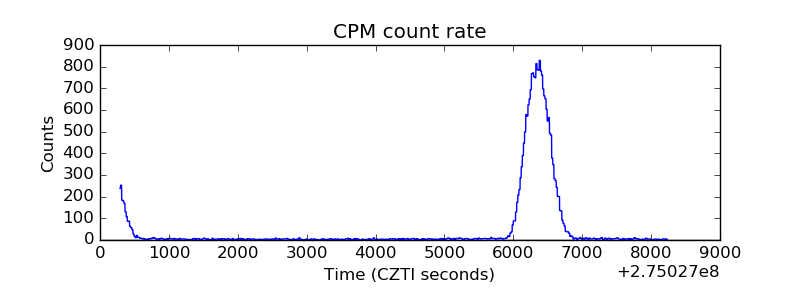 |
| CZT Counter | 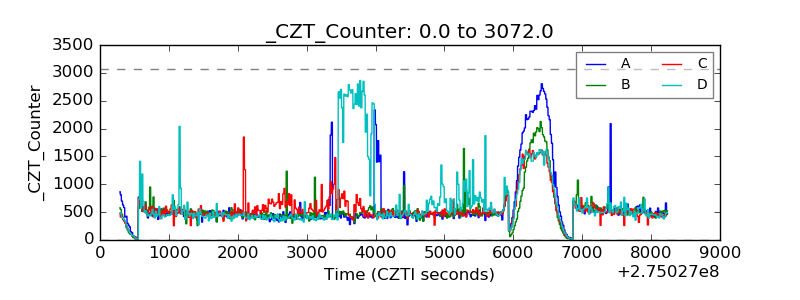 |
| +2.5 Volts monitor | 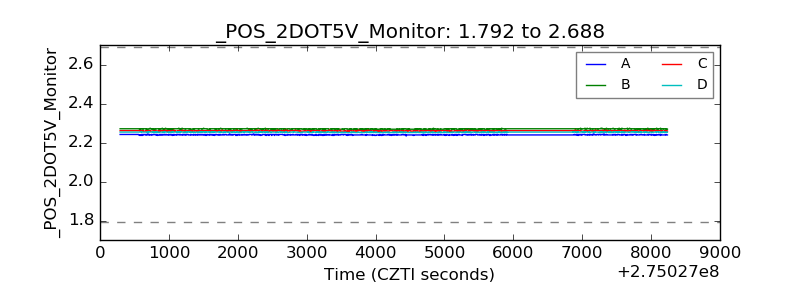 |
| +5 Volts monitor | 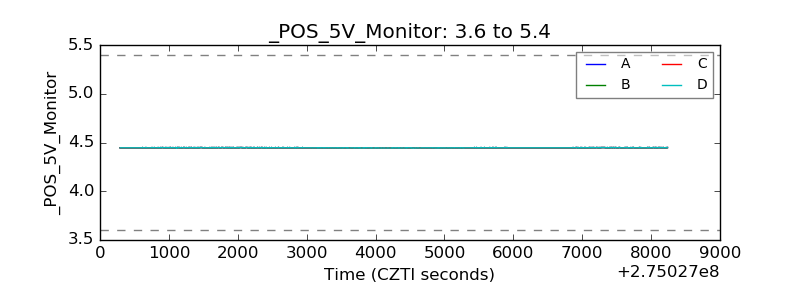 |
| _ROLL_ROT |  |
| _Roll_DEC | 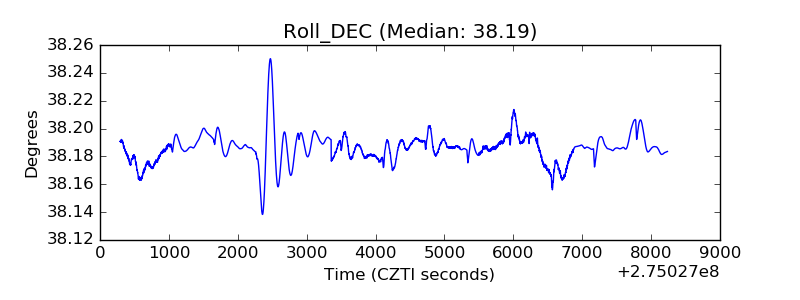 |
| _Roll_RA | 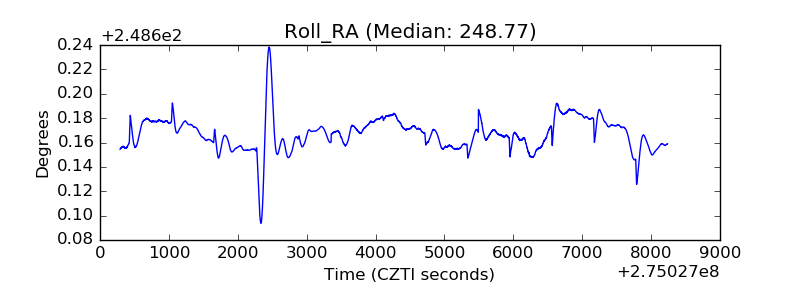 |
| Veto Counter | 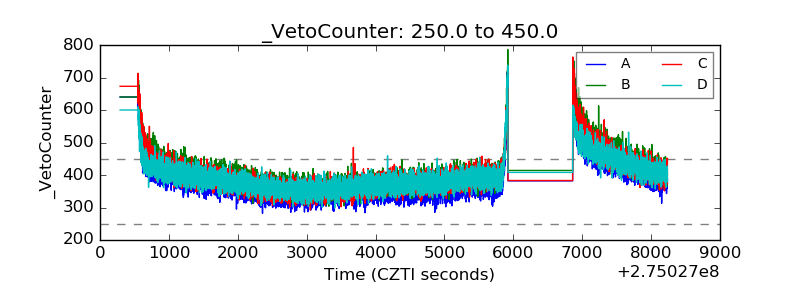 |