| Param | Original file | Final file |
|---|---|---|
| Filename | modeM0/AS1T02_110T01_9000002376_16092cztM0_level2.evt | modeM0/AS1T02_110T01_9000002376_16092cztM0_level2_quad_clean.evt |
| Size (bytes) | 491,768,640 | 88,784,640 |
| Size | 469.0 MB | 84.7 MB |
| Events in quadrant A | 3,284,316 | 582,490 |
| Events in quadrant B | 3,651,672 | 576,880 |
| Events in quadrant C | 3,191,719 | 550,510 |
| Events in quadrant D | 4,321,289 | 522,298 |
| Mode SS | |||
|---|---|---|---|
| Quadrant | BADHDUFLAG | Total packets | Discarded packets |
| A | 0 | 132 | 0 |
| B | 0 | 132 | 0 |
| C | 0 | 132 | 0 |
| D | 0 | 132 | 0 |
| Mode M9 | |||
|---|---|---|---|
| Quadrant | BADHDUFLAG | Total packets | Discarded packets |
| A | 0 | 11 | 0 |
| B | 0 | 11 | 0 |
| C | 0 | 11 | 0 |
| D | 0 | 11 | 0 |
| Mode M0 | |||
|---|---|---|---|
| Quadrant | BADHDUFLAG | Total packets | Discarded packets |
| A | 0 | 13956 | 3 |
| B | 0 | 14903 | 2 |
| C | 0 | 13678 | 2 |
| D | 0 | 17065 | 2 |
| Quadrant | Total seconds | Saturated seconds | Saturation percentage |
|---|---|---|---|
| A | 6546 | 70 | 1.069355% |
| B | 6546 | 101 | 1.542927% |
| C | 6546 | 67 | 1.023526% |
| D | 6547 | 451 | 6.888651% |
Noise dominated data is calculated using 1-second bins in cleaned event files. If a bin has >2000 counts, and if more than 50% of those come from <1% of pixels, then it is considered to be noise-dominated and hence unusable.
| Quadrant | # 1 sec bins | Bins with >0 counts | Bins with >2000 counts | High rate bins dominated by noise | Noise dominated (total time) | Noise dominated (detector-on time) | Marked lightcurve |
|---|---|---|---|---|---|---|---|
| A | 7617 | 6547 | 19 | 19 | 0.25% | 0.29% |  |
| B | 7617 | 6547 | 37 | 37 | 0.49% | 0.57% | 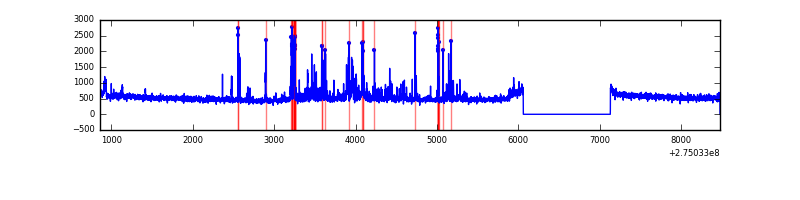 |
| C | 7617 | 6547 | 0 | 0 | 0.00% | 0.00% | 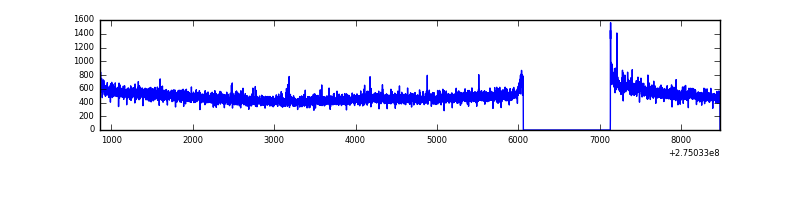 |
| D | 7618 | 6548 | 380 | 380 | 4.99% | 5.80% | 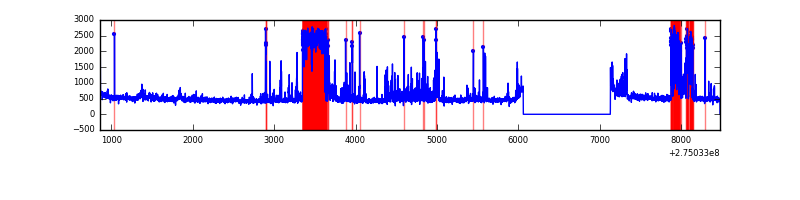 |
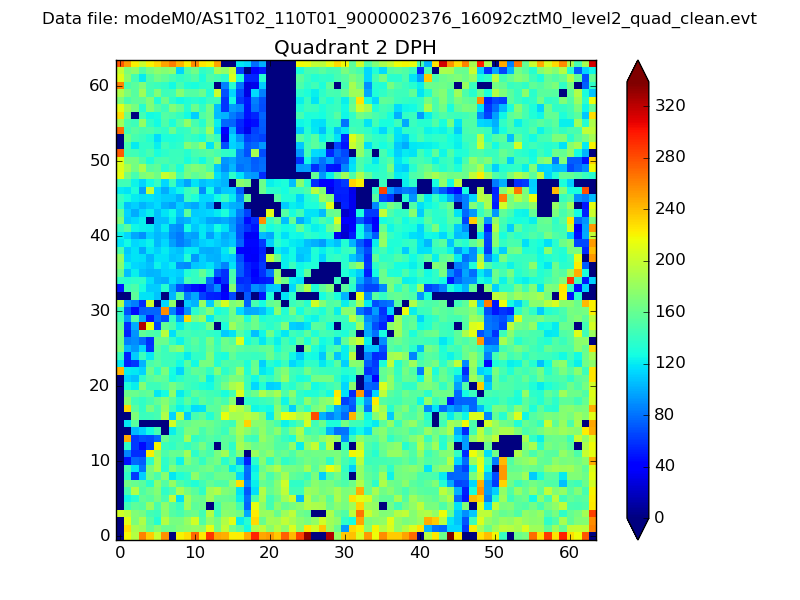
Top three noisy pixels from each quadrant. If the there are fewer than three noisy pixels in the level2.evt file, extra rows are filled as -1
| Pixel properties | Quadrant properties | ||||||
|---|---|---|---|---|---|---|---|
| Quadrant | DetID | PixID | Counts | Sigma | Mean | Median | Sigma |
| A | 9 | 143 | 98193 | 596.44 | 820 | 803 | 163.3 |
| A | 12 | 96 | 25603 | 151.88 | 820 | 803 | 163.3 |
| A | 0 | 226 | 7415 | 40.49 | 820 | 803 | 163.3 |
| B | 0 | 189 | 156397 | 1002.08 | 813 | 793 | 155.3 |
| B | 7 | 220 | 135626 | 868.32 | 813 | 793 | 155.3 |
| B | 0 | 245 | 38143 | 240.53 | 813 | 793 | 155.3 |
| C | 14 | 238 | 120820 | 665.67 | 772 | 777 | 180.3 |
| C | 3 | 233 | 45116 | 245.87 | 772 | 777 | 180.3 |
| C | 0 | 207 | 9319 | 47.37 | 772 | 777 | 180.3 |
| D | 7 | 38 | 771142 | 4107.81 | 771 | 750 | 187.5 |
| D | 12 | 218 | 320770 | 1706.38 | 771 | 750 | 187.5 |
| D | 1 | 52 | 91320 | 482.93 | 771 | 750 | 187.5 |
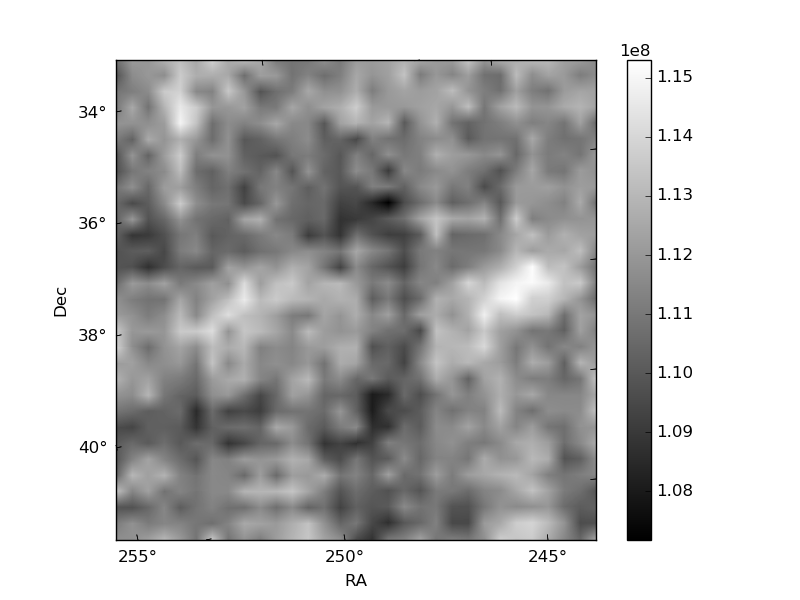
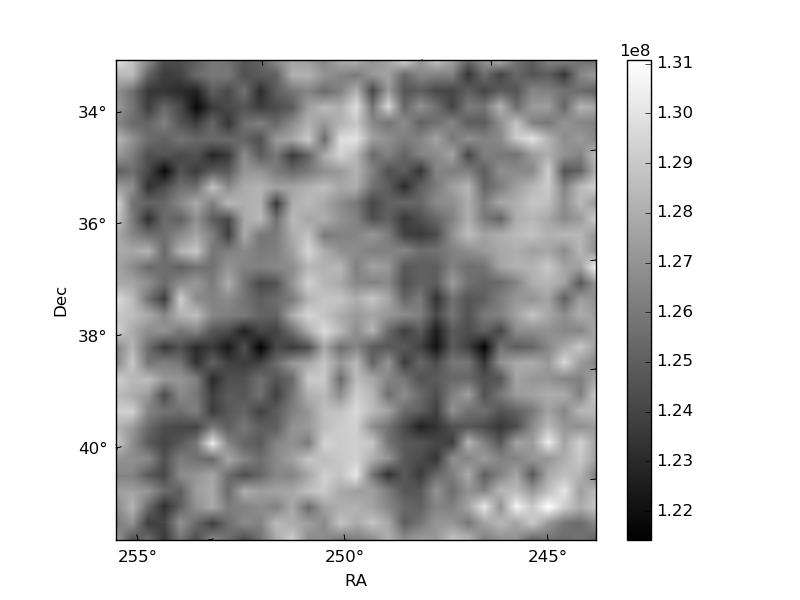
Histogram calculated using DETX and DETY for each event in the final _common_clean file
| Quadrant A |  |
 |
Quadrant B |
|---|---|---|---|
| Quadrant D |  |
 |
Quadrant C |
| Plot type | Count rate plots | Images |
|---|---|---|
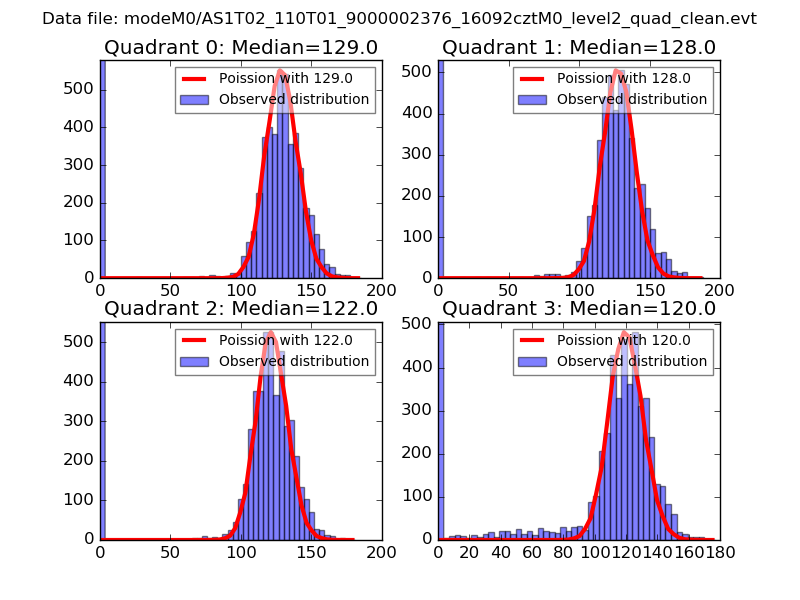
| Comparison with Poisson distribution Blue bars denote a histogram of data divided into 1 sec bins. Red curve is a Poisson curve with rate = median count rate of data. |
 |
 |
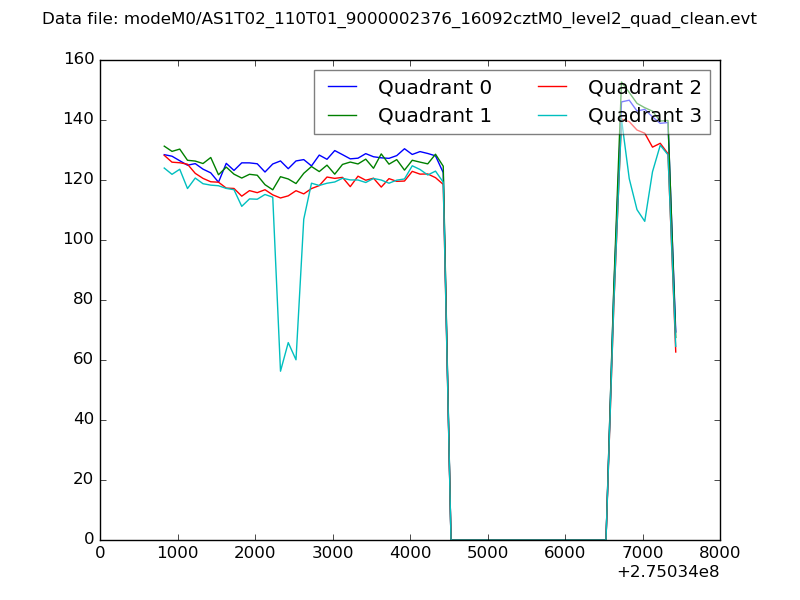
| Quadrant-wise count rates Data is divided into 100 sec bins |
 |
|
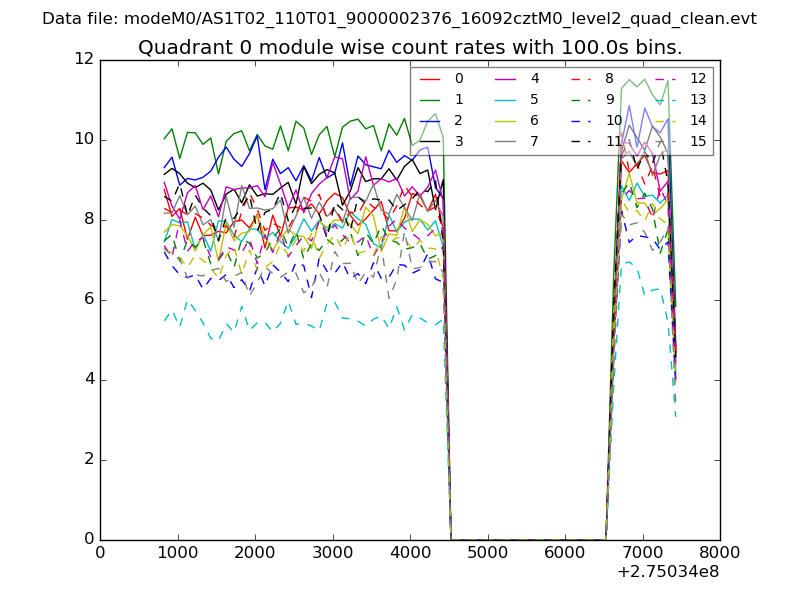
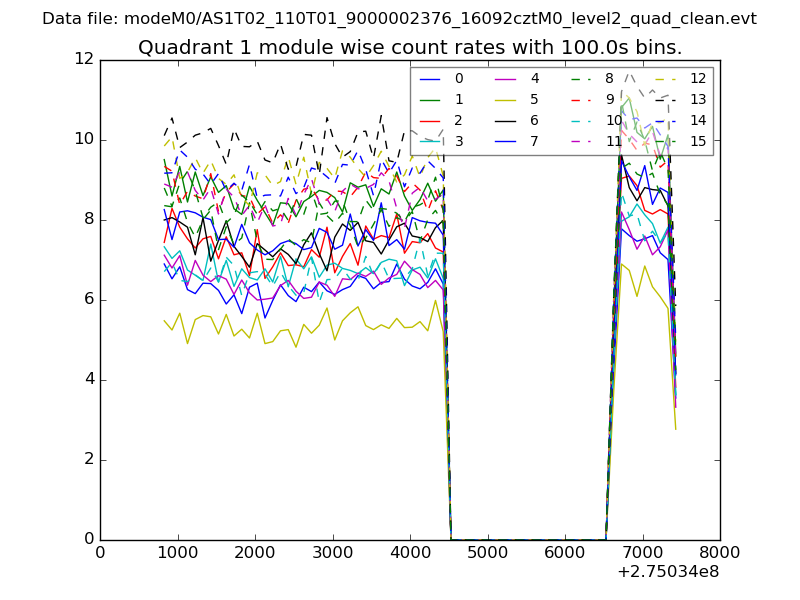
| Module-wise count rates for Quadrant A Data is divided into 100 sec bins |
 |
 |
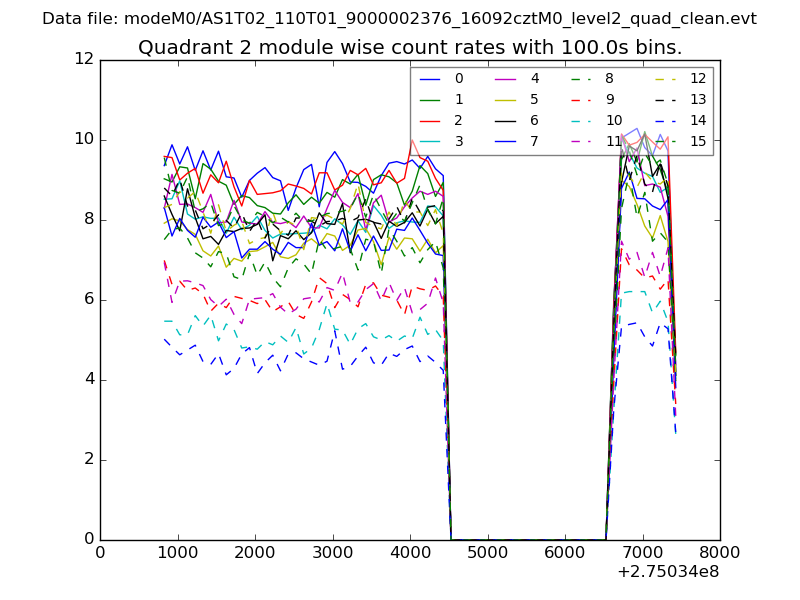
| Module-wise count rates for Quadrant B Data is divided into 100 sec bins |
 |
 |
| Module-wise count rates for Quadrant C Data is divided into 100 sec bins |
 |
 |
| Module-wise count rates for Quadrant D Data is divided into 100 sec bins |
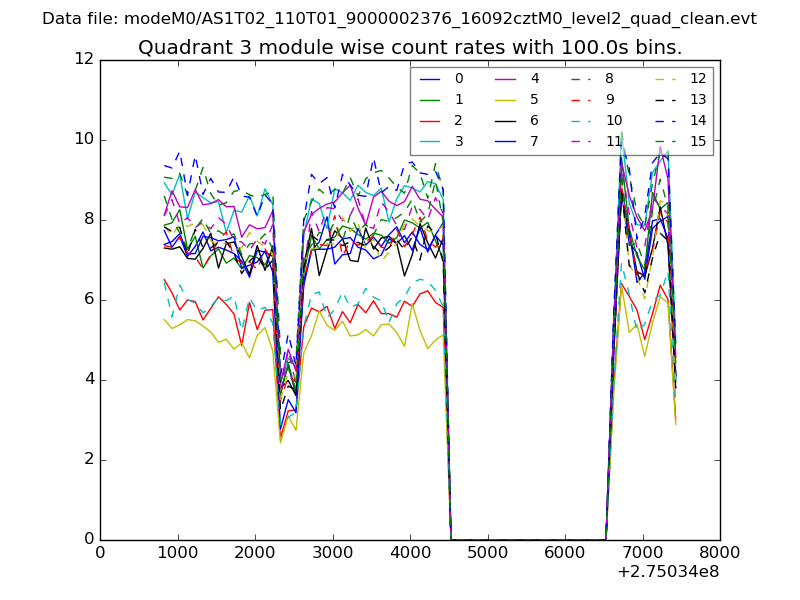 |
 |
| Parameter | Plot |
|---|---|
| CZT HV Monitor | 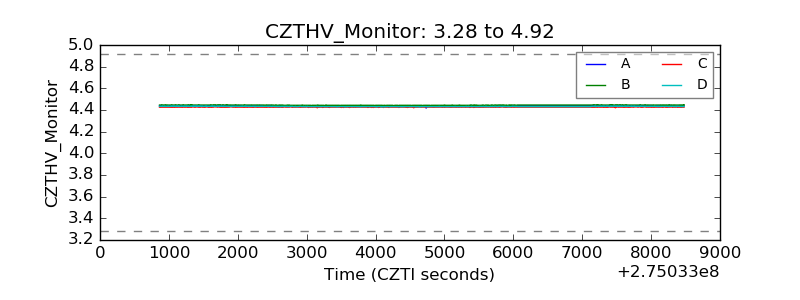 |
| D_VDD | 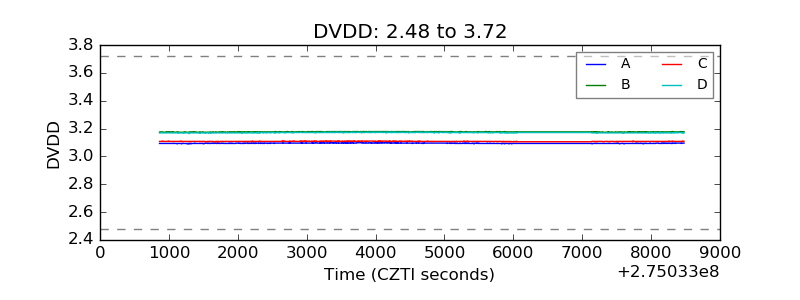 |
| Temperature 1 | 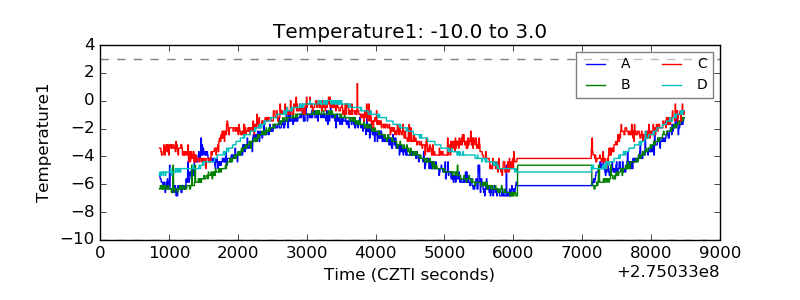 |
| Veto HV Monitor | 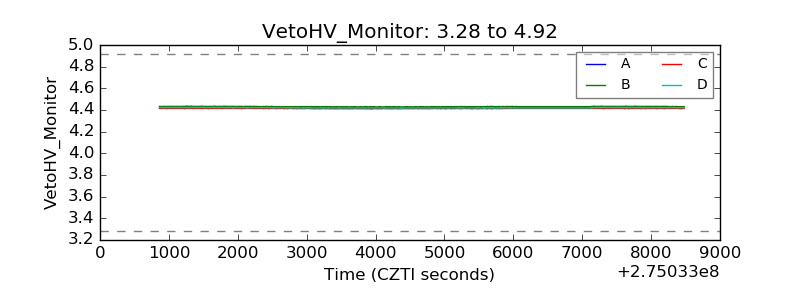 |
| Veto LLD |  |
| Alpha Counter |  |
| _CPM_Rate |  |
| CZT Counter | 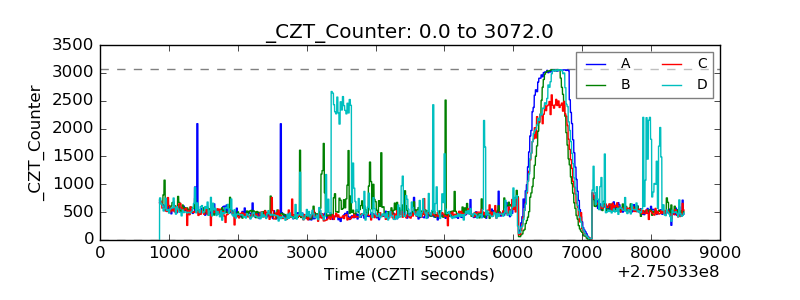 |
| +2.5 Volts monitor |  |
| +5 Volts monitor | 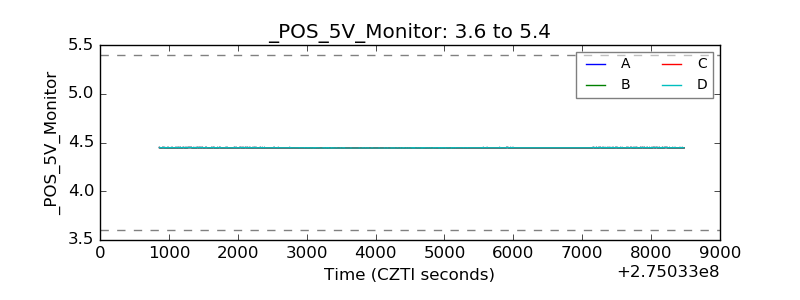 |
| _ROLL_ROT | 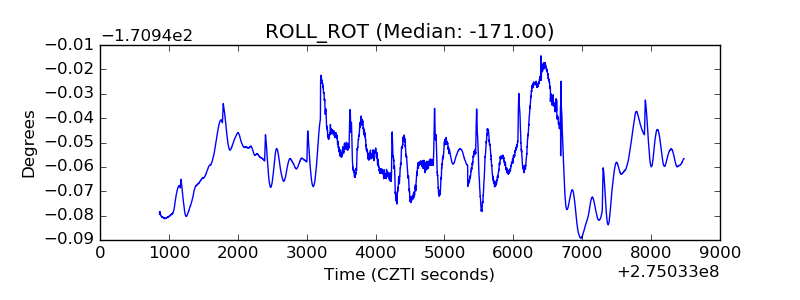 |
| _Roll_DEC | 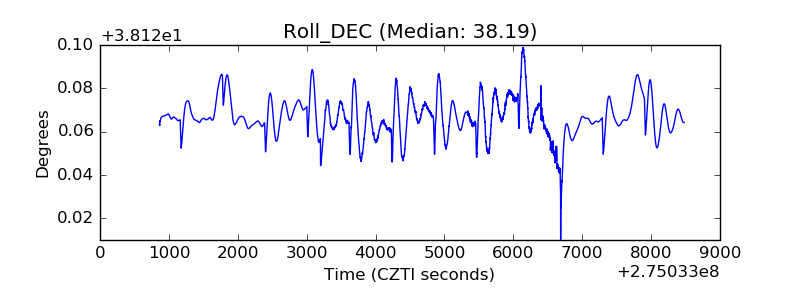 |
| _Roll_RA | 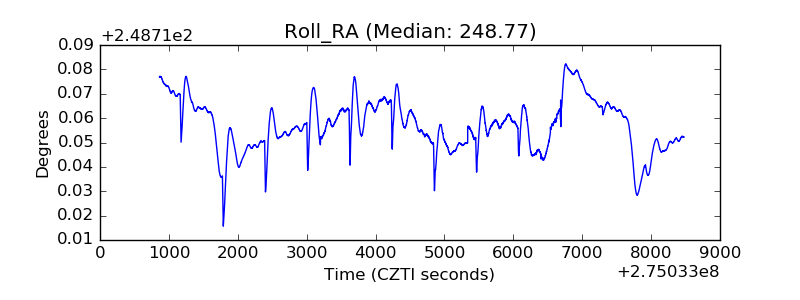 |
| Veto Counter | 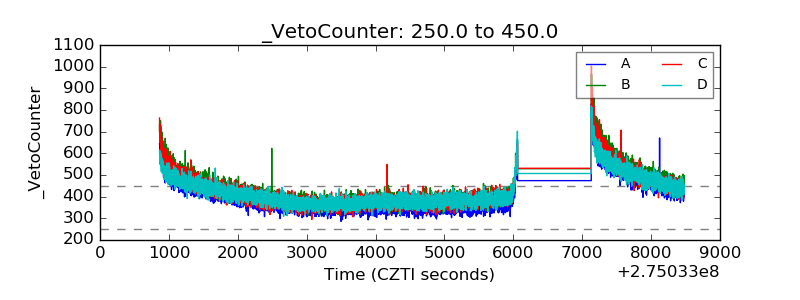 |