| Param | Original file | Final file |
|---|---|---|
| Filename | modeM0/AS1T02_110T01_9000002376_16094cztM0_level2.evt | modeM0/AS1T02_110T01_9000002376_16094cztM0_level2_quad_clean.evt |
| Size (bytes) | 459,812,160 | 109,681,920 |
| Size | 438.5 MB | 104.6 MB |
| Events in quadrant A | 3,228,830 | 753,517 |
| Events in quadrant B | 3,557,971 | 744,493 |
| Events in quadrant C | 3,429,090 | 689,264 |
| Events in quadrant D | 3,285,245 | 698,680 |
| Mode SS | |||
|---|---|---|---|
| Quadrant | BADHDUFLAG | Total packets | Discarded packets |
| A | 0 | 126 | 0 |
| B | 0 | 126 | 0 |
| C | 0 | 126 | 0 |
| D | 0 | 126 | 0 |
| Mode M9 | |||
|---|---|---|---|
| Quadrant | BADHDUFLAG | Total packets | Discarded packets |
| A | 0 | 17 | 0 |
| B | 0 | 17 | 0 |
| C | 0 | 17 | 0 |
| D | 0 | 18 | 0 |
| Mode M0 | |||
|---|---|---|---|
| Quadrant | BADHDUFLAG | Total packets | Discarded packets |
| A | 0 | 13611 | 3 |
| B | 0 | 14387 | 2 |
| C | 0 | 14091 | 2 |
| D | 0 | 13818 | 2 |
| Quadrant | Total seconds | Saturated seconds | Saturation percentage |
|---|---|---|---|
| A | 6250 | 71 | 1.136000% |
| B | 6250 | 75 | 1.200000% |
| C | 6250 | 125 | 2.000000% |
| D | 6250 | 67 | 1.072000% |
Noise dominated data is calculated using 1-second bins in cleaned event files. If a bin has >2000 counts, and if more than 50% of those come from <1% of pixels, then it is considered to be noise-dominated and hence unusable.
| Quadrant | # 1 sec bins | Bins with >0 counts | Bins with >2000 counts | High rate bins dominated by noise | Noise dominated (total time) | Noise dominated (detector-on time) | Marked lightcurve |
|---|---|---|---|---|---|---|---|
| A | 7511 | 6251 | 0 | 0 | 0.00% | 0.00% | 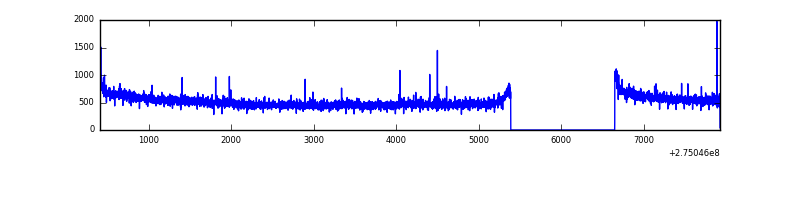 |
| B | 7511 | 6252 | 6 | 6 | 0.08% | 0.10% | 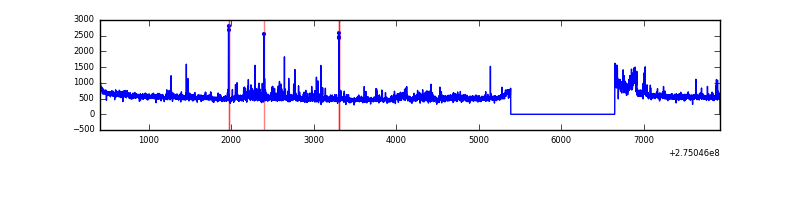 |
| C | 7511 | 6251 | 41 | 41 | 0.55% | 0.66% | 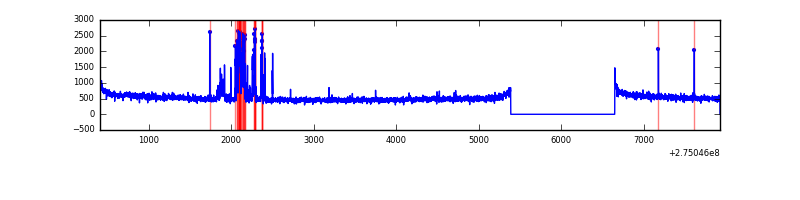 |
| D | 7511 | 6251 | 26 | 26 | 0.35% | 0.42% | 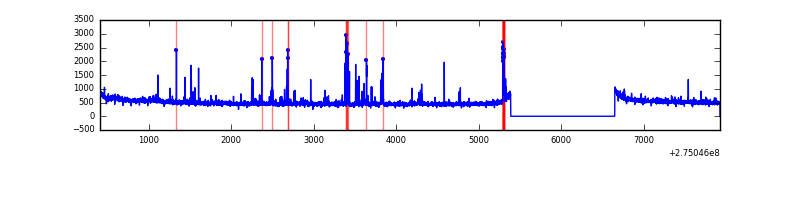 |
Top three noisy pixels from each quadrant. If the there are fewer than three noisy pixels in the level2.evt file, extra rows are filled as -1
| Pixel properties | Quadrant properties | ||||||
|---|---|---|---|---|---|---|---|
| Quadrant | DetID | PixID | Counts | Sigma | Mean | Median | Sigma |
| A | 12 | 96 | 17262 | 98.28 | 832 | 817 | 167.3 |
| A | 9 | 143 | 12075 | 67.28 | 832 | 817 | 167.3 |
| A | 0 | 226 | 7615 | 40.63 | 832 | 817 | 167.3 |
| B | 0 | 189 | 143802 | 936.7 | 816 | 799 | 152.7 |
| B | 7 | 220 | 67417 | 436.36 | 816 | 799 | 152.7 |
| B | 5 | 65 | 52612 | 339.39 | 816 | 799 | 152.7 |
| C | 3 | 233 | 274352 | 1540.08 | 769 | 774 | 177.6 |
| C | 14 | 238 | 120983 | 676.7 | 769 | 774 | 177.6 |
| C | 0 | 207 | 19997 | 108.21 | 769 | 774 | 177.6 |
| D | 15 | 0 | 85839 | 445.16 | 799 | 781 | 191.1 |
| D | 12 | 218 | 44315 | 227.84 | 799 | 781 | 191.1 |
| D | 2 | 152 | 38903 | 199.51 | 799 | 781 | 191.1 |
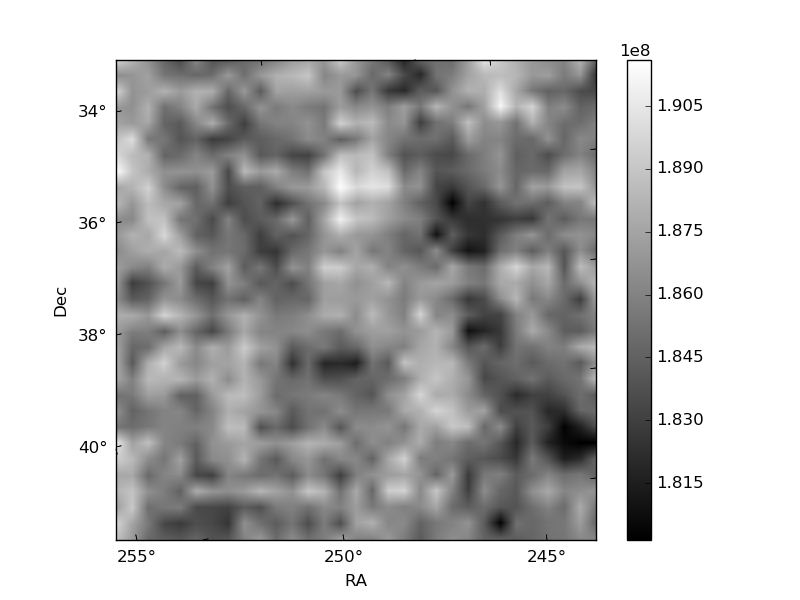
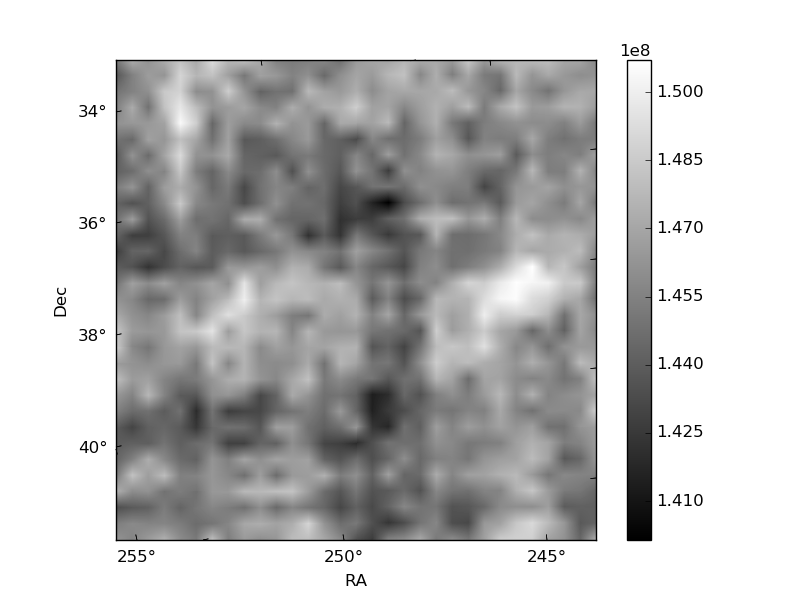
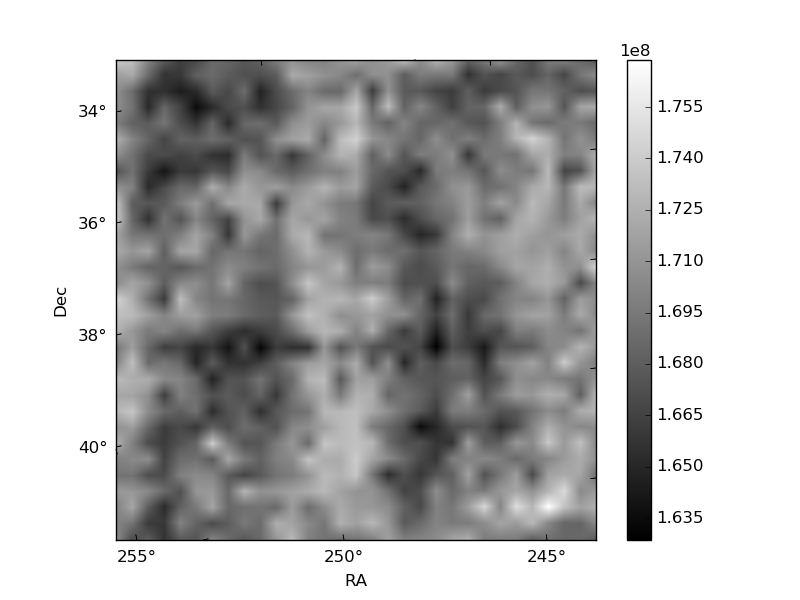
Histogram calculated using DETX and DETY for each event in the final _common_clean file
| Quadrant A | 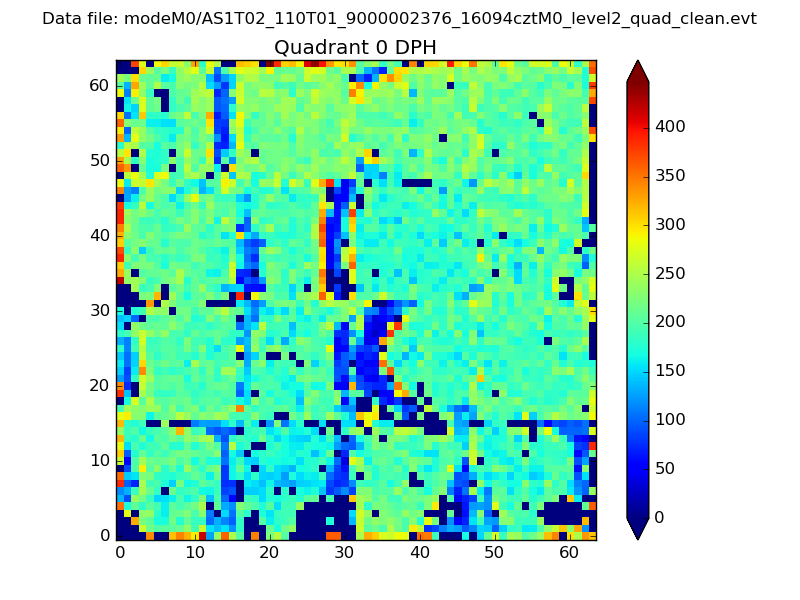 |
 |
Quadrant B |
|---|---|---|---|
| Quadrant D |  |
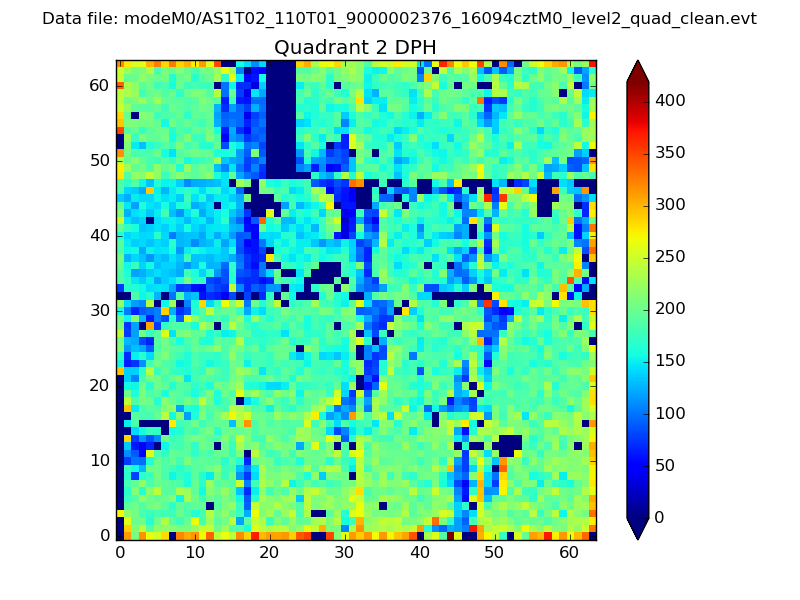 |
Quadrant C |
| Plot type | Count rate plots | Images |
|---|---|---|
| Comparison with Poisson distribution Blue bars denote a histogram of data divided into 1 sec bins. Red curve is a Poisson curve with rate = median count rate of data. |
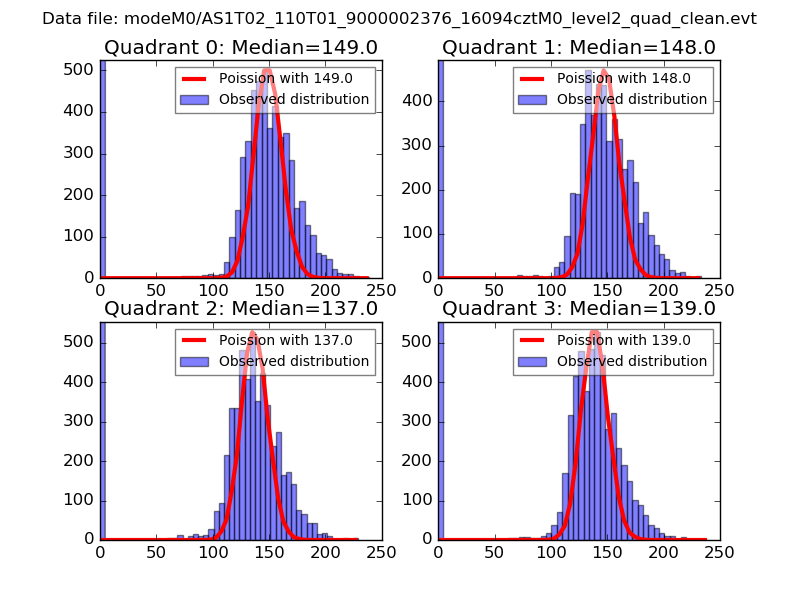 |
 |
| Quadrant-wise count rates Data is divided into 100 sec bins |
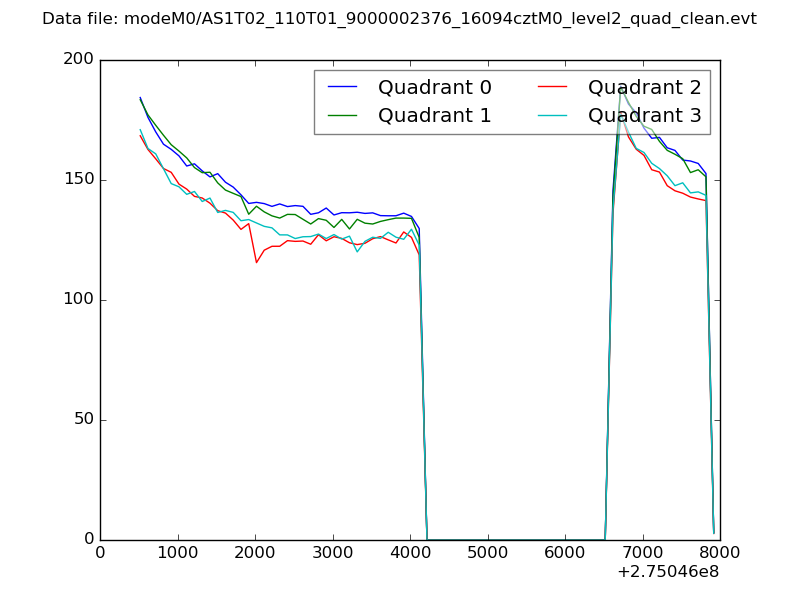 |
|
| Module-wise count rates for Quadrant A Data is divided into 100 sec bins |
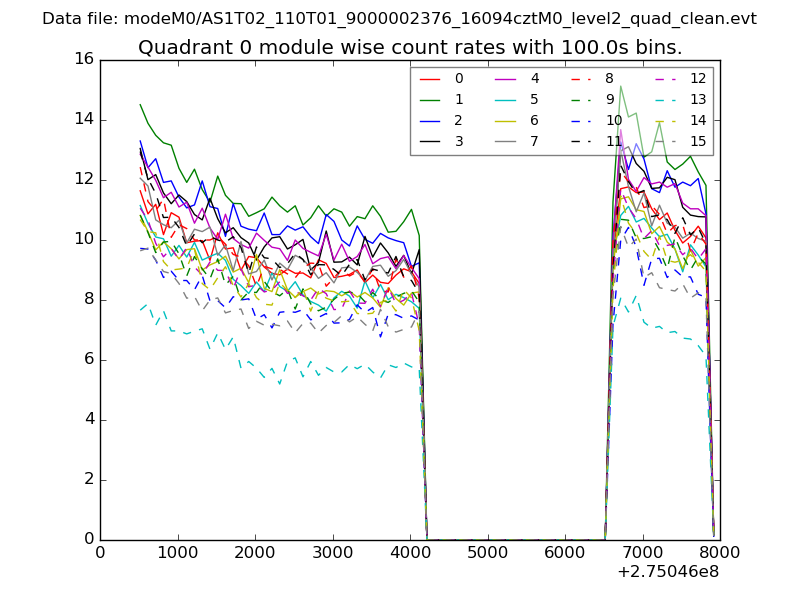 |
 |
| Module-wise count rates for Quadrant B Data is divided into 100 sec bins |
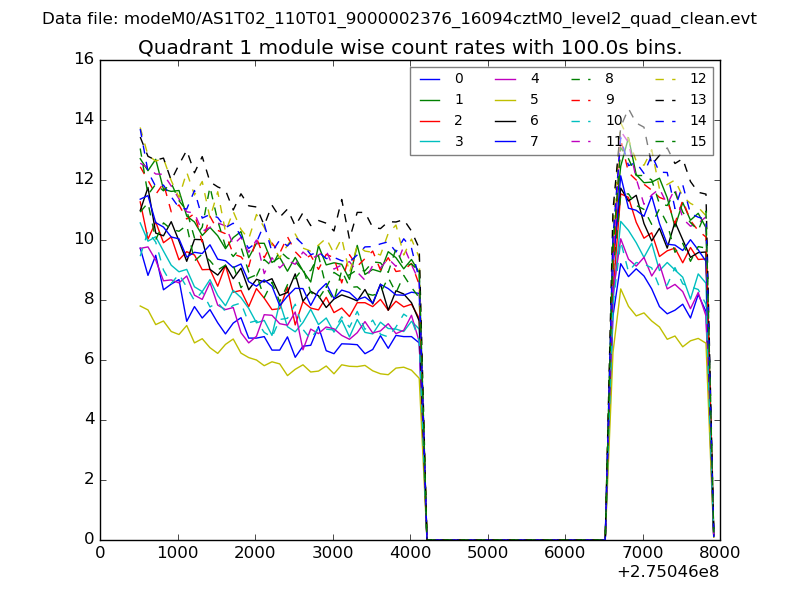 |
 |
| Module-wise count rates for Quadrant C Data is divided into 100 sec bins |
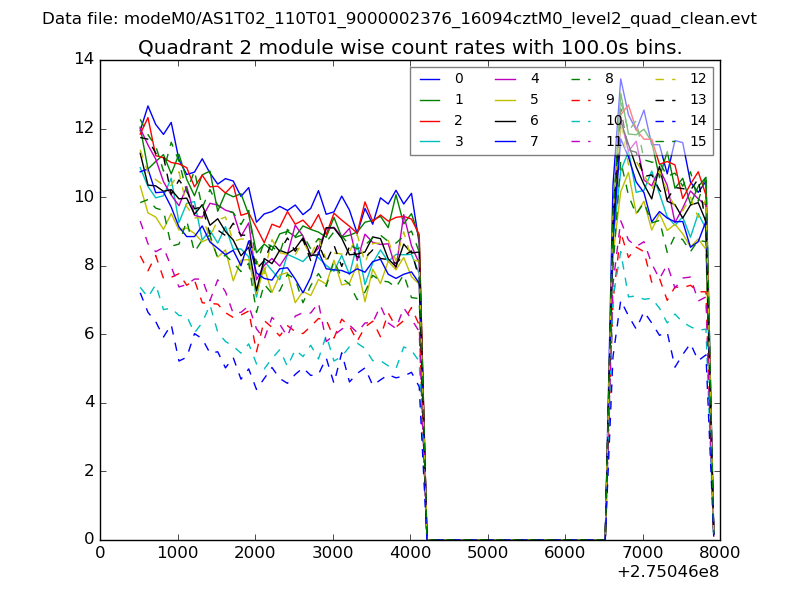 |
 |
| Module-wise count rates for Quadrant D Data is divided into 100 sec bins |
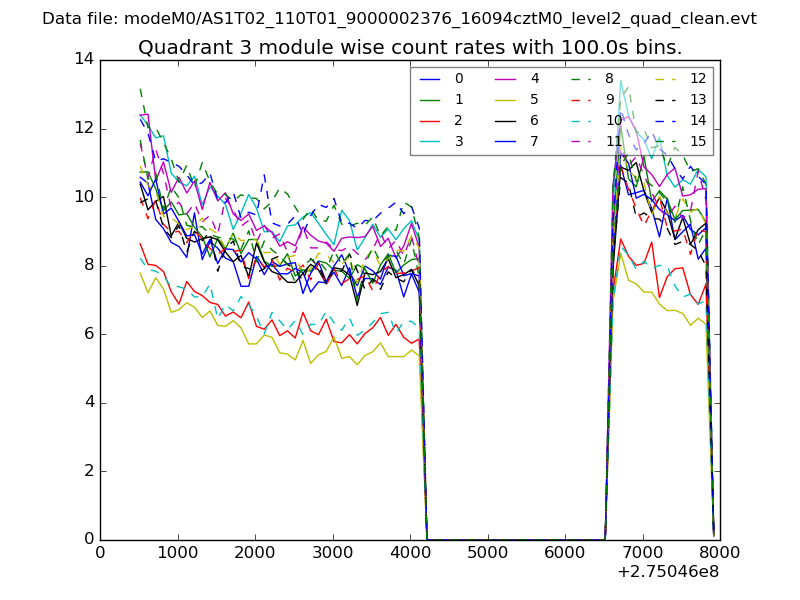 |
 |
| Parameter | Plot |
|---|---|
| CZT HV Monitor |  |
| D_VDD | 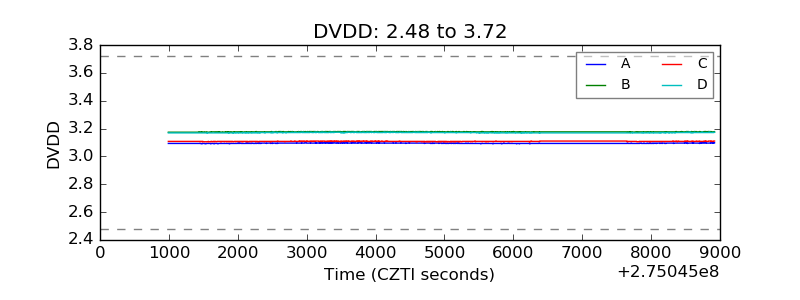 |
| Temperature 1 | 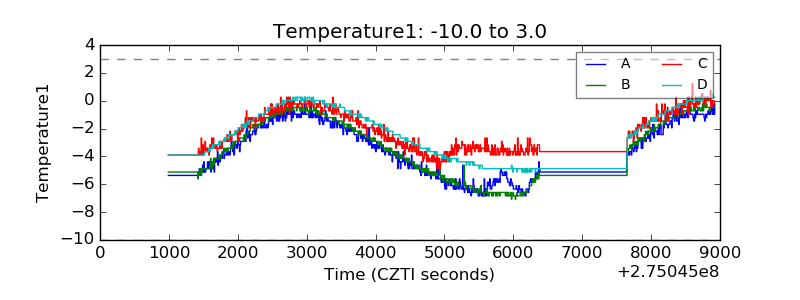 |
| Veto HV Monitor | 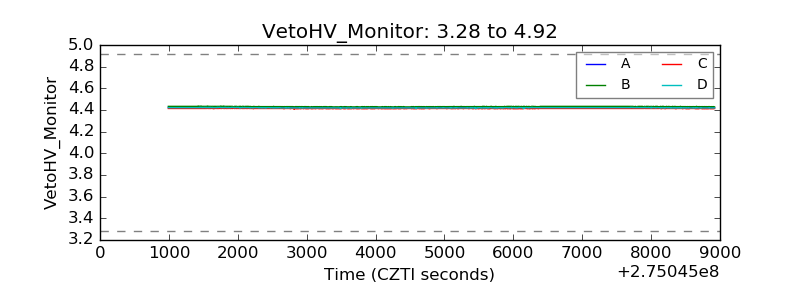 |
| Veto LLD | 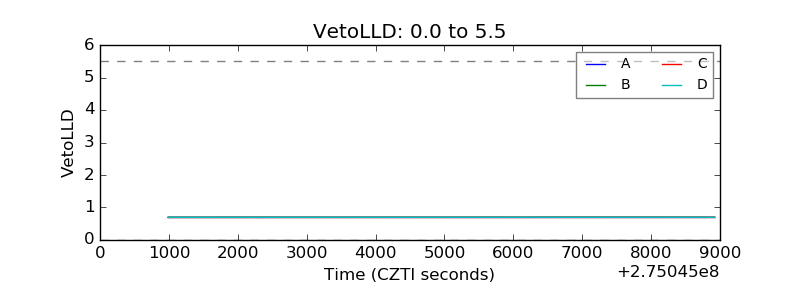 |
| Alpha Counter | 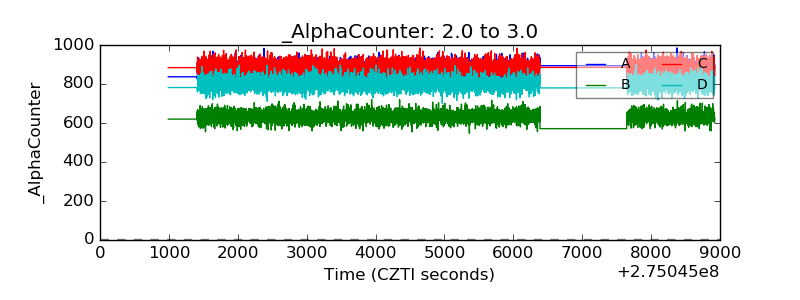 |
| _CPM_Rate | 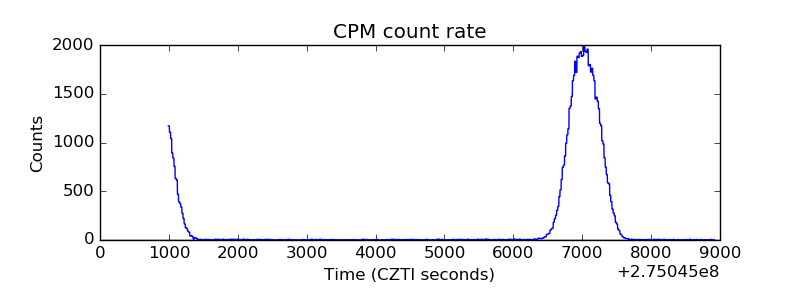 |
| CZT Counter | 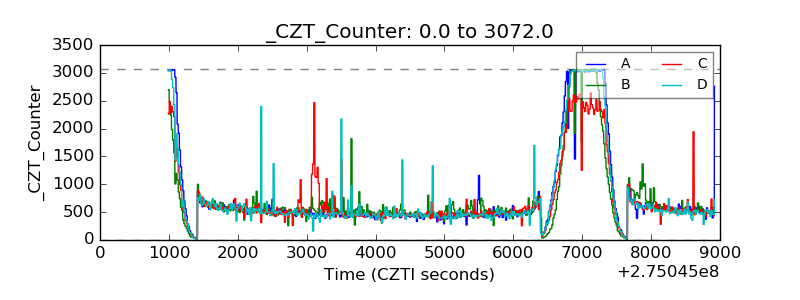 |
| +2.5 Volts monitor |  |
| +5 Volts monitor | 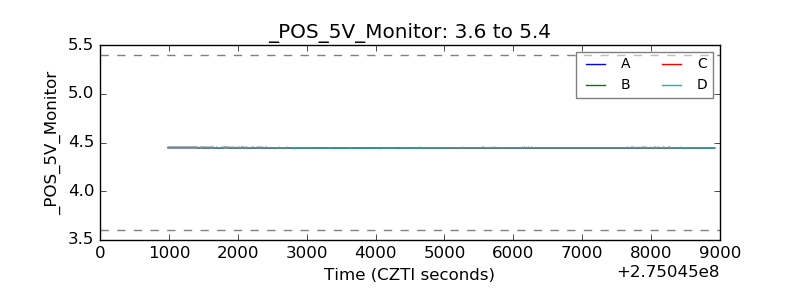 |
| _ROLL_ROT | 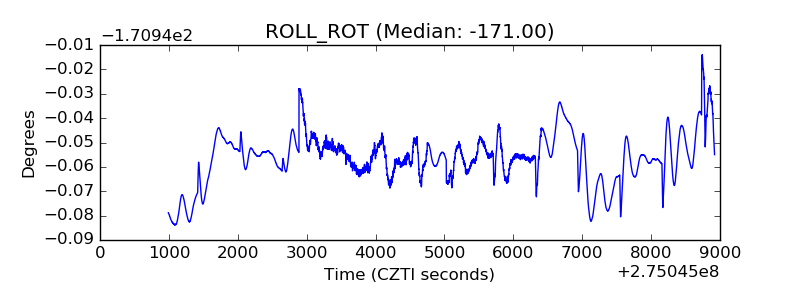 |
| _Roll_DEC | 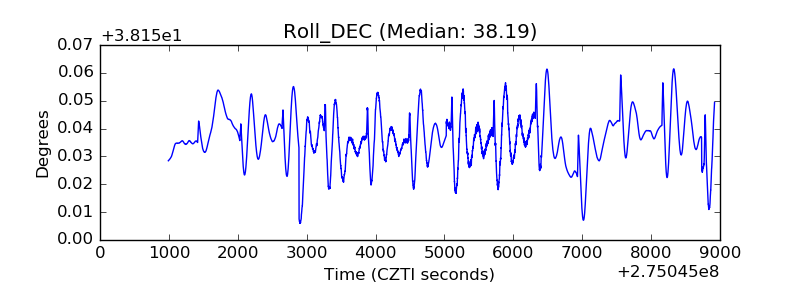 |
| _Roll_RA | 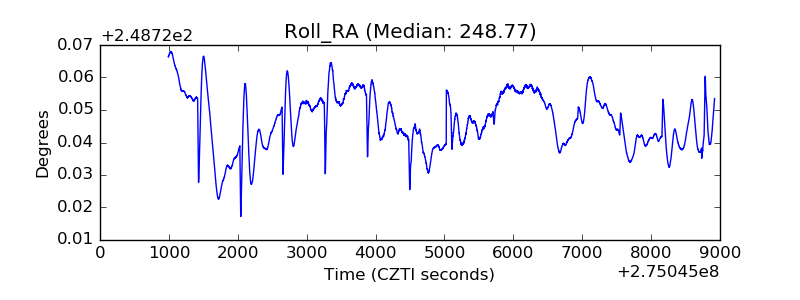 |
| Veto Counter | 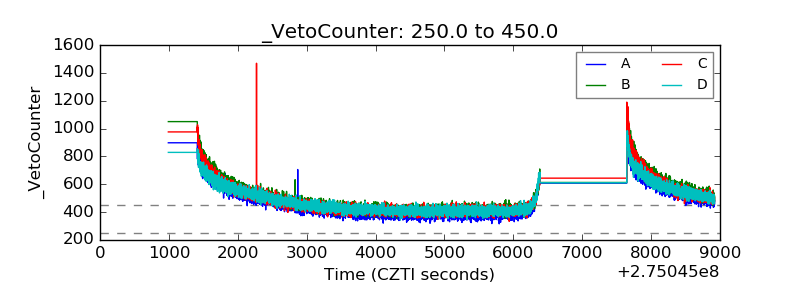 |