| Param | Original file | Final file |
|---|---|---|
| Filename | modeM0/AS1T02_110T01_9000002376_16097cztM0_level2.evt | modeM0/AS1T02_110T01_9000002376_16097cztM0_level2_quad_clean.evt |
| Size (bytes) | 463,547,520 | 78,036,480 |
| Size | 442.1 MB | 74.4 MB |
| Events in quadrant A | 2,825,640 | 513,616 |
| Events in quadrant B | 3,934,107 | 498,643 |
| Events in quadrant C | 2,840,498 | 485,003 |
| Events in quadrant D | 4,039,224 | 455,212 |
| Mode SS | |||
|---|---|---|---|
| Quadrant | BADHDUFLAG | Total packets | Discarded packets |
| A | 0 | 118 | 0 |
| B | 0 | 118 | 0 |
| C | 0 | 118 | 0 |
| D | 0 | 118 | 0 |
| Mode M9 | |||
|---|---|---|---|
| Quadrant | BADHDUFLAG | Total packets | Discarded packets |
| A | 0 | 12 | 0 |
| B | 0 | 12 | 0 |
| C | 0 | 12 | 0 |
| D | 0 | 12 | 0 |
| Mode M0 | |||
|---|---|---|---|
| Quadrant | BADHDUFLAG | Total packets | Discarded packets |
| A | 0 | 12243 | 2 |
| B | 0 | 15551 | 1 |
| C | 0 | 12231 | 1 |
| D | 0 | 16080 | 1 |
| Quadrant | Total seconds | Saturated seconds | Saturation percentage |
|---|---|---|---|
| A | 5877 | 57 | 0.969883% |
| B | 5877 | 303 | 5.155692% |
| C | 5877 | 93 | 1.582440% |
| D | 5877 | 504 | 8.575804% |
Noise dominated data is calculated using 1-second bins in cleaned event files. If a bin has >2000 counts, and if more than 50% of those come from <1% of pixels, then it is considered to be noise-dominated and hence unusable.
| Quadrant | # 1 sec bins | Bins with >0 counts | Bins with >2000 counts | High rate bins dominated by noise | Noise dominated (total time) | Noise dominated (detector-on time) | Marked lightcurve |
|---|---|---|---|---|---|---|---|
| A | 7028 | 5878 | 0 | 0 | 0.00% | 0.00% | 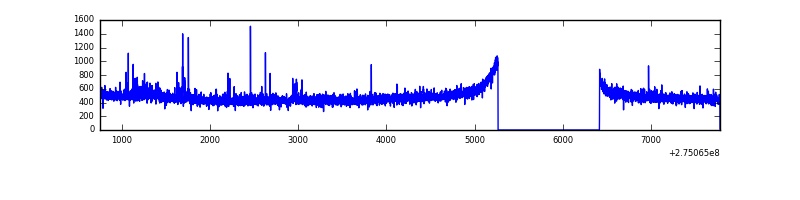 |
| B | 7028 | 5878 | 147 | 147 | 2.09% | 2.50% | 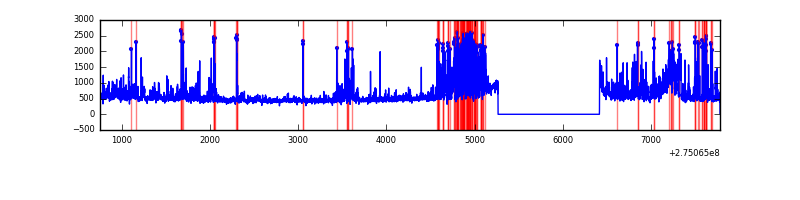 |
| C | 7028 | 5878 | 0 | 0 | 0.00% | 0.00% | 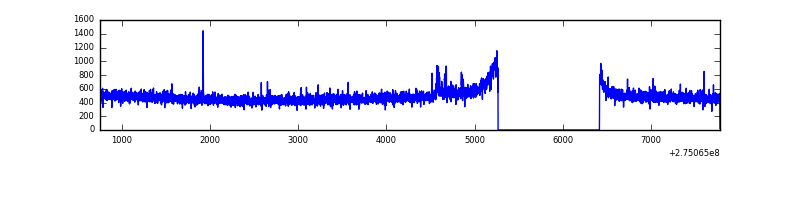 |
| D | 7028 | 5878 | 410 | 410 | 5.83% | 6.98% | 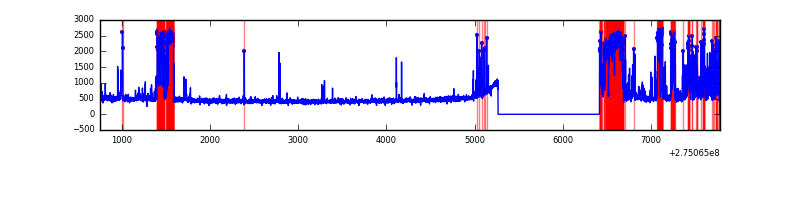 |
Top three noisy pixels from each quadrant. If the there are fewer than three noisy pixels in the level2.evt file, extra rows are filled as -1
| Pixel properties | Quadrant properties | ||||||
|---|---|---|---|---|---|---|---|
| Quadrant | DetID | PixID | Counts | Sigma | Mean | Median | Sigma |
| A | 12 | 96 | 34735 | 234.5 | 720 | 703 | 145.1 |
| A | 13 | 248 | 10815 | 69.68 | 720 | 703 | 145.1 |
| A | 15 | 174 | 7362 | 45.88 | 720 | 703 | 145.1 |
| B | 4 | 173 | 508716 | 3820.77 | 708 | 692 | 133.0 |
| B | 7 | 220 | 208043 | 1559.46 | 708 | 692 | 133.0 |
| B | 0 | 189 | 203709 | 1526.86 | 708 | 692 | 133.0 |
| C | 14 | 238 | 104810 | 641.28 | 690 | 694 | 162.4 |
| C | 3 | 233 | 36288 | 219.23 | 690 | 694 | 162.4 |
| C | 0 | 207 | 6636 | 36.6 | 690 | 694 | 162.4 |
| D | 7 | 38 | 1059966 | 6360.35 | 684 | 665 | 166.5 |
| D | 12 | 218 | 279151 | 1672.11 | 684 | 665 | 166.5 |
| D | 7 | 223 | 35563 | 209.54 | 684 | 665 | 166.5 |
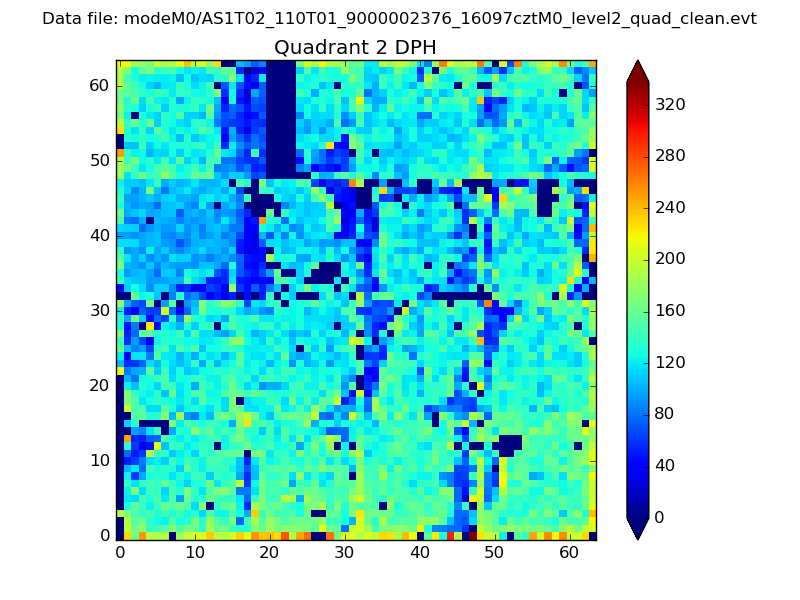
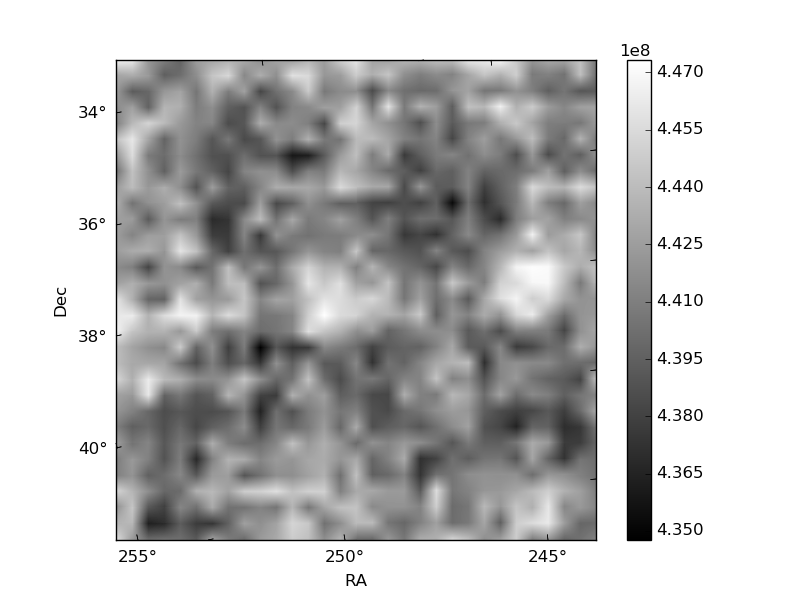
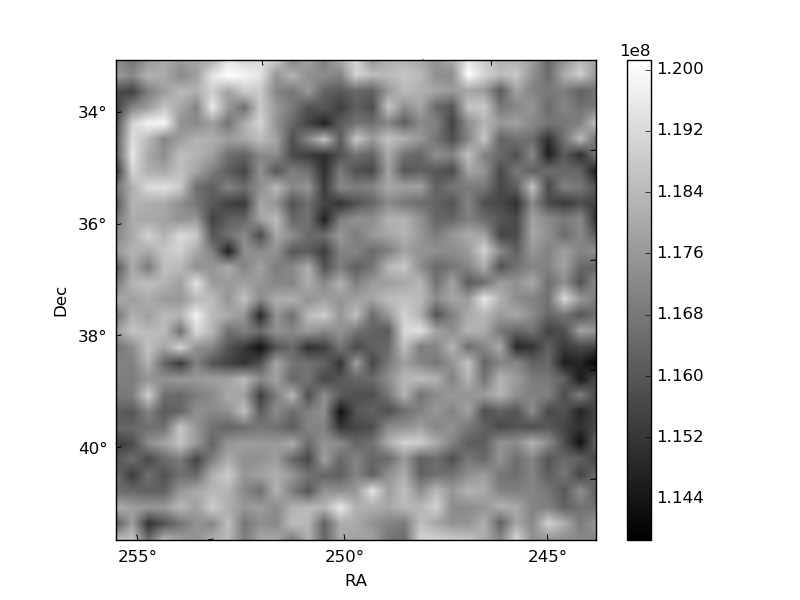
Histogram calculated using DETX and DETY for each event in the final _common_clean file
| Quadrant A | 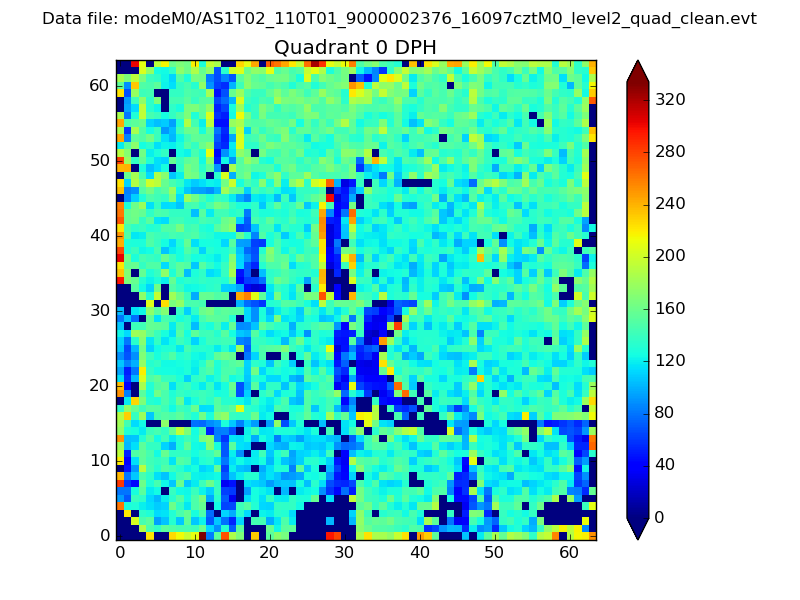 |
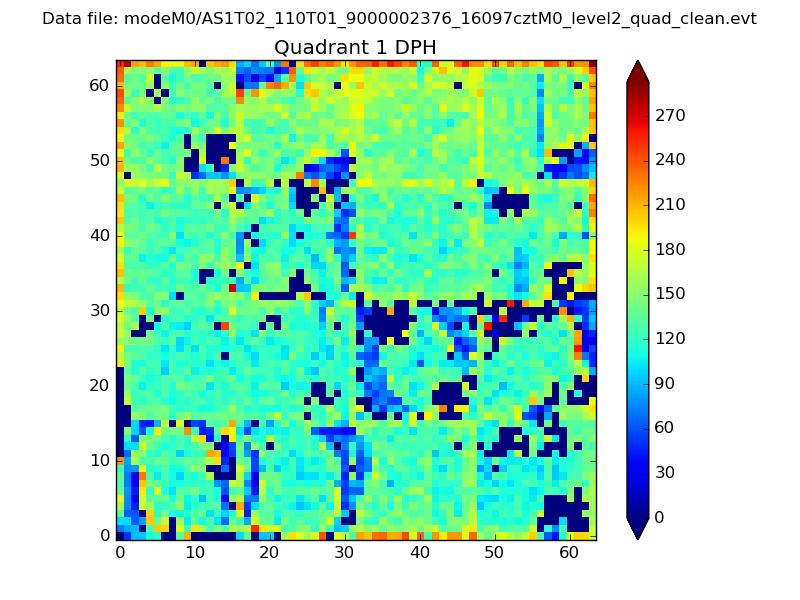 |
Quadrant B |
|---|---|---|---|
| Quadrant D | 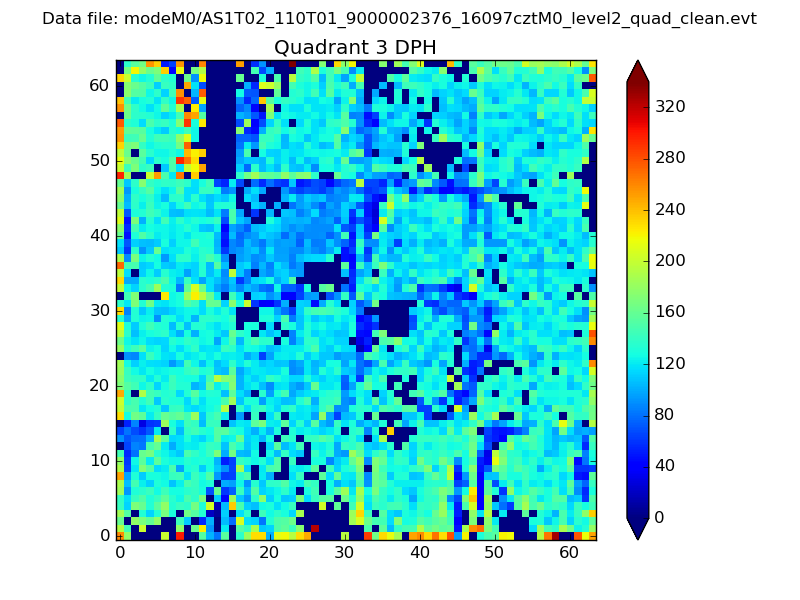 |
 |
Quadrant C |
| Plot type | Count rate plots | Images |
|---|---|---|
| Comparison with Poisson distribution Blue bars denote a histogram of data divided into 1 sec bins. Red curve is a Poisson curve with rate = median count rate of data. |
 |
 |
| Quadrant-wise count rates Data is divided into 100 sec bins |
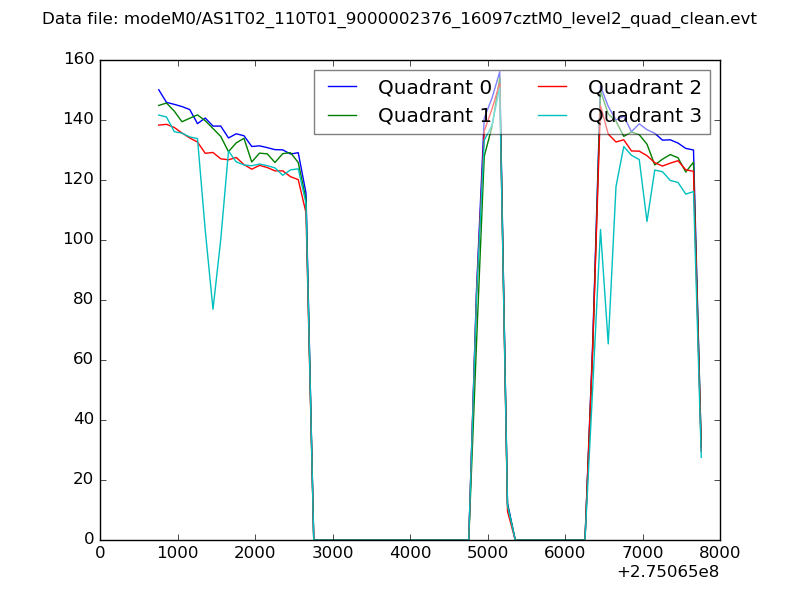 |
|
| Module-wise count rates for Quadrant A Data is divided into 100 sec bins |
 |
 |
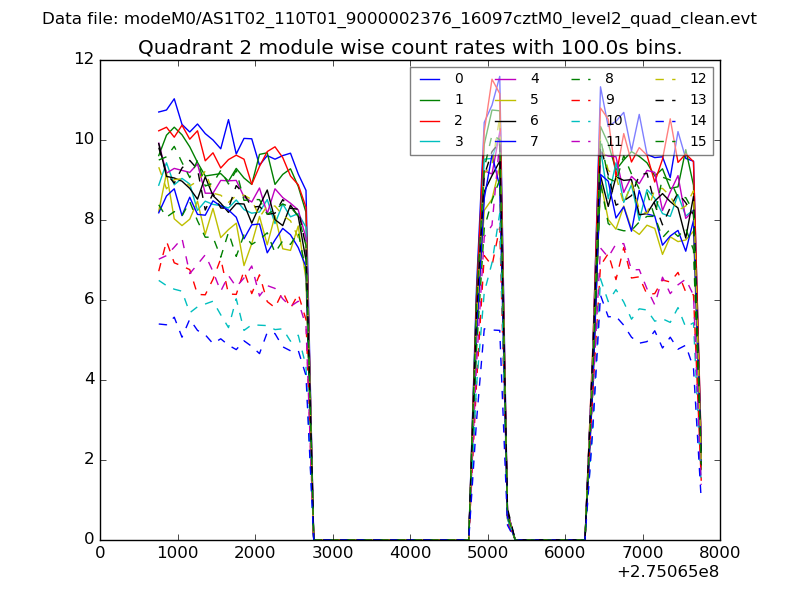
| Module-wise count rates for Quadrant B Data is divided into 100 sec bins |
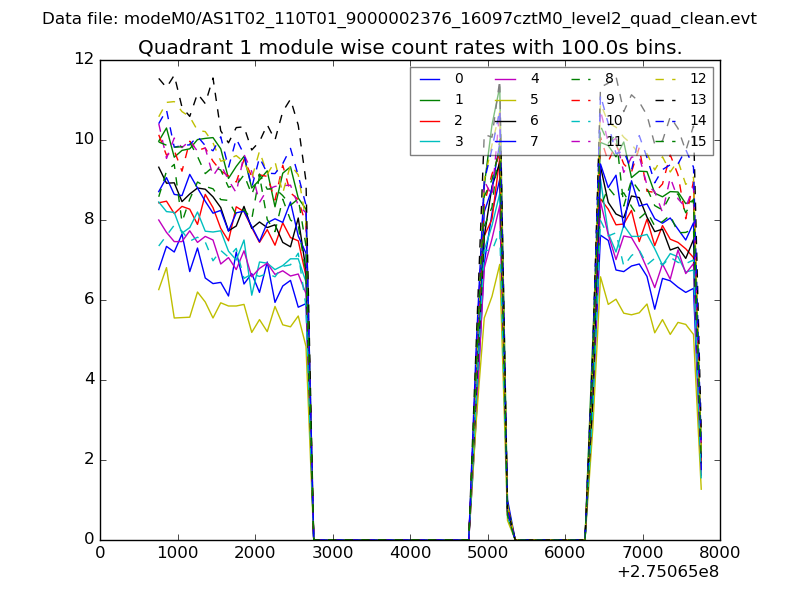 |
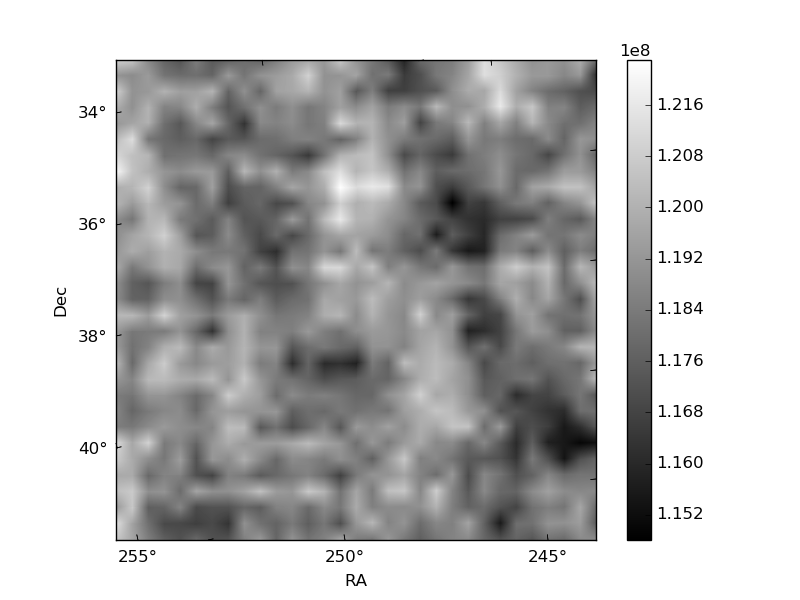 |
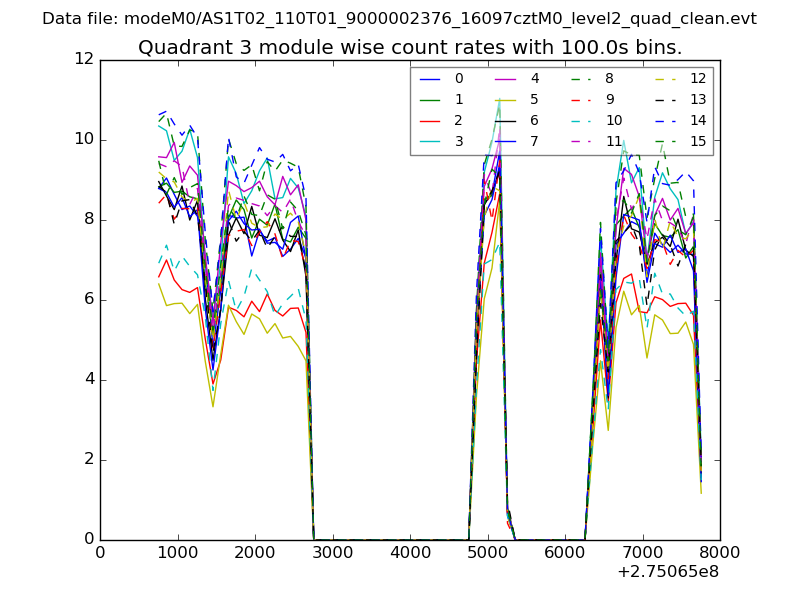
| Module-wise count rates for Quadrant C Data is divided into 100 sec bins |
 |
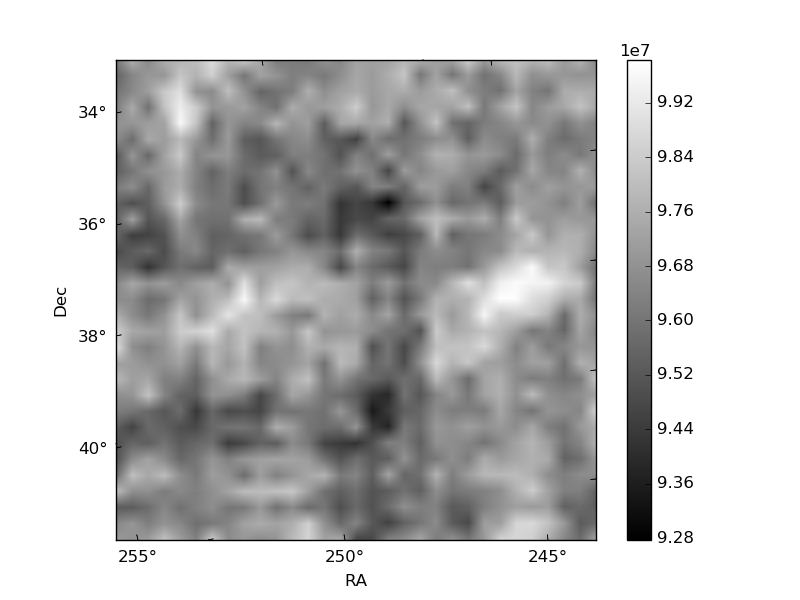 |
| Module-wise count rates for Quadrant D Data is divided into 100 sec bins |
 |
 |
| Parameter | Plot |
|---|---|
| CZT HV Monitor | 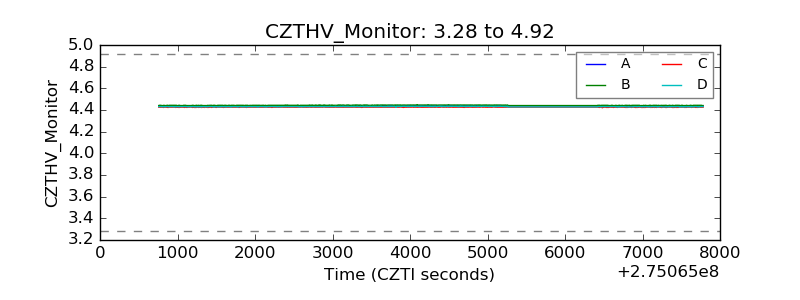 |
| D_VDD | 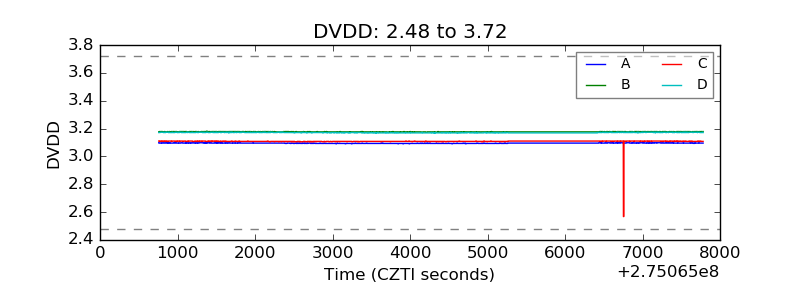 |
| Temperature 1 | 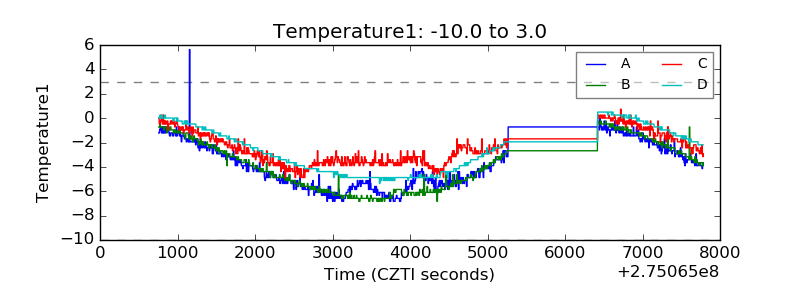 |
| Veto HV Monitor | 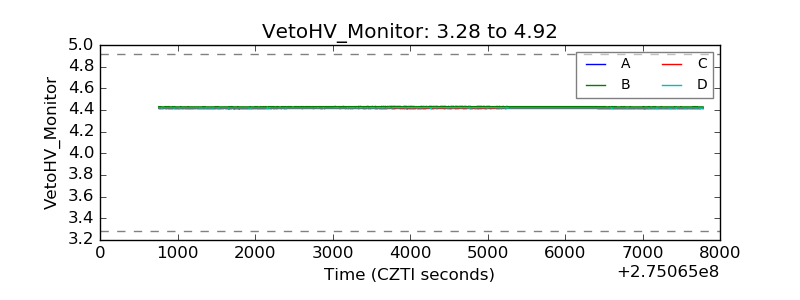 |
| Veto LLD |  |
| Alpha Counter |  |
| _CPM_Rate | 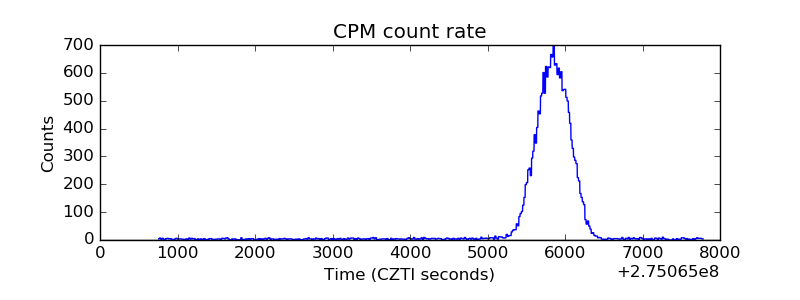 |
| CZT Counter | 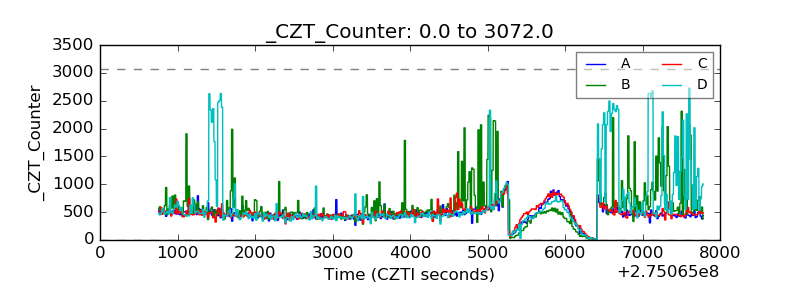 |
| +2.5 Volts monitor |  |
| +5 Volts monitor | 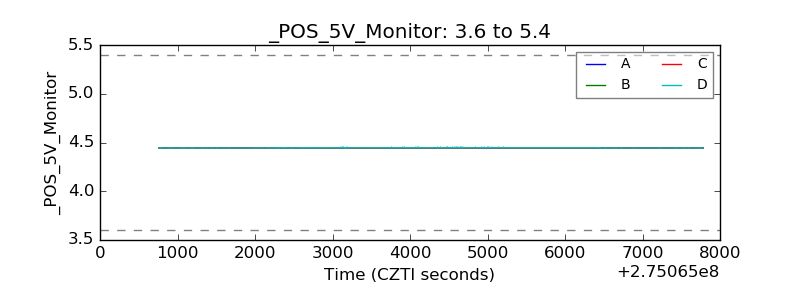 |
| _ROLL_ROT | 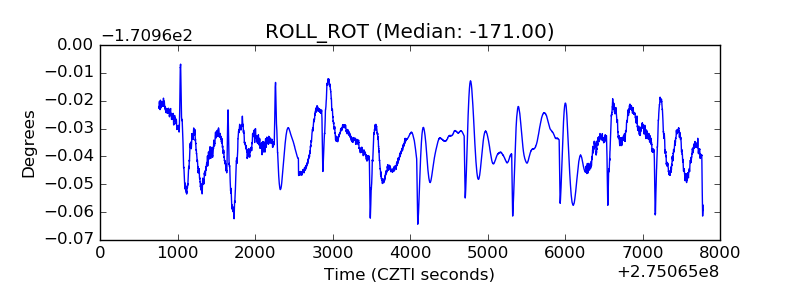 |
| _Roll_DEC | 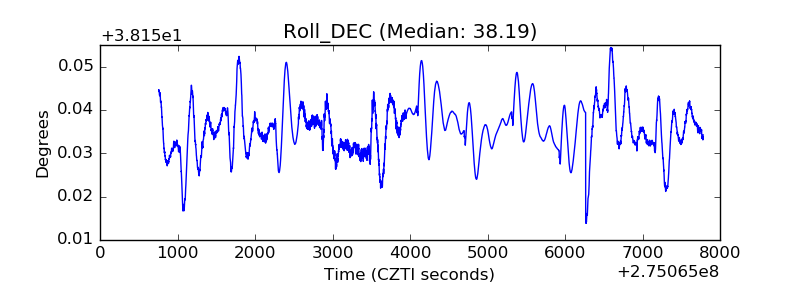 |
| _Roll_RA | 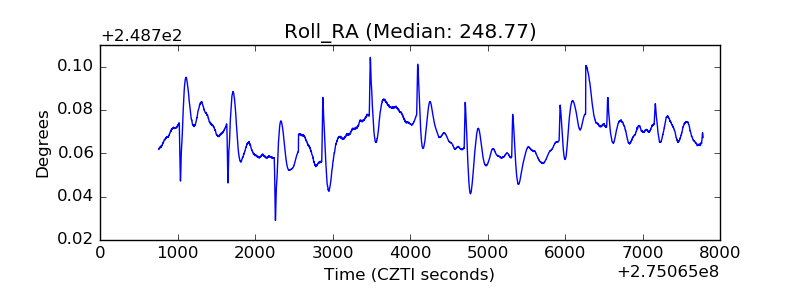 |
| Veto Counter | 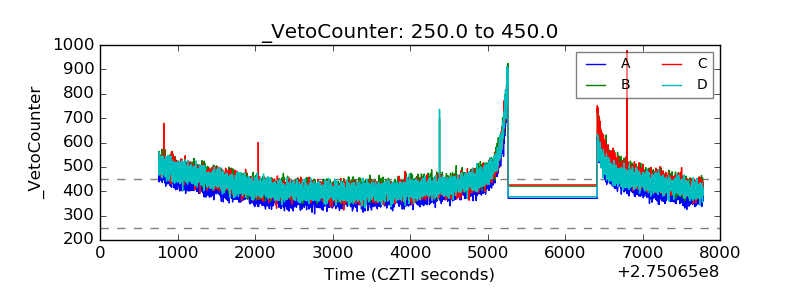 |