| Param | Original file | Final file |
|---|---|---|
| Filename | modeM0/AS1T02_110T01_9000002376_16099cztM0_level2.evt | modeM0/AS1T02_110T01_9000002376_16099cztM0_level2_quad_clean.evt |
| Size (bytes) | 414,823,680 | 57,360,960 |
| Size | 395.6 MB | 54.7 MB |
| Events in quadrant A | 2,379,488 | 377,895 |
| Events in quadrant B | 2,518,321 | 375,706 |
| Events in quadrant C | 2,291,288 | 358,382 |
| Events in quadrant D | 5,027,222 | 267,220 |
| Mode SS | |||
|---|---|---|---|
| Quadrant | BADHDUFLAG | Total packets | Discarded packets |
| A | 0 | 102 | 0 |
| B | 0 | 102 | 0 |
| C | 0 | 102 | 0 |
| D | 0 | 102 | 0 |
| Mode M0 | |||
|---|---|---|---|
| Quadrant | BADHDUFLAG | Total packets | Discarded packets |
| A | 0 | 10536 | 0 |
| B | 0 | 10709 | 0 |
| C | 0 | 10237 | 0 |
| D | 0 | 18514 | 0 |
| Quadrant | Total seconds | Saturated seconds | Saturation percentage |
|---|---|---|---|
| A | 5091 | 30 | 0.589275% |
| B | 5091 | 10 | 0.196425% |
| C | 5091 | 14 | 0.274995% |
| D | 5091 | 1152 | 22.628167% |
Noise dominated data is calculated using 1-second bins in cleaned event files. If a bin has >2000 counts, and if more than 50% of those come from <1% of pixels, then it is considered to be noise-dominated and hence unusable.
| Quadrant | # 1 sec bins | Bins with >0 counts | Bins with >2000 counts | High rate bins dominated by noise | Noise dominated (total time) | Noise dominated (detector-on time) | Marked lightcurve |
|---|---|---|---|---|---|---|---|
| A | 5092 | 5092 | 27 | 27 | 0.53% | 0.53% | 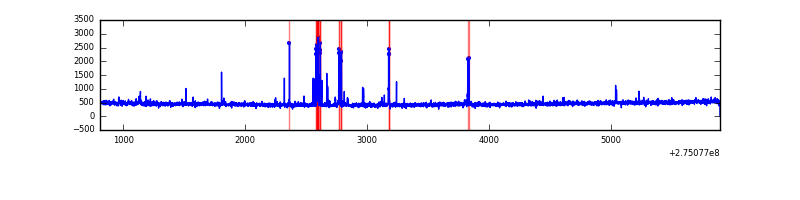 |
| B | 5092 | 5092 | 0 | 0 | 0.00% | 0.00% | 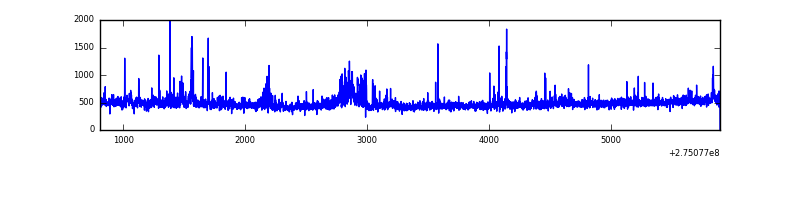 |
| C | 5092 | 5092 | 1 | 1 | 0.02% | 0.02% | 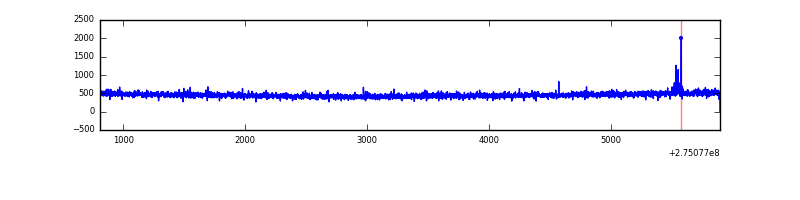 |
| D | 5092 | 5092 | 1137 | 1137 | 22.33% | 22.33% | 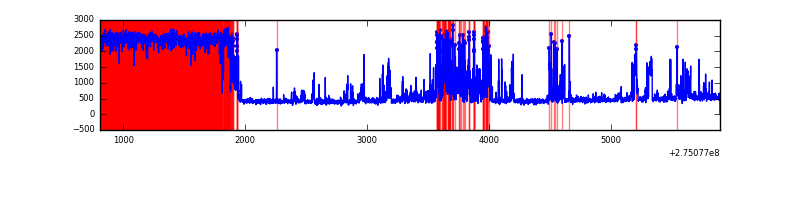 |
Top three noisy pixels from each quadrant. If the there are fewer than three noisy pixels in the level2.evt file, extra rows are filled as -1
| Pixel properties | Quadrant properties | ||||||
|---|---|---|---|---|---|---|---|
| Quadrant | DetID | PixID | Counts | Sigma | Mean | Median | Sigma |
| A | 15 | 174 | 100353 | 828.93 | 584 | 572 | 120.4 |
| A | 12 | 96 | 21852 | 176.78 | 584 | 572 | 120.4 |
| A | 9 | 143 | 6284 | 47.45 | 584 | 572 | 120.4 |
| B | 0 | 189 | 97154 | 859.39 | 586 | 572 | 112.4 |
| B | 0 | 229 | 26124 | 227.36 | 586 | 572 | 112.4 |
| B | 0 | 190 | 18284 | 157.6 | 586 | 572 | 112.4 |
| C | 14 | 238 | 86389 | 648.12 | 561 | 565 | 132.4 |
| C | 0 | 207 | 10805 | 77.33 | 561 | 565 | 132.4 |
| C | 3 | 233 | 5887 | 40.19 | 561 | 565 | 132.4 |
| D | 7 | 38 | 2445273 | 19380.07 | 486 | 472 | 126.2 |
| D | 12 | 218 | 502213 | 3977.33 | 486 | 472 | 126.2 |
| D | 15 | 0 | 137537 | 1086.52 | 486 | 472 | 126.2 |
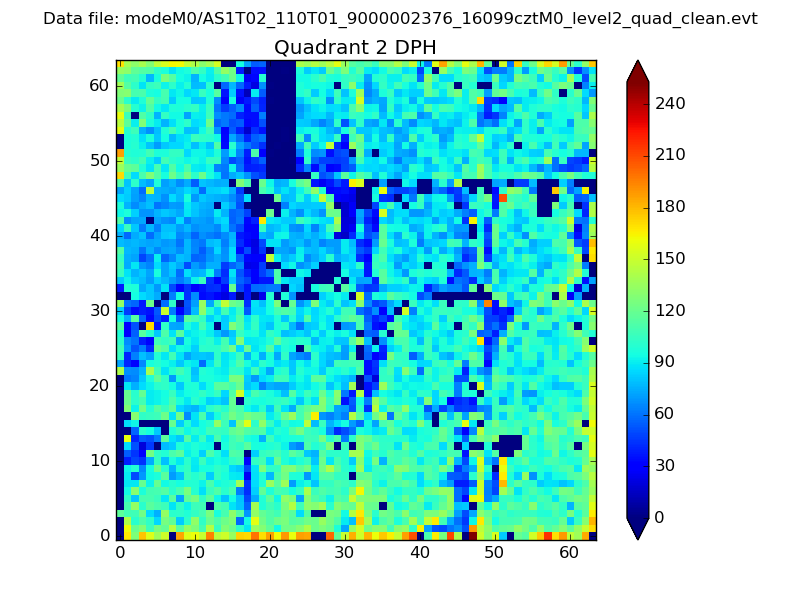
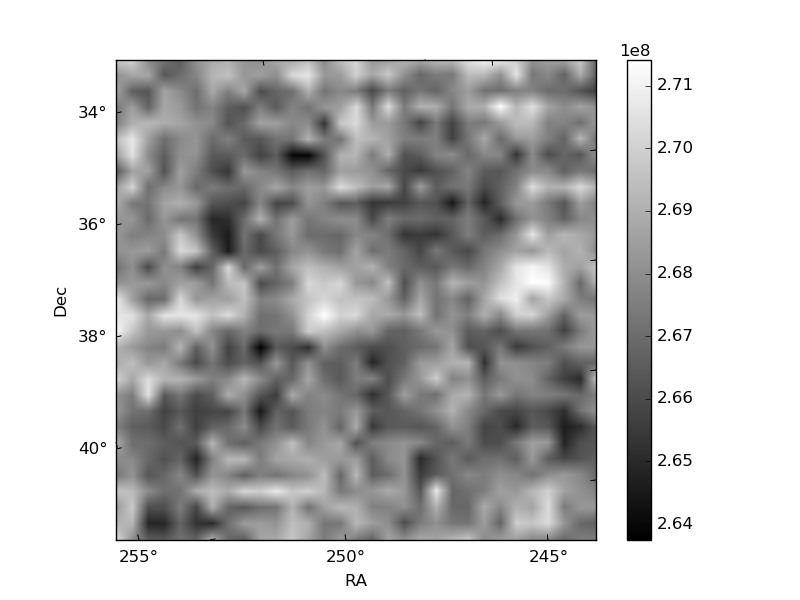
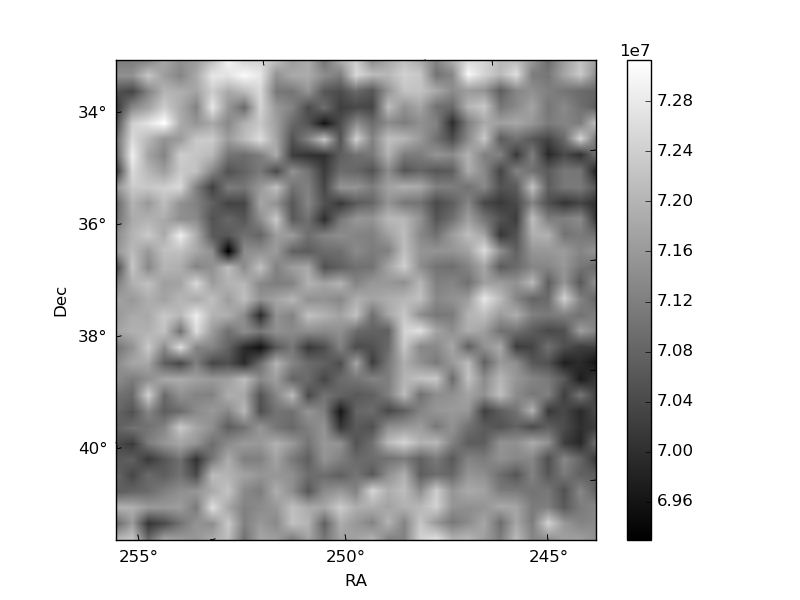
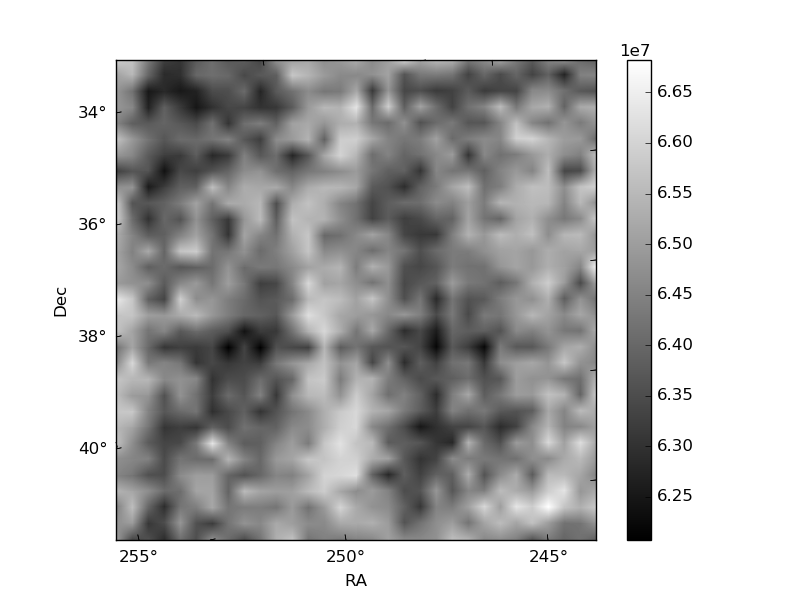
Histogram calculated using DETX and DETY for each event in the final _common_clean file
| Quadrant A | 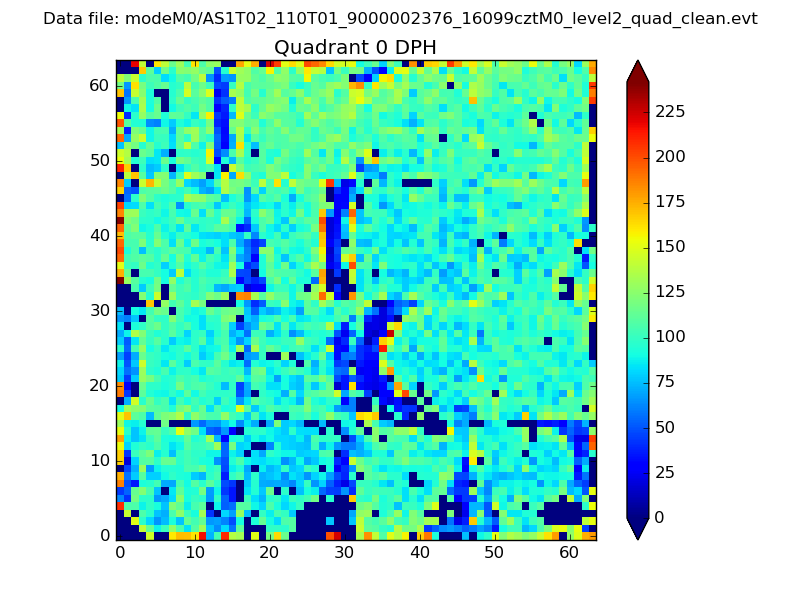 |
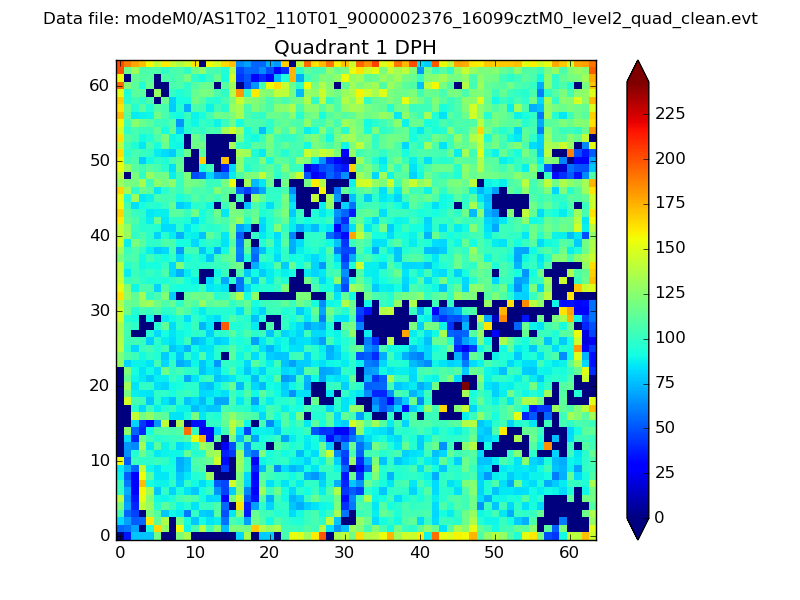 |
Quadrant B |
|---|---|---|---|
| Quadrant D | 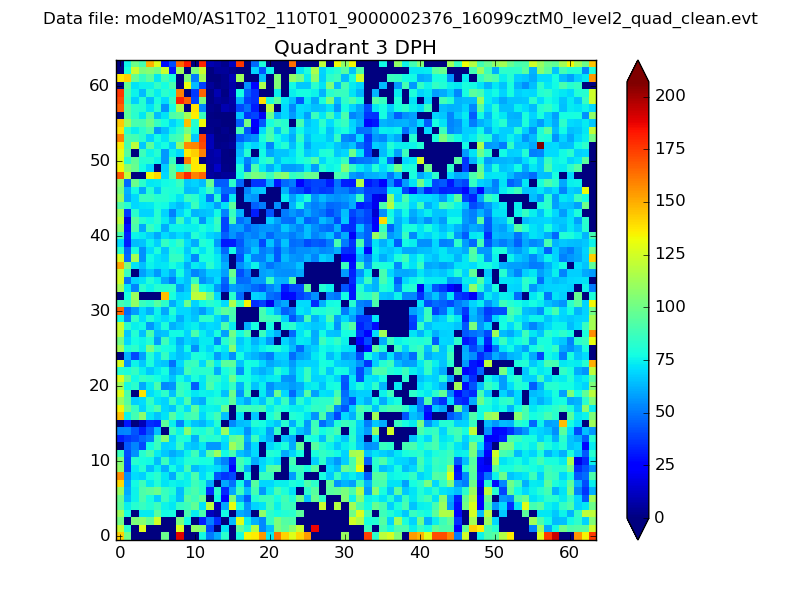 |
 |
Quadrant C |
| Plot type | Count rate plots | Images |
|---|---|---|
| Comparison with Poisson distribution Blue bars denote a histogram of data divided into 1 sec bins. Red curve is a Poisson curve with rate = median count rate of data. |
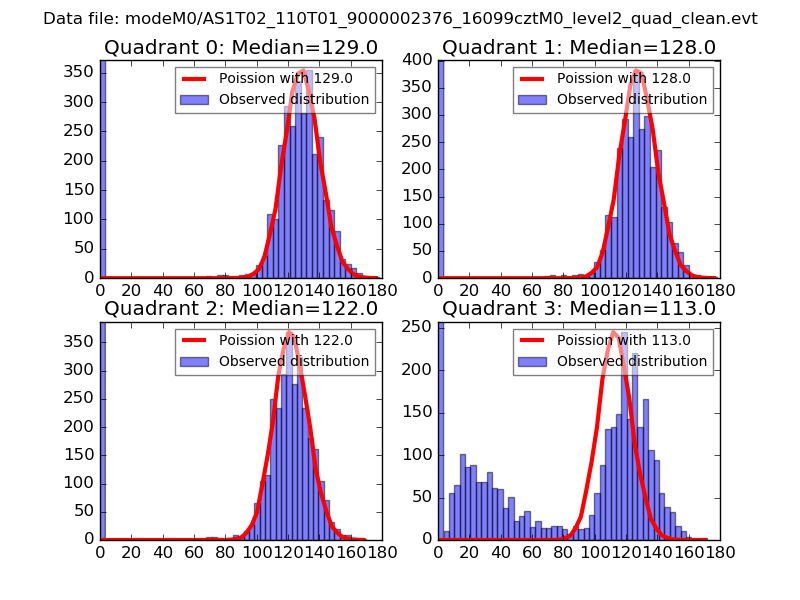 |
 |
| Quadrant-wise count rates Data is divided into 100 sec bins |
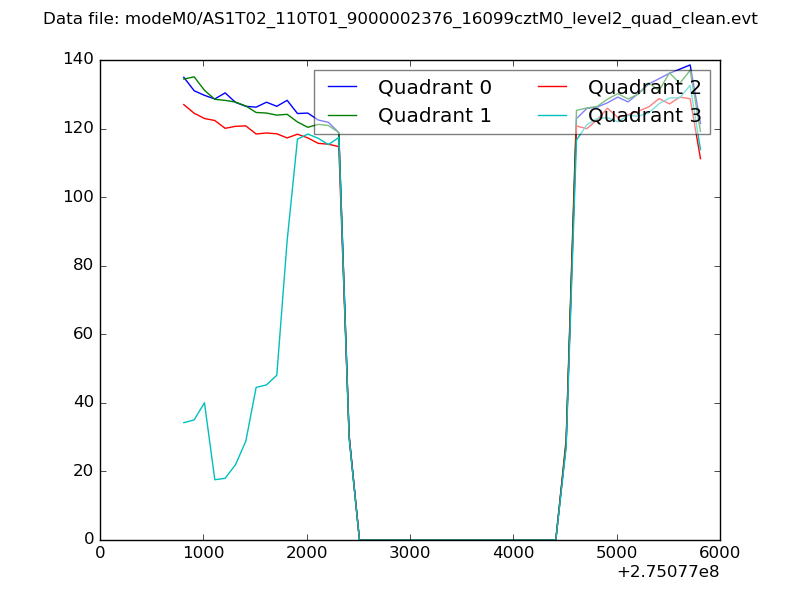 |
|
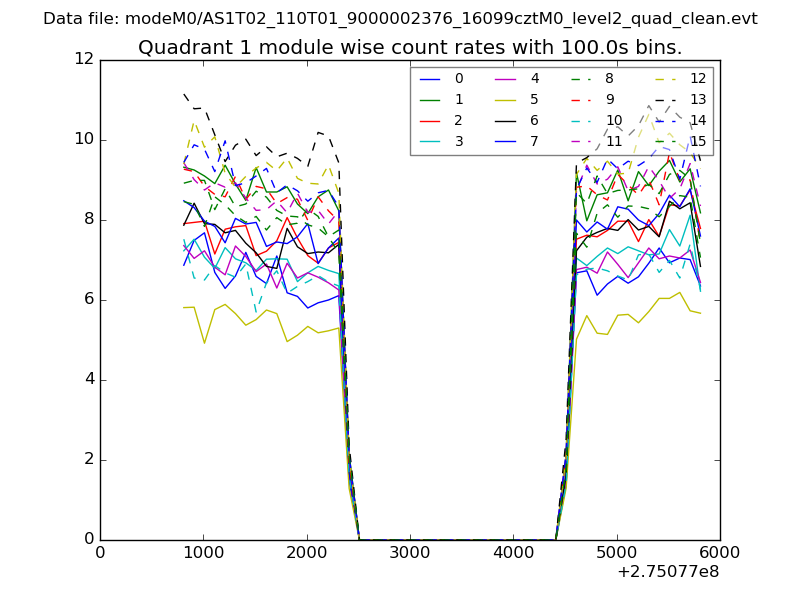
| Module-wise count rates for Quadrant A Data is divided into 100 sec bins |
 |
 |
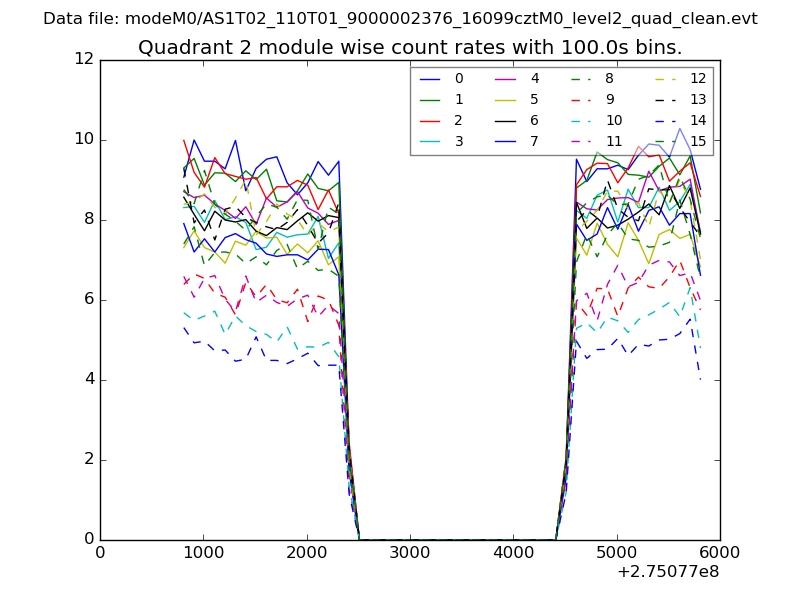
| Module-wise count rates for Quadrant B Data is divided into 100 sec bins |
 |
 |
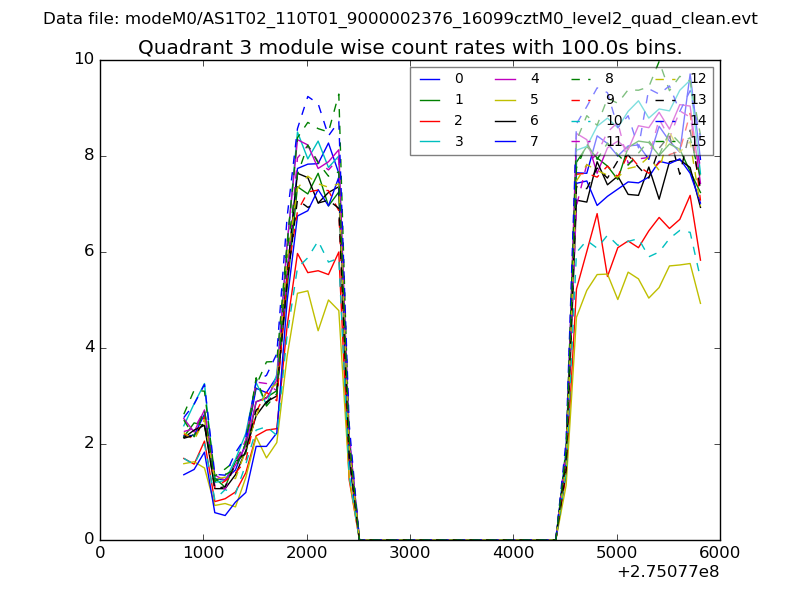
| Module-wise count rates for Quadrant C Data is divided into 100 sec bins |
 |
 |
| Module-wise count rates for Quadrant D Data is divided into 100 sec bins |
 |
 |
| Parameter | Plot |
|---|---|
| CZT HV Monitor | 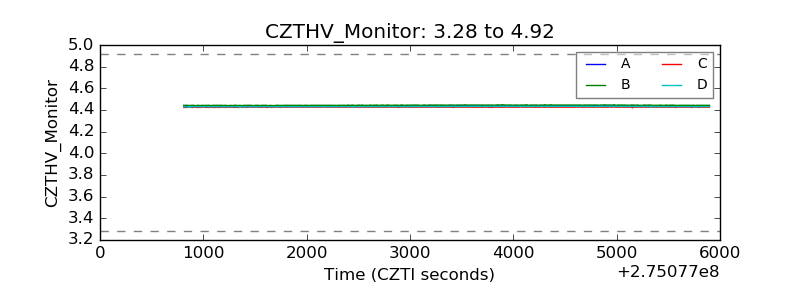 |
| D_VDD |  |
| Temperature 1 | 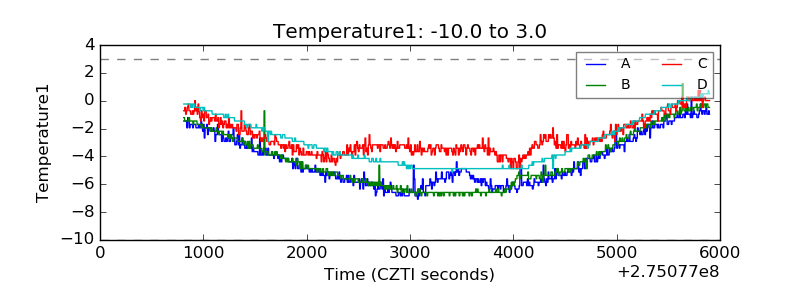 |
| Veto HV Monitor | 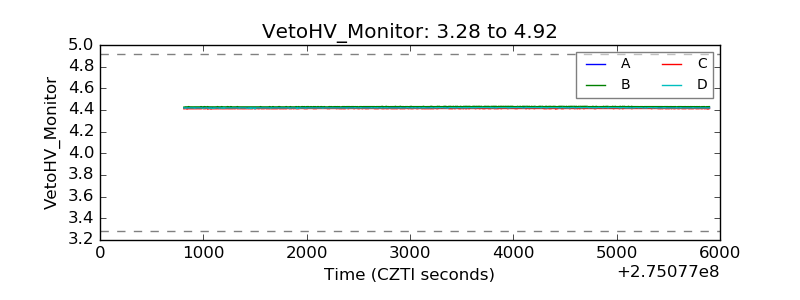 |
| Veto LLD | 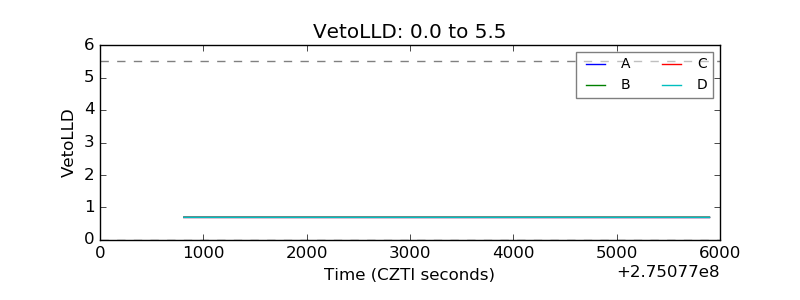 |
| Alpha Counter | 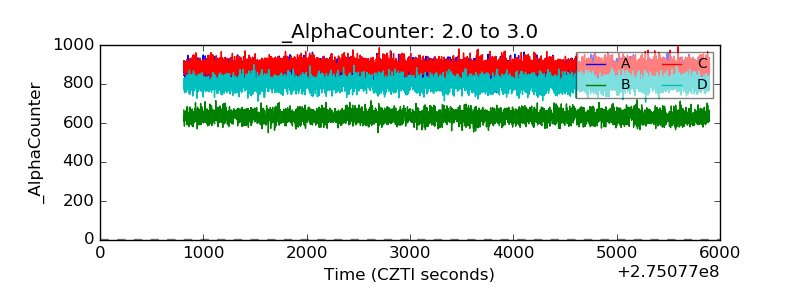 |
| _CPM_Rate | 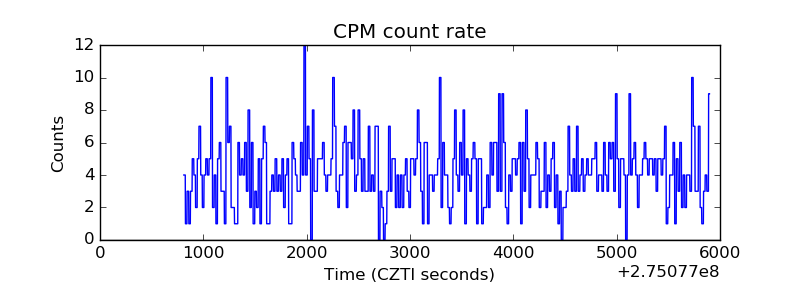 |
| CZT Counter | 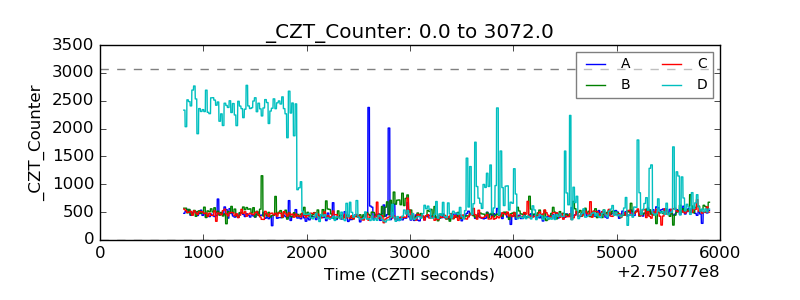 |
| +2.5 Volts monitor |  |
| +5 Volts monitor |  |
| _ROLL_ROT | 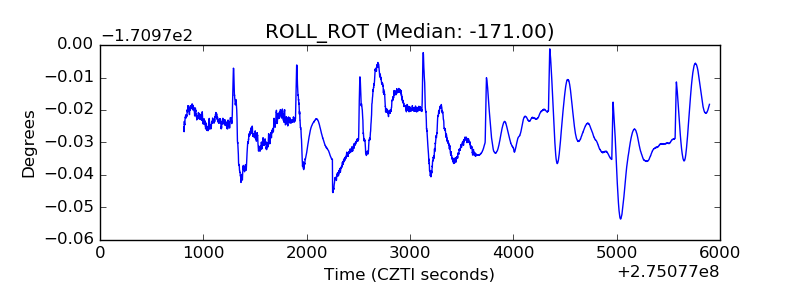 |
| _Roll_DEC | 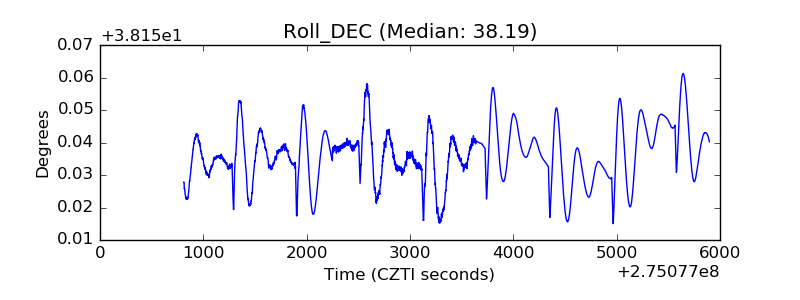 |
| _Roll_RA | 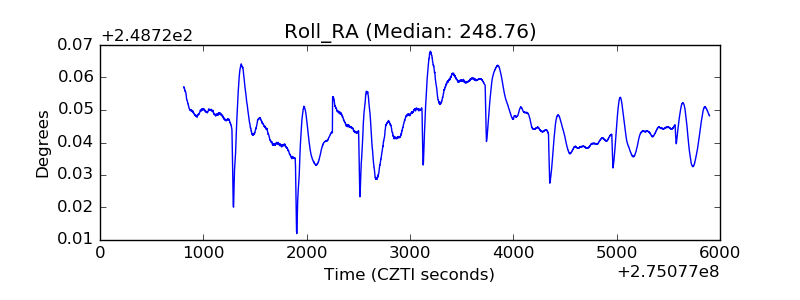 |
| Veto Counter | 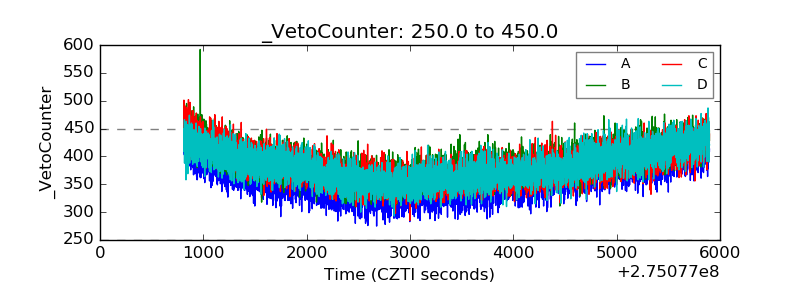 |