| Param | Original file | Final file |
|---|---|---|
| Filename | modeM0/AS1A04_209T01_9000002378_16099cztM0_level2.evt | modeM0/AS1A04_209T01_9000002378_16099cztM0_level2_quad_clean.evt |
| Size (bytes) | 86,163,840 | 21,237,120 |
| Size | 82.2 MB | 20.3 MB |
| Events in quadrant A | 578,724 | 139,769 |
| Events in quadrant B | 712,701 | 140,076 |
| Events in quadrant C | 597,487 | 135,280 |
| Events in quadrant D | 633,360 | 134,288 |
| Mode M0 | |||
|---|---|---|---|
| Quadrant | BADHDUFLAG | Total packets | Discarded packets |
| A | 0 | 2496 | 1 |
| B | 0 | 2891 | 0 |
| C | 0 | 2511 | 0 |
| D | 0 | 2696 | 0 |
| Mode SS | |||
|---|---|---|---|
| Quadrant | BADHDUFLAG | Total packets | Discarded packets |
| A | 0 | 24 | 0 |
| B | 0 | 24 | 0 |
| C | 0 | 24 | 0 |
| D | 0 | 24 | 0 |
| Quadrant | Total seconds | Saturated seconds | Saturation percentage |
|---|---|---|---|
| A | 1238 | 1 | 0.080775% |
| B | 1238 | 24 | 1.938611% |
| C | 1238 | 8 | 0.646204% |
| D | 1238 | 9 | 0.726979% |
Noise dominated data is calculated using 1-second bins in cleaned event files. If a bin has >2000 counts, and if more than 50% of those come from <1% of pixels, then it is considered to be noise-dominated and hence unusable.
| Quadrant | # 1 sec bins | Bins with >0 counts | Bins with >2000 counts | High rate bins dominated by noise | Noise dominated (total time) | Noise dominated (detector-on time) | Marked lightcurve |
|---|---|---|---|---|---|---|---|
| A | 1239 | 1239 | 0 | 0 | 0.00% | 0.00% | 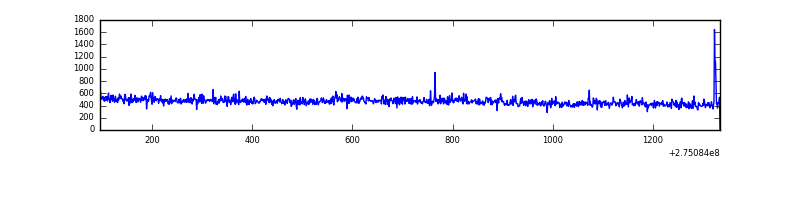 |
| B | 1239 | 1239 | 14 | 14 | 1.13% | 1.13% | 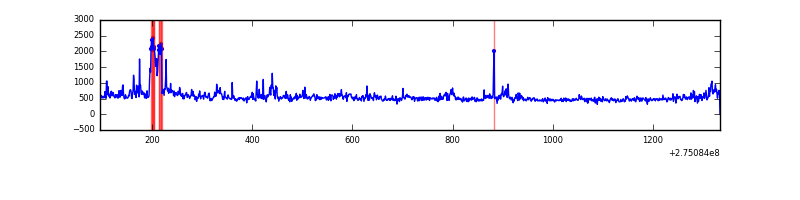 |
| C | 1239 | 1239 | 0 | 0 | 0.00% | 0.00% | 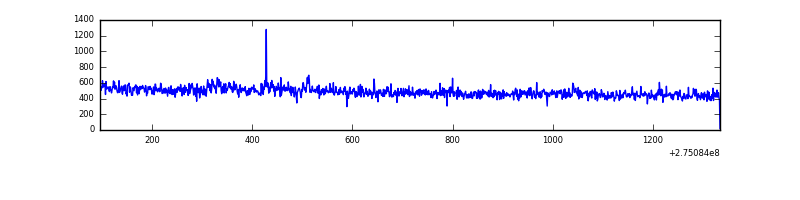 |
| D | 1239 | 1239 | 7 | 7 | 0.56% | 0.56% | 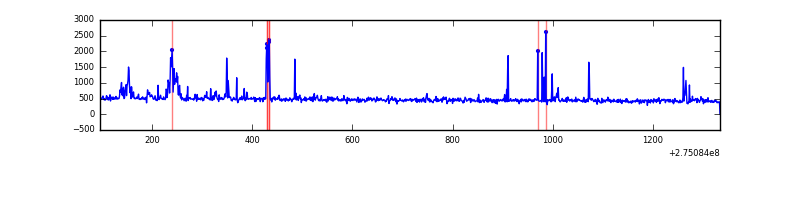 |
Top three noisy pixels from each quadrant. If the there are fewer than three noisy pixels in the level2.evt file, extra rows are filled as -1
| Pixel properties | Quadrant properties | ||||||
|---|---|---|---|---|---|---|---|
| Quadrant | DetID | PixID | Counts | Sigma | Mean | Median | Sigma |
| A | 15 | 239 | 11618 | 356.45 | 145 | 142 | 32.2 |
| A | 15 | 174 | 3495 | 104.15 | 145 | 142 | 32.2 |
| A | 12 | 96 | 2058 | 59.51 | 145 | 142 | 32.2 |
| B | 7 | 220 | 60596 | 1949.38 | 148 | 144 | 31.0 |
| B | 0 | 229 | 25634 | 821.97 | 148 | 144 | 31.0 |
| B | 0 | 189 | 21816 | 698.85 | 148 | 144 | 31.0 |
| C | 14 | 238 | 22525 | 623.62 | 144 | 144 | 35.9 |
| C | 3 | 233 | 8926 | 244.7 | 144 | 144 | 35.9 |
| C | 0 | 207 | 2079 | 53.92 | 144 | 144 | 35.9 |
| D | 12 | 235 | 35956 | 960.96 | 144 | 139 | 37.3 |
| D | 13 | 172 | 17016 | 452.8 | 144 | 139 | 37.3 |
| D | 7 | 38 | 16171 | 430.13 | 144 | 139 | 37.3 |
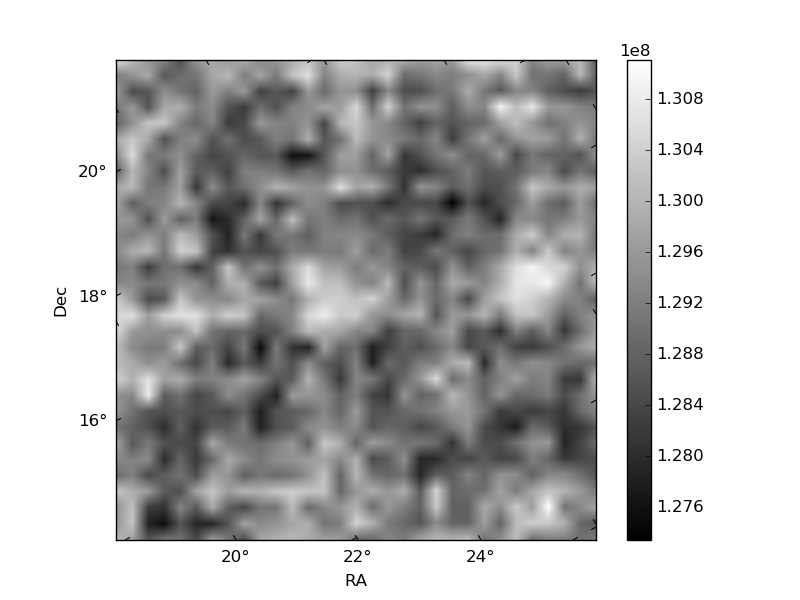
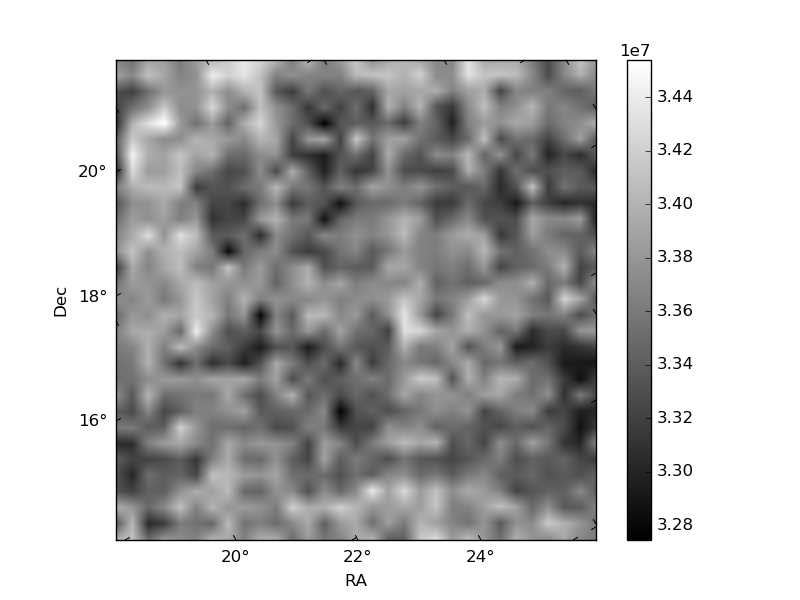
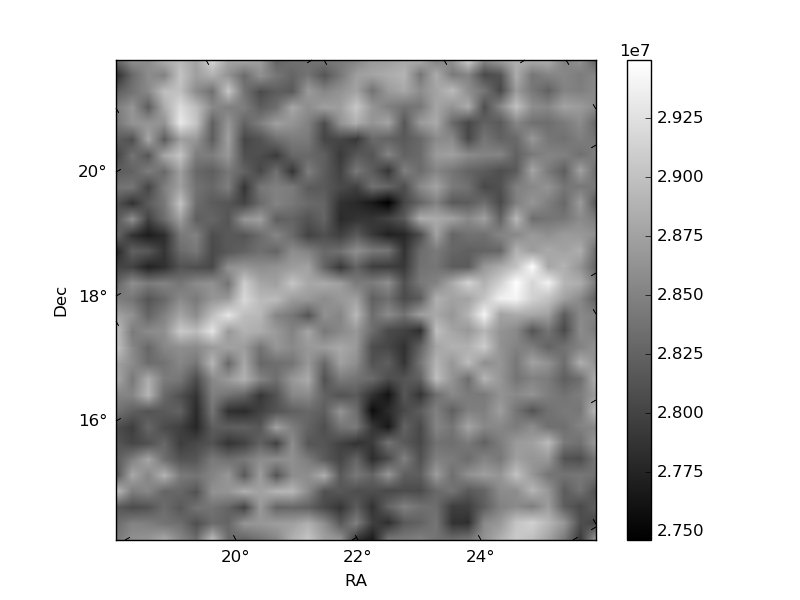
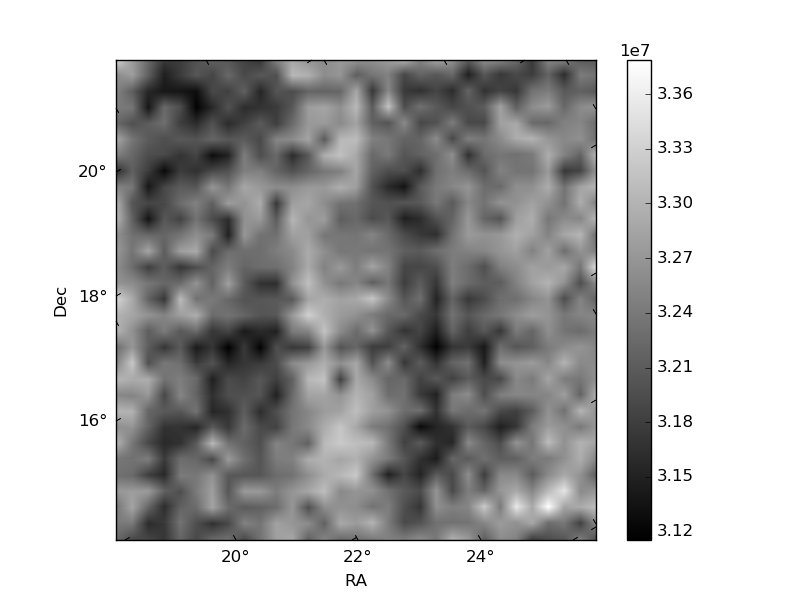
Histogram calculated using DETX and DETY for each event in the final _common_clean file
| Quadrant A | 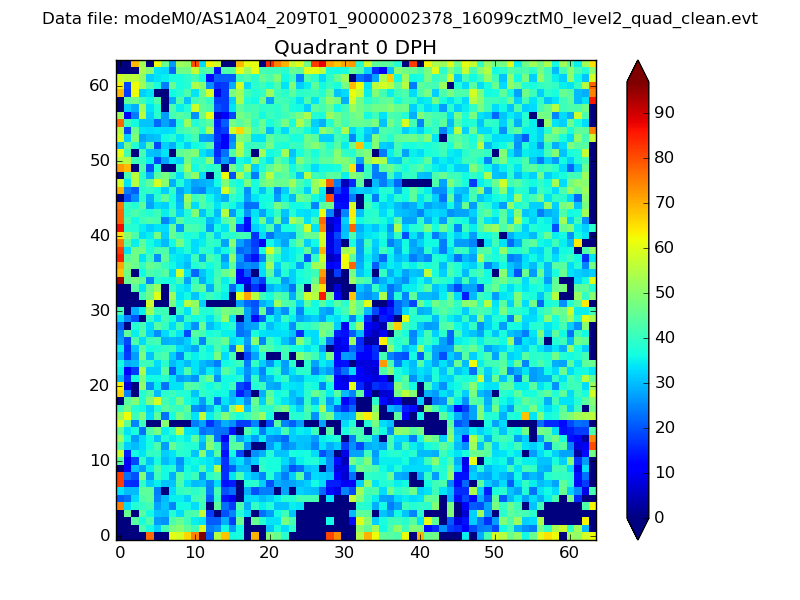 |
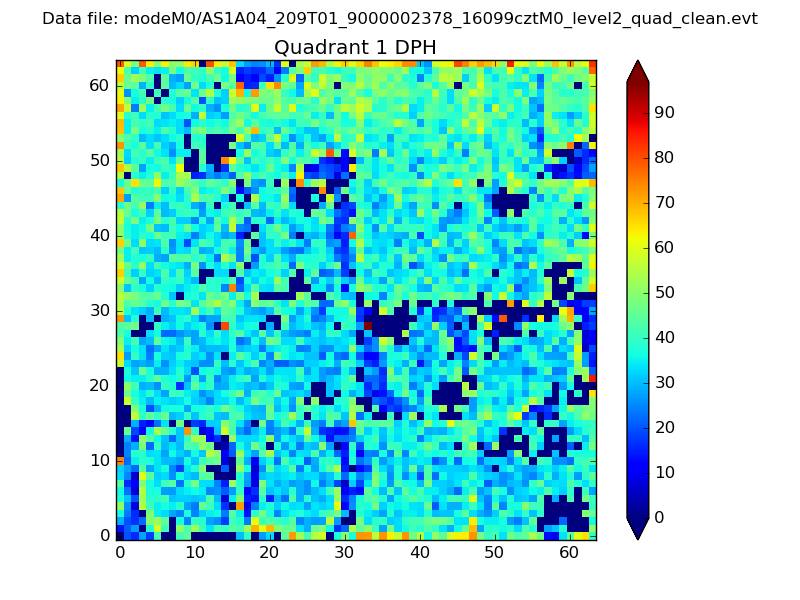 |
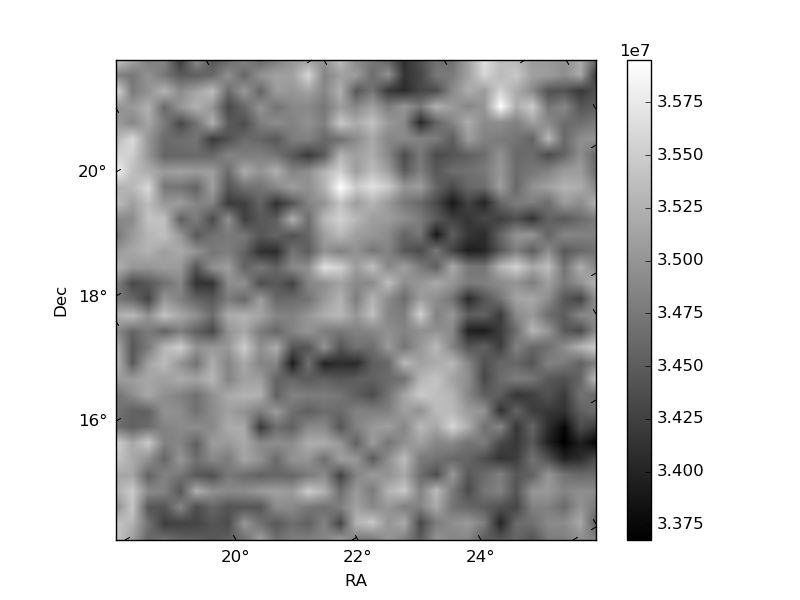
Quadrant B |
|---|---|---|---|
| Quadrant D | 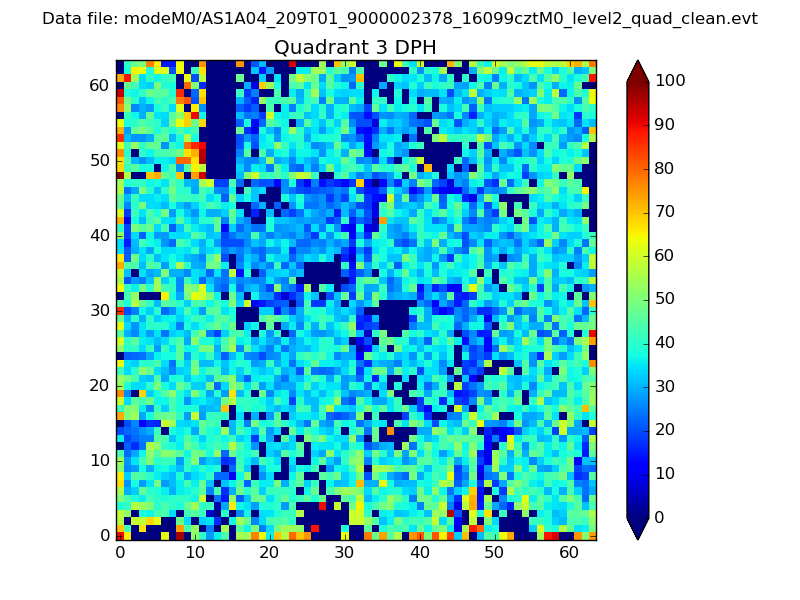 |
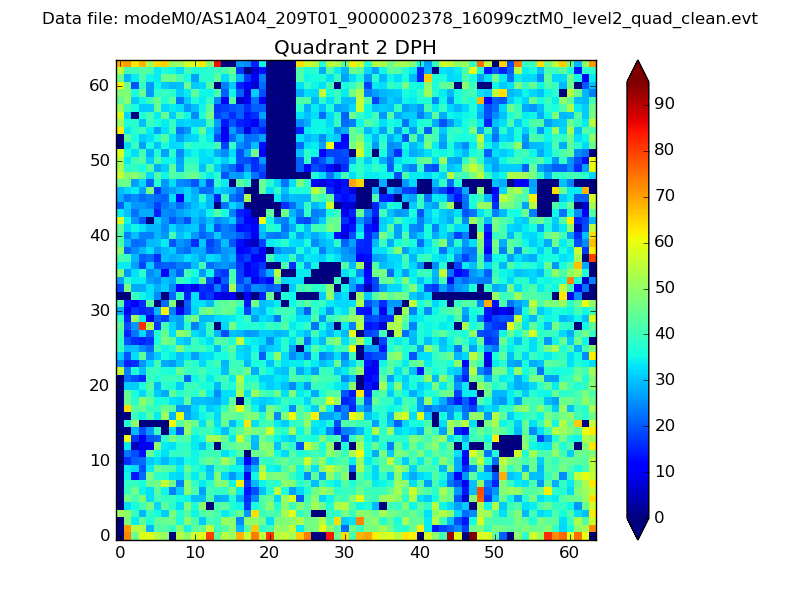 |
Quadrant C |
| Plot type | Count rate plots | Images |
|---|---|---|
| Comparison with Poisson distribution Blue bars denote a histogram of data divided into 1 sec bins. Red curve is a Poisson curve with rate = median count rate of data. |
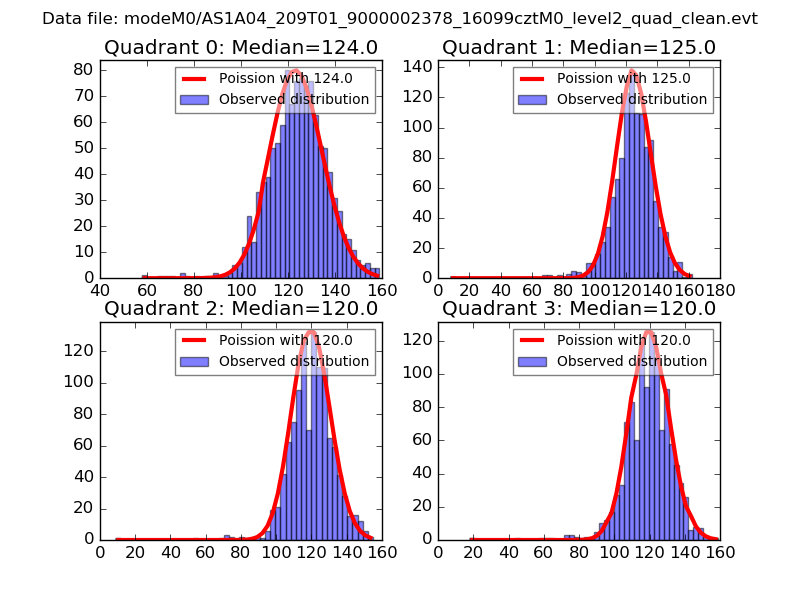 |
 |
| Quadrant-wise count rates Data is divided into 100 sec bins |
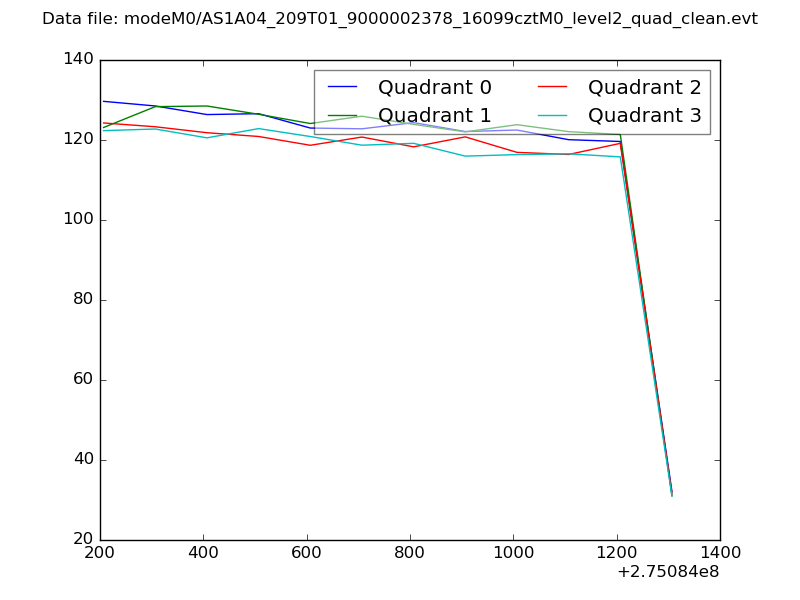 |
|
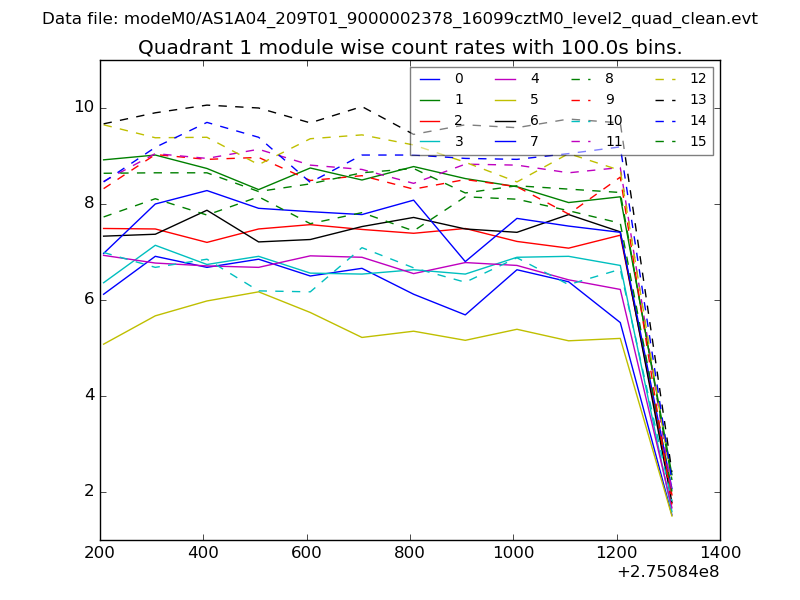
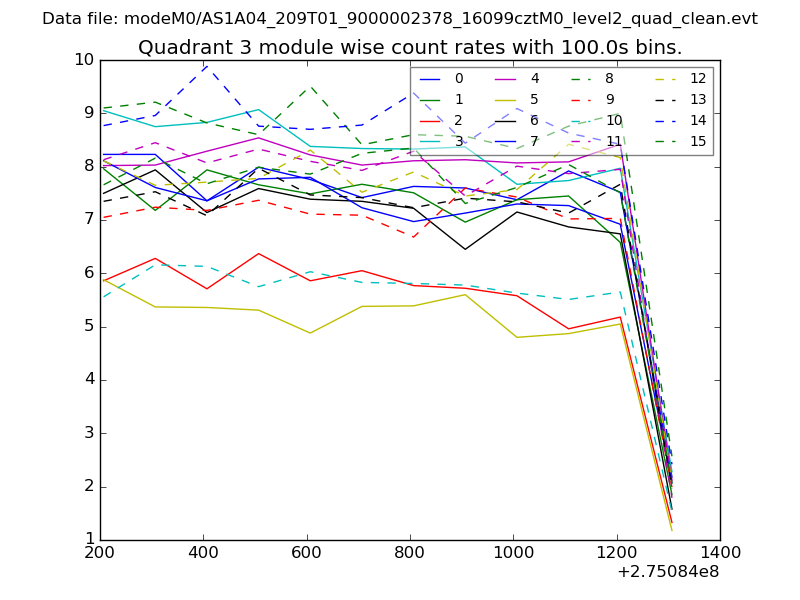
| Module-wise count rates for Quadrant A Data is divided into 100 sec bins |
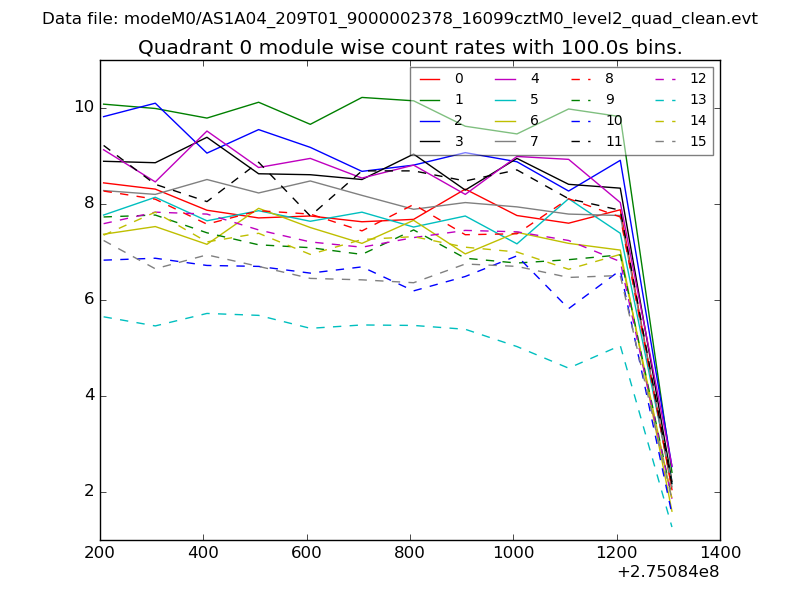 |
 |
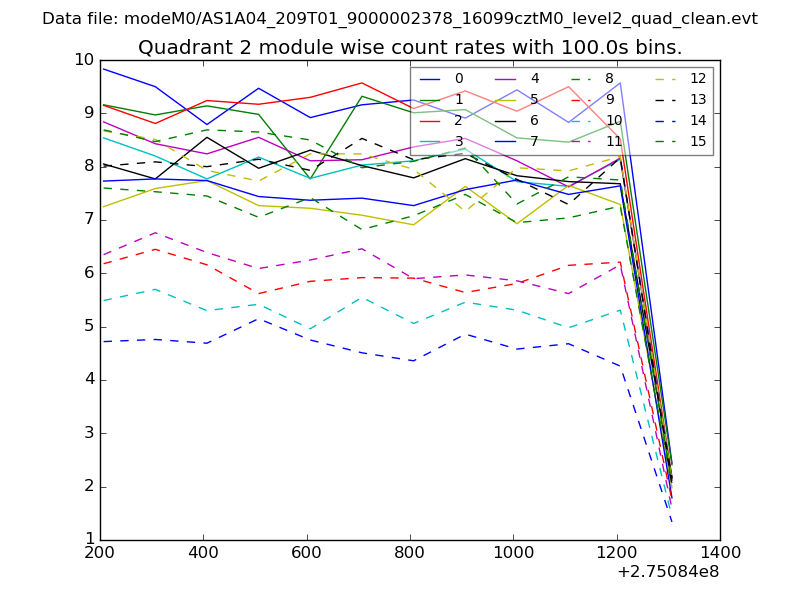
| Module-wise count rates for Quadrant B Data is divided into 100 sec bins |
 |
 |
| Module-wise count rates for Quadrant C Data is divided into 100 sec bins |
 |
 |
| Module-wise count rates for Quadrant D Data is divided into 100 sec bins |
 |
 |
| Parameter | Plot |
|---|---|
| CZT HV Monitor | 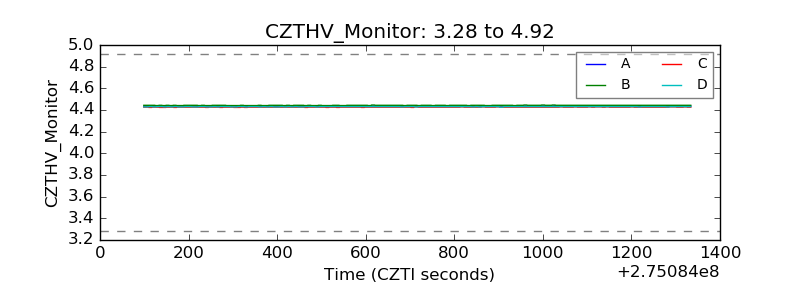 |
| D_VDD | 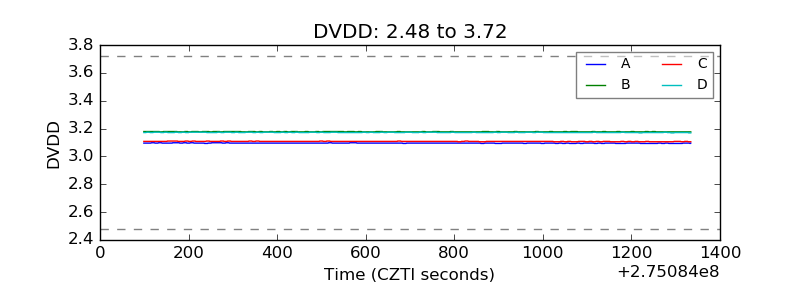 |
| Temperature 1 | 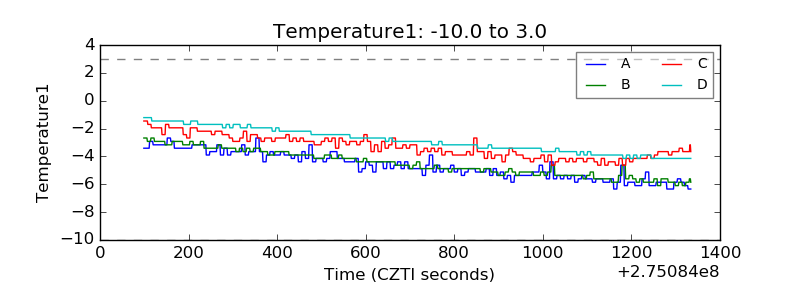 |
| Veto HV Monitor | 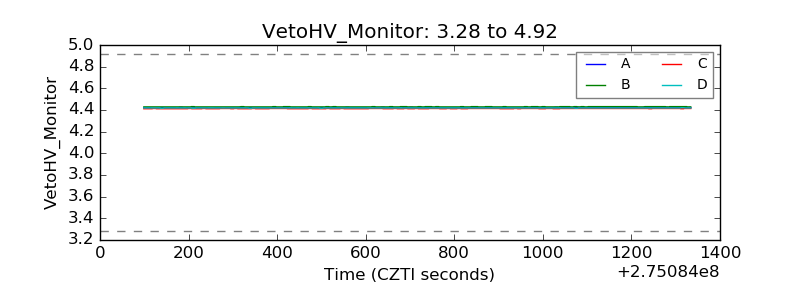 |
| Veto LLD | 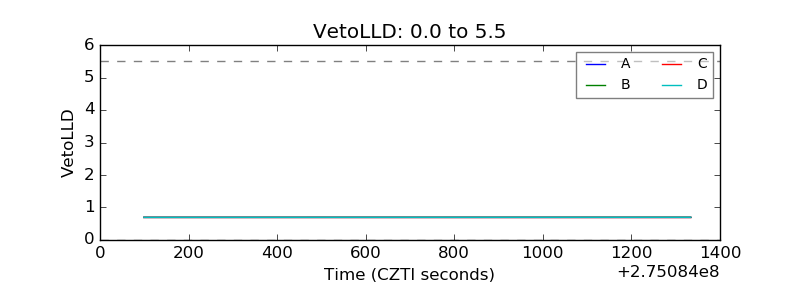 |
| Alpha Counter | 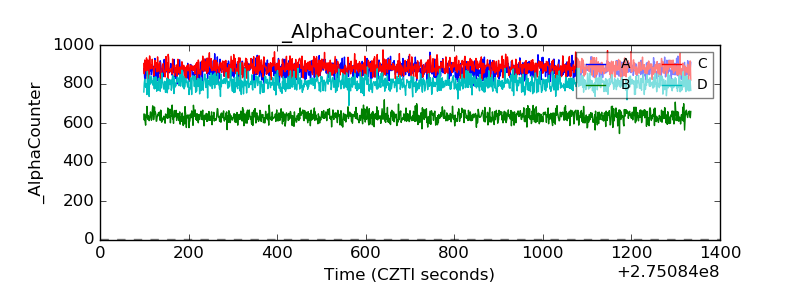 |
| _CPM_Rate | 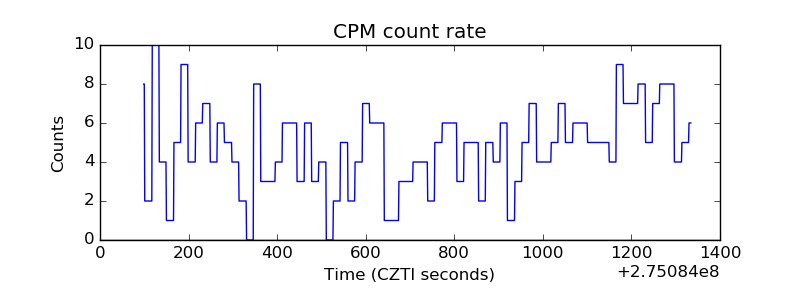 |
| CZT Counter | 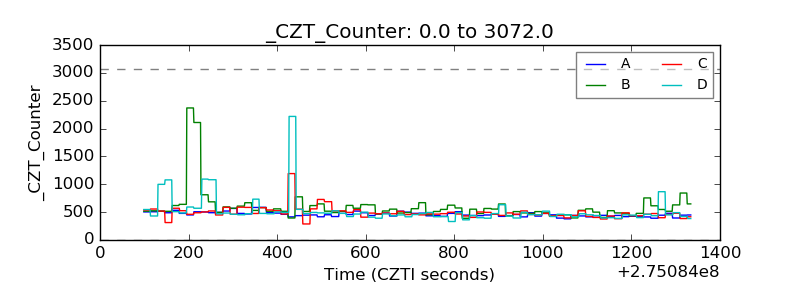 |
| +2.5 Volts monitor |  |
| +5 Volts monitor |  |
| _ROLL_ROT | 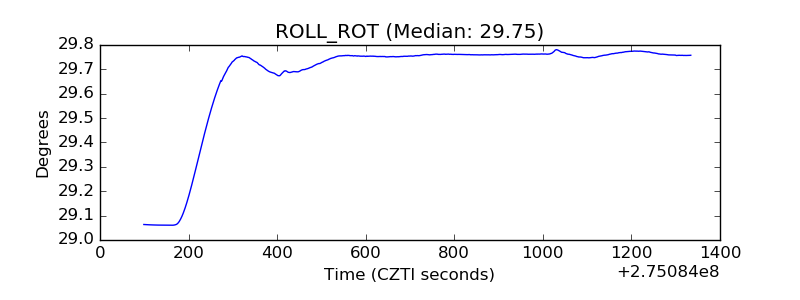 |
| _Roll_DEC |  |
| _Roll_RA | 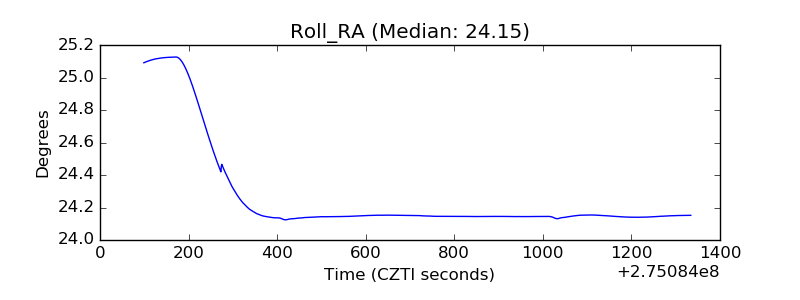 |
| Veto Counter | 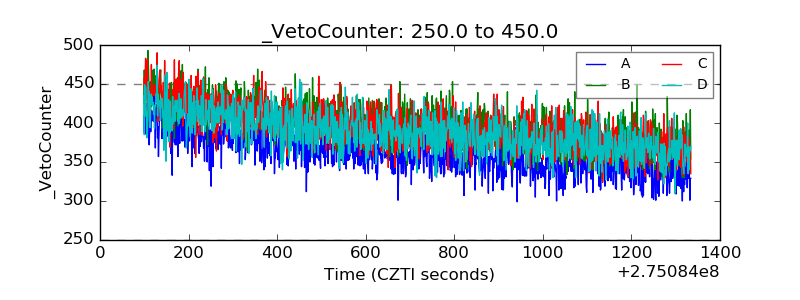 |