| Param | Original file | Final file |
|---|---|---|
| Filename | modeM0/AS1A04_209T01_9000002378_16100cztM0_level2.evt | modeM0/AS1A04_209T01_9000002378_16100cztM0_level2_quad_clean.evt |
| Size (bytes) | 519,209,280 | 93,787,200 |
| Size | 495.2 MB | 89.4 MB |
| Events in quadrant A | 4,032,546 | 585,605 |
| Events in quadrant B | 3,799,742 | 601,996 |
| Events in quadrant C | 3,752,005 | 572,392 |
| Events in quadrant D | 3,645,607 | 573,276 |
| Mode M0 | |||
|---|---|---|---|
| Quadrant | BADHDUFLAG | Total packets | Discarded packets |
| A | 0 | 16684 | 3 |
| B | 0 | 16167 | 2 |
| C | 0 | 15961 | 2 |
| D | 0 | 15997 | 2 |
| Mode M9 | |||
|---|---|---|---|
| Quadrant | BADHDUFLAG | Total packets | Discarded packets |
| A | 0 | 2 | 0 |
| B | 0 | 2 | 0 |
| C | 0 | 2 | 0 |
| D | 0 | 2 | 0 |
| Mode SS | |||
|---|---|---|---|
| Quadrant | BADHDUFLAG | Total packets | Discarded packets |
| A | 0 | 148 | 0 |
| B | 0 | 148 | 0 |
| C | 0 | 148 | 0 |
| D | 0 | 148 | 0 |
| Quadrant | Total seconds | Saturated seconds | Saturation percentage |
|---|---|---|---|
| A | 7277 | 262 | 3.600385% |
| B | 7277 | 158 | 2.171224% |
| C | 7277 | 227 | 3.119417% |
| D | 7277 | 111 | 1.525354% |
Noise dominated data is calculated using 1-second bins in cleaned event files. If a bin has >2000 counts, and if more than 50% of those come from <1% of pixels, then it is considered to be noise-dominated and hence unusable.
| Quadrant | # 1 sec bins | Bins with >0 counts | Bins with >2000 counts | High rate bins dominated by noise | Noise dominated (total time) | Noise dominated (detector-on time) | Marked lightcurve |
|---|---|---|---|---|---|---|---|
| A | 7528 | 7279 | 179 | 179 | 2.38% | 2.46% | 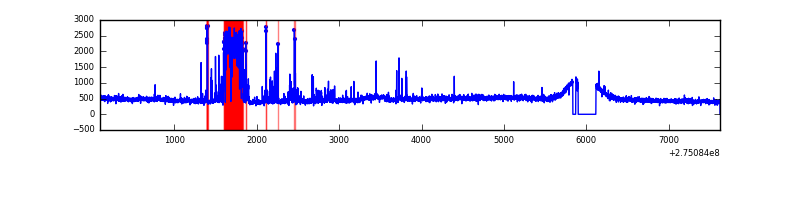 |
| B | 7528 | 7278 | 14 | 14 | 0.19% | 0.19% | 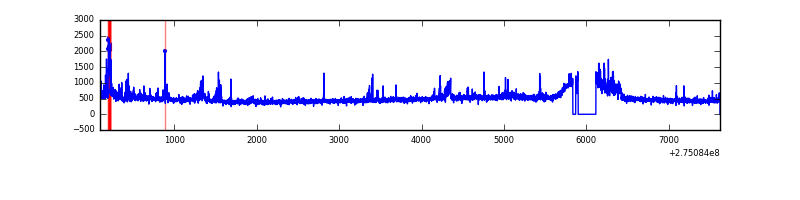 |
| C | 7528 | 7278 | 37 | 37 | 0.49% | 0.51% | 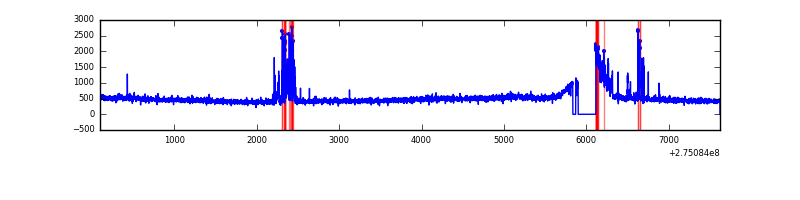 |
| D | 7528 | 7278 | 35 | 35 | 0.46% | 0.48% | 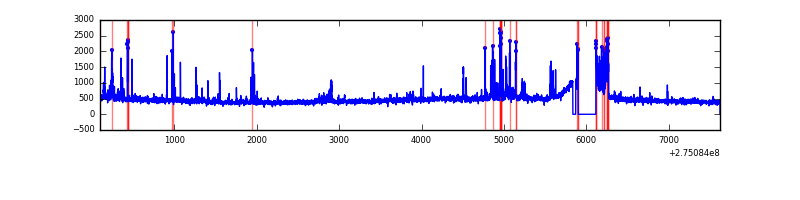 |
Top three noisy pixels from each quadrant. If the there are fewer than three noisy pixels in the level2.evt file, extra rows are filled as -1
| Pixel properties | Quadrant properties | ||||||
|---|---|---|---|---|---|---|---|
| Quadrant | DetID | PixID | Counts | Sigma | Mean | Median | Sigma |
| A | 15 | 174 | 614448 | 3440.33 | 868 | 847 | 178.4 |
| A | 15 | 239 | 55860 | 308.44 | 868 | 847 | 178.4 |
| A | 12 | 96 | 25118 | 136.08 | 868 | 847 | 178.4 |
| B | 0 | 189 | 184472 | 1064.39 | 880 | 859 | 172.5 |
| B | 7 | 220 | 61406 | 350.99 | 880 | 859 | 172.5 |
| B | 0 | 229 | 31315 | 176.55 | 880 | 859 | 172.5 |
| C | 9 | 236 | 183376 | 923.37 | 835 | 841 | 197.7 |
| C | 3 | 233 | 176433 | 888.25 | 835 | 841 | 197.7 |
| C | 14 | 238 | 126675 | 636.54 | 835 | 841 | 197.7 |
| D | 12 | 218 | 130812 | 615.55 | 854 | 829 | 211.2 |
| D | 7 | 38 | 107349 | 504.44 | 854 | 829 | 211.2 |
| D | 13 | 172 | 44743 | 207.96 | 854 | 829 | 211.2 |
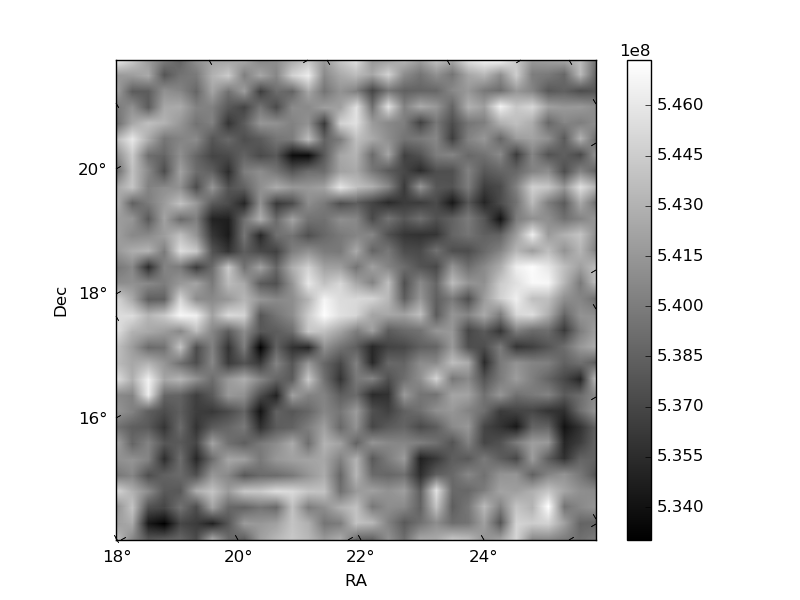
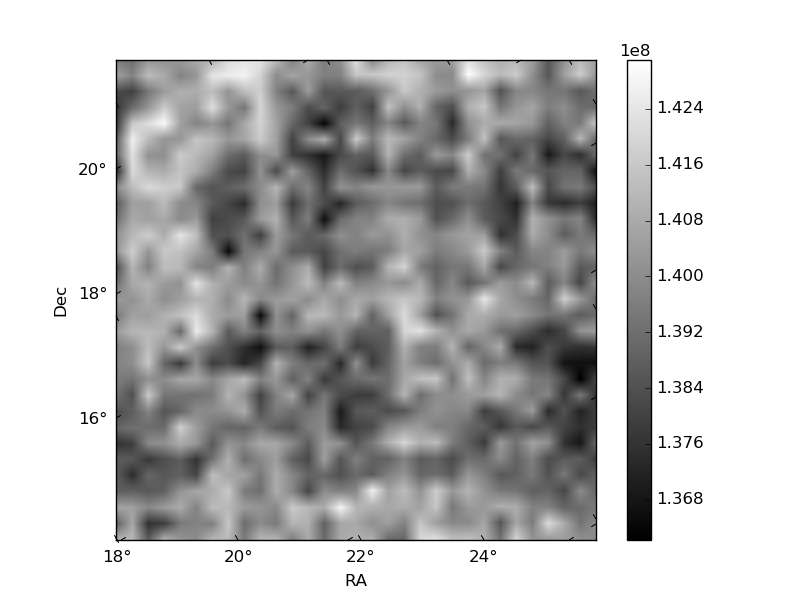
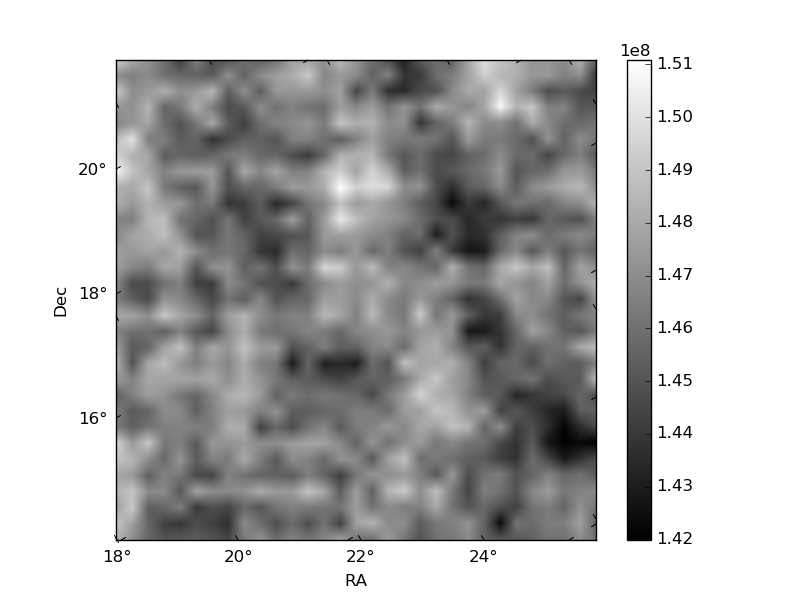
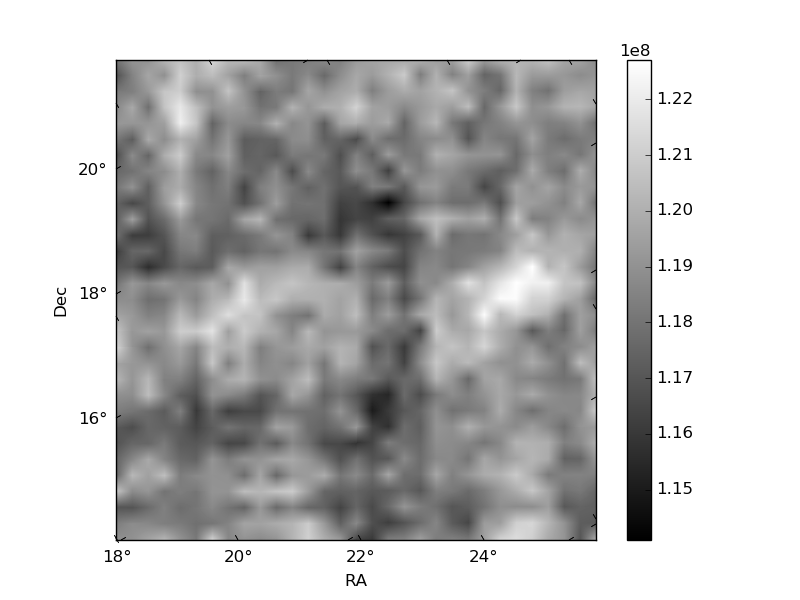
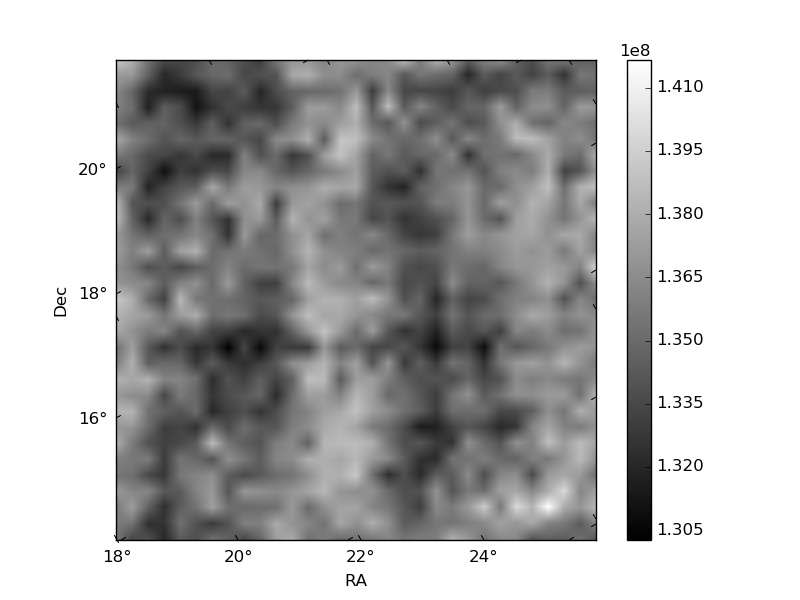
Histogram calculated using DETX and DETY for each event in the final _common_clean file
| Quadrant A | 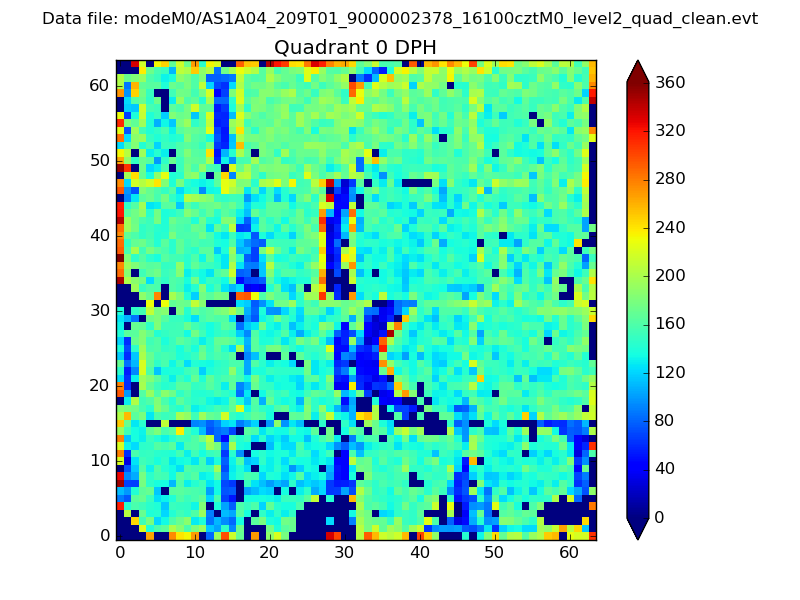 |
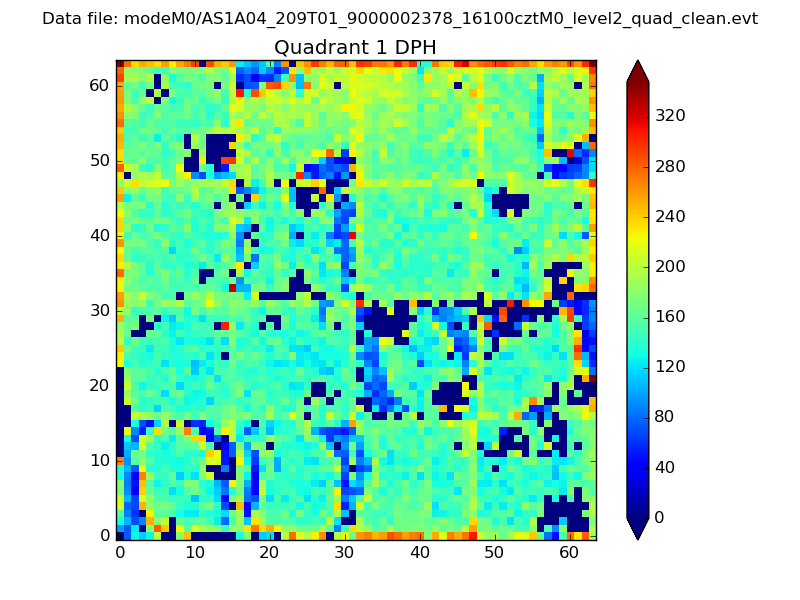 |
Quadrant B |
|---|---|---|---|
| Quadrant D | 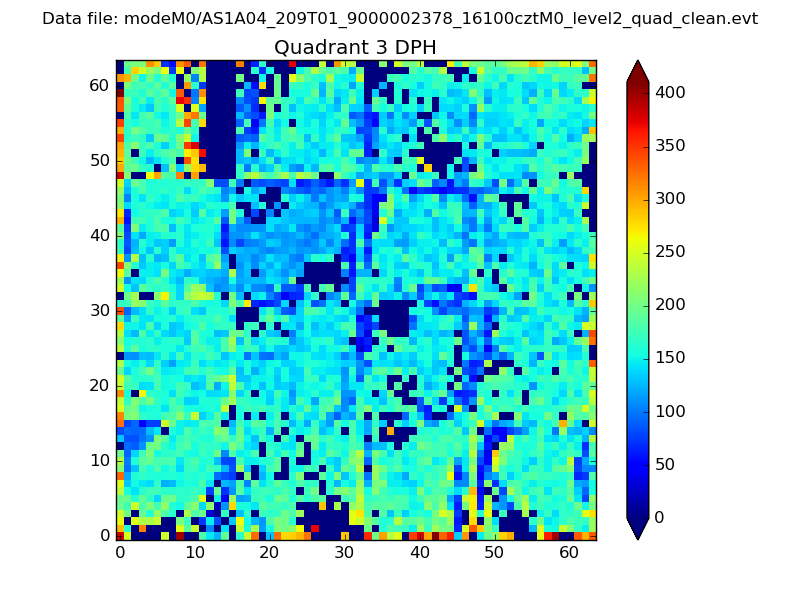 |
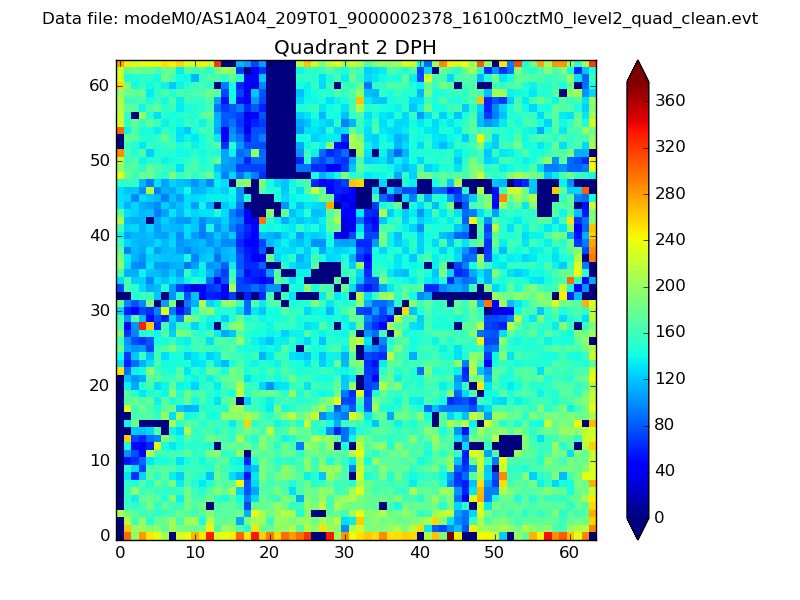 |
Quadrant C |
| Plot type | Count rate plots | Images |
|---|---|---|
| Comparison with Poisson distribution Blue bars denote a histogram of data divided into 1 sec bins. Red curve is a Poisson curve with rate = median count rate of data. |
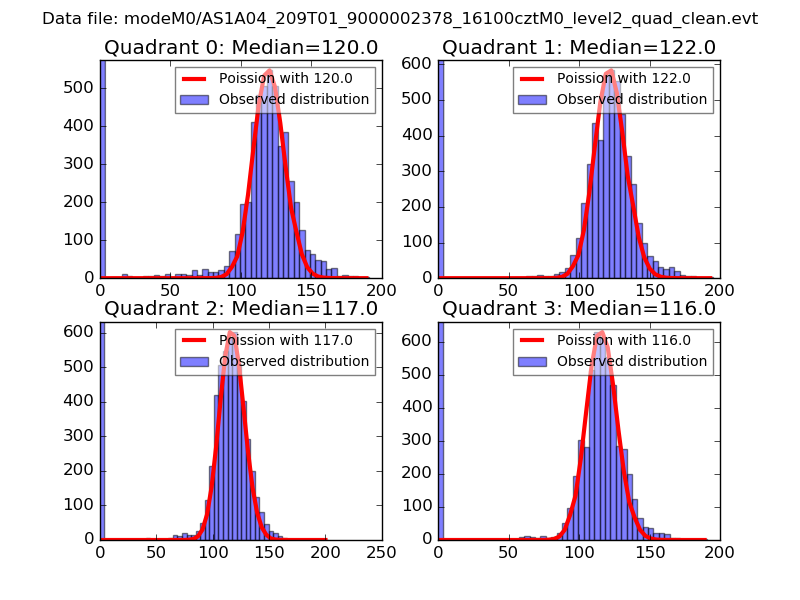 |
 |
| Quadrant-wise count rates Data is divided into 100 sec bins |
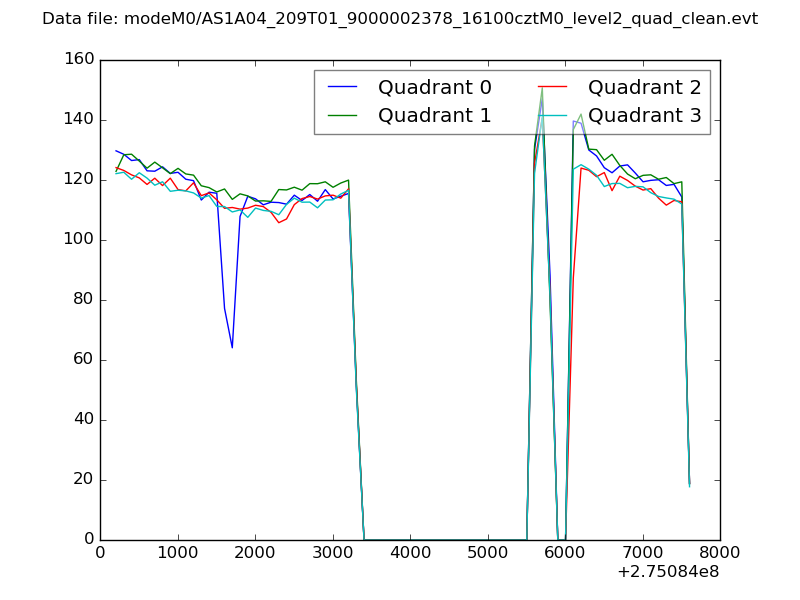 |
|
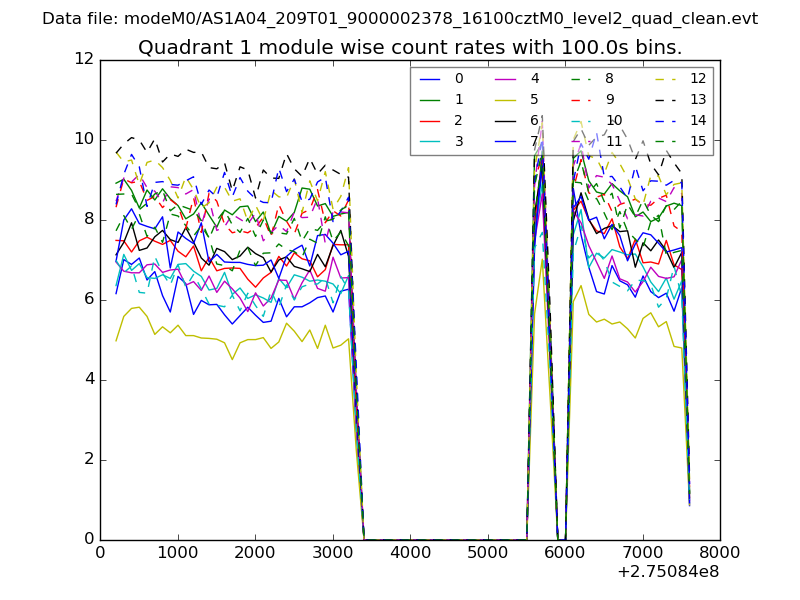
| Module-wise count rates for Quadrant A Data is divided into 100 sec bins |
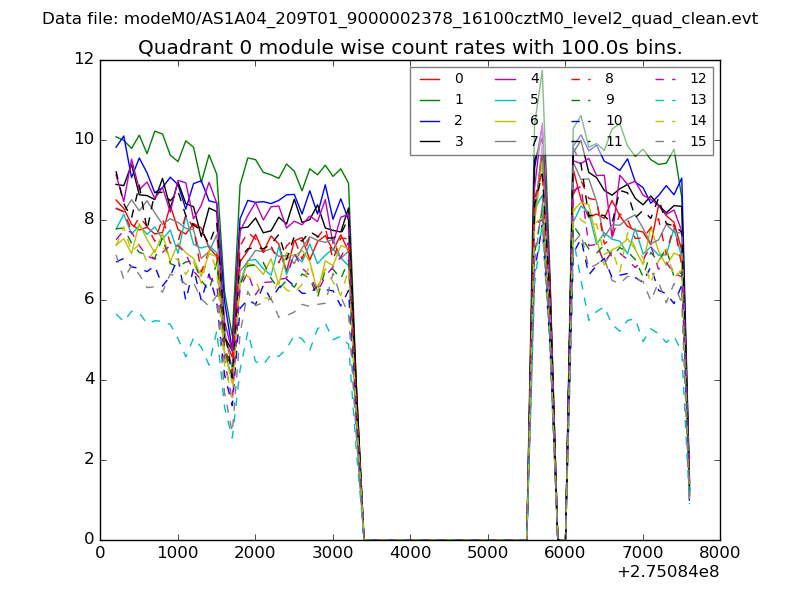 |
 |
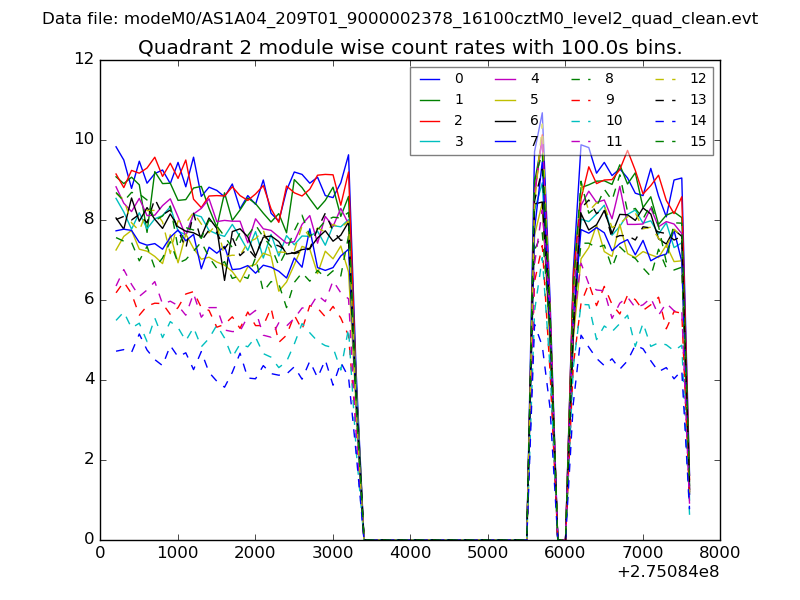
| Module-wise count rates for Quadrant B Data is divided into 100 sec bins |
 |
 |
| Module-wise count rates for Quadrant C Data is divided into 100 sec bins |
 |
 |
| Module-wise count rates for Quadrant D Data is divided into 100 sec bins |
 |
 |
| Parameter | Plot |
|---|---|
| CZT HV Monitor | 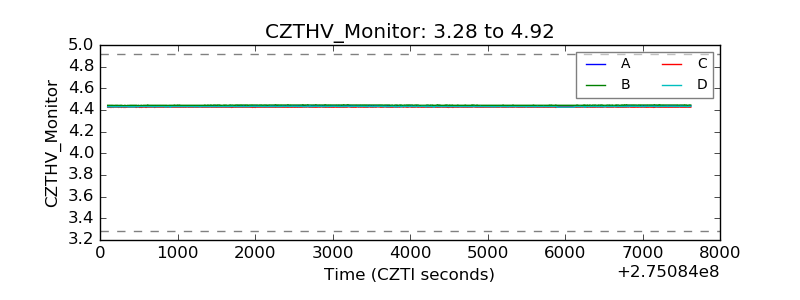 |
| D_VDD |  |
| Temperature 1 | 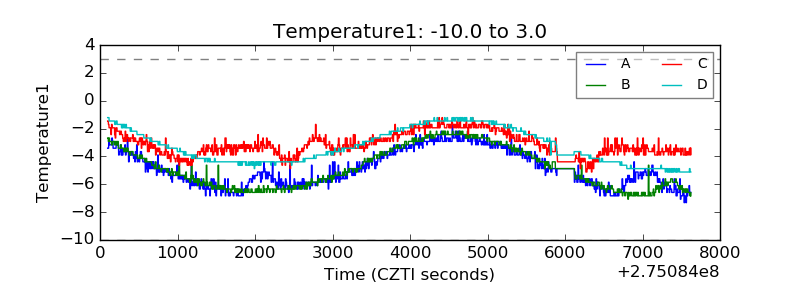 |
| Veto HV Monitor | 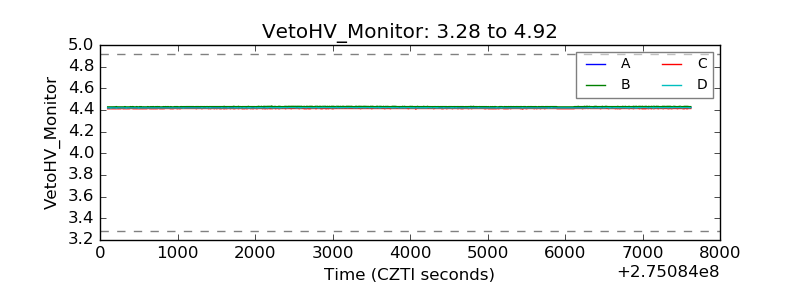 |
| Veto LLD |  |
| Alpha Counter | 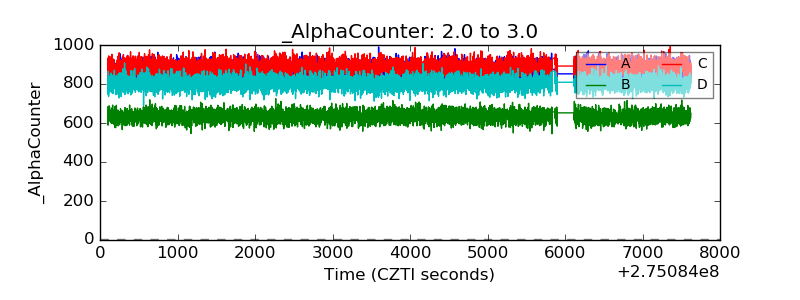 |
| _CPM_Rate | 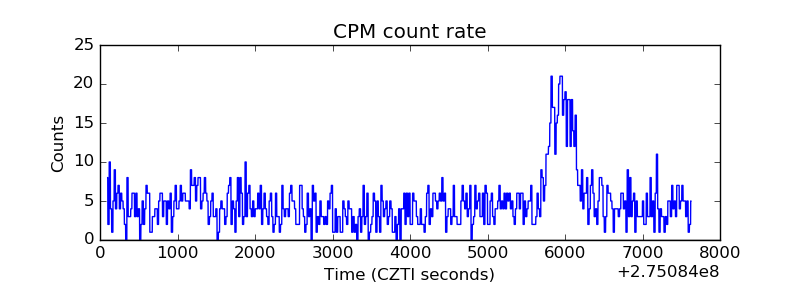 |
| CZT Counter | 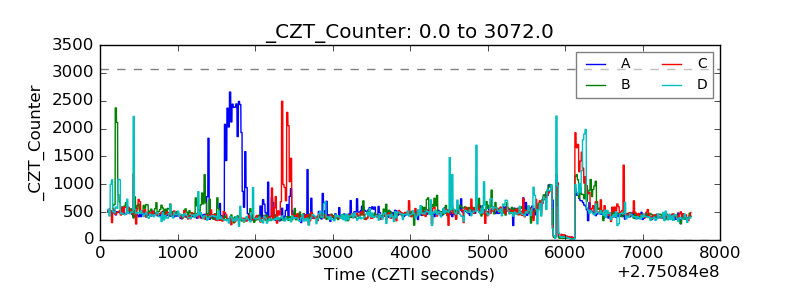 |
| +2.5 Volts monitor |  |
| +5 Volts monitor |  |
| _ROLL_ROT | 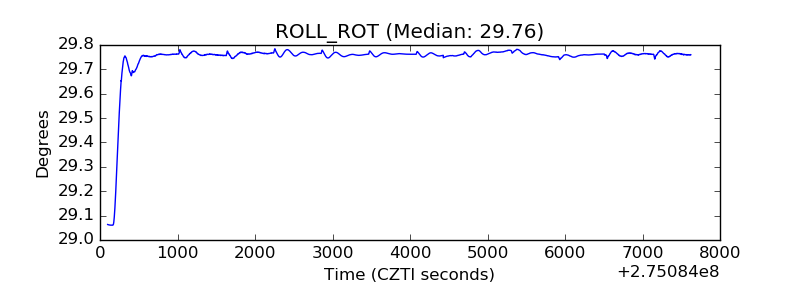 |
| _Roll_DEC | 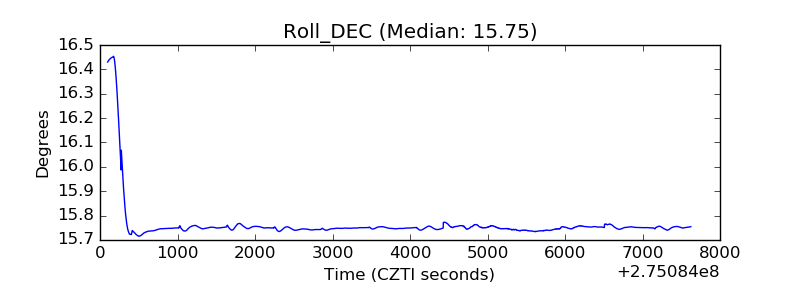 |
| _Roll_RA | 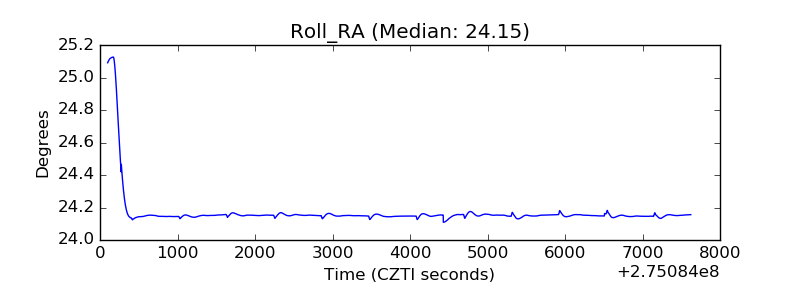 |
| Veto Counter |  |