| Param | Original file | Final file |
|---|---|---|
| Filename | modeM0/AS1A04_209T01_9000002378_16101cztM0_level2.evt | modeM0/AS1A04_209T01_9000002378_16101cztM0_level2_quad_clean.evt |
| Size (bytes) | 516,781,440 | 102,421,440 |
| Size | 492.8 MB | 97.7 MB |
| Events in quadrant A | 3,592,531 | 653,967 |
| Events in quadrant B | 3,959,055 | 660,339 |
| Events in quadrant C | 4,004,647 | 625,914 |
| Events in quadrant D | 3,576,062 | 630,803 |
| Mode M0 | |||
|---|---|---|---|
| Quadrant | BADHDUFLAG | Total packets | Discarded packets |
| A | 0 | 15990 | 4 |
| B | 0 | 17022 | 3 |
| C | 0 | 17070 | 3 |
| D | 0 | 16231 | 3 |
| Mode M9 | |||
|---|---|---|---|
| Quadrant | BADHDUFLAG | Total packets | Discarded packets |
| A | 0 | 6 | 0 |
| B | 0 | 6 | 0 |
| C | 0 | 6 | 0 |
| D | 0 | 6 | 0 |
| Mode SS | |||
|---|---|---|---|
| Quadrant | BADHDUFLAG | Total packets | Discarded packets |
| A | 0 | 158 | 0 |
| B | 0 | 158 | 0 |
| C | 0 | 158 | 0 |
| D | 0 | 158 | 0 |
| Quadrant | Total seconds | Saturated seconds | Saturation percentage |
|---|---|---|---|
| A | 7624 | 126 | 1.652676% |
| B | 7624 | 218 | 2.859391% |
| C | 7624 | 298 | 3.908709% |
| D | 7624 | 111 | 1.455929% |
Noise dominated data is calculated using 1-second bins in cleaned event files. If a bin has >2000 counts, and if more than 50% of those come from <1% of pixels, then it is considered to be noise-dominated and hence unusable.
| Quadrant | # 1 sec bins | Bins with >0 counts | Bins with >2000 counts | High rate bins dominated by noise | Noise dominated (total time) | Noise dominated (detector-on time) | Marked lightcurve |
|---|---|---|---|---|---|---|---|
| A | 8255 | 7626 | 0 | 0 | 0.00% | 0.00% | 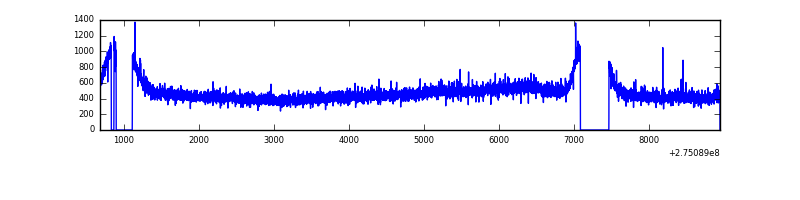 |
| B | 8255 | 7625 | 6 | 6 | 0.07% | 0.08% | 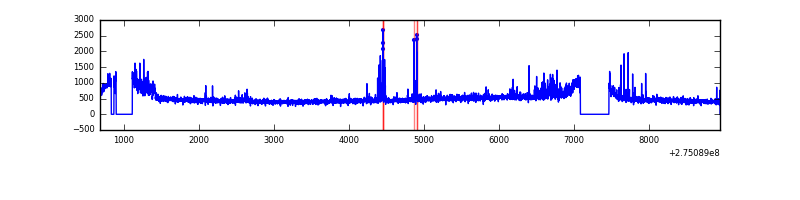 |
| C | 8255 | 7625 | 43 | 43 | 0.52% | 0.56% | 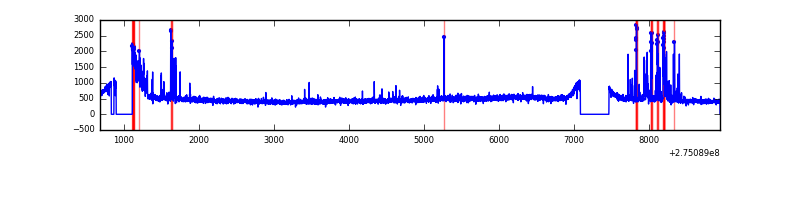 |
| D | 8255 | 7625 | 16 | 16 | 0.19% | 0.21% | 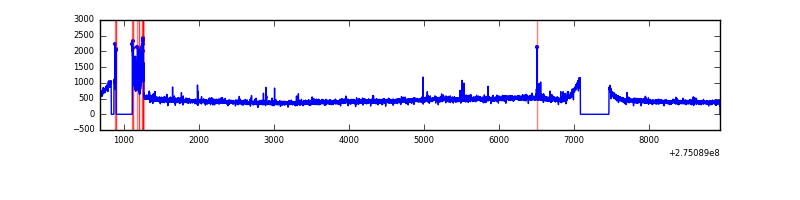 |
Top three noisy pixels from each quadrant. If the there are fewer than three noisy pixels in the level2.evt file, extra rows are filled as -1
| Pixel properties | Quadrant properties | ||||||
|---|---|---|---|---|---|---|---|
| Quadrant | DetID | PixID | Counts | Sigma | Mean | Median | Sigma |
| A | 15 | 239 | 18659 | 92.76 | 927 | 905 | 191.4 |
| A | 0 | 253 | 9373 | 44.24 | 927 | 905 | 191.4 |
| A | 0 | 226 | 8047 | 37.31 | 927 | 905 | 191.4 |
| B | 0 | 189 | 181817 | 992.69 | 929 | 903 | 182.2 |
| B | 15 | 201 | 36469 | 195.15 | 929 | 903 | 182.2 |
| B | 0 | 229 | 22282 | 117.31 | 929 | 903 | 182.2 |
| C | 9 | 236 | 258498 | 1217.61 | 884 | 889 | 211.6 |
| C | 3 | 233 | 161319 | 758.28 | 884 | 889 | 211.6 |
| C | 14 | 238 | 133220 | 625.47 | 884 | 889 | 211.6 |
| D | 12 | 218 | 102692 | 454.24 | 906 | 876 | 224.1 |
| D | 2 | 234 | 30978 | 134.29 | 906 | 876 | 224.1 |
| D | 5 | 222 | 18247 | 77.5 | 906 | 876 | 224.1 |
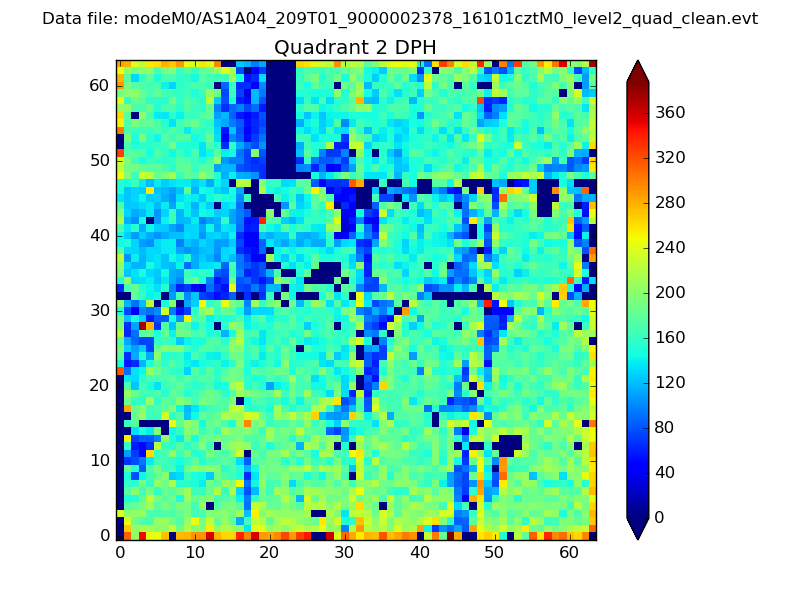
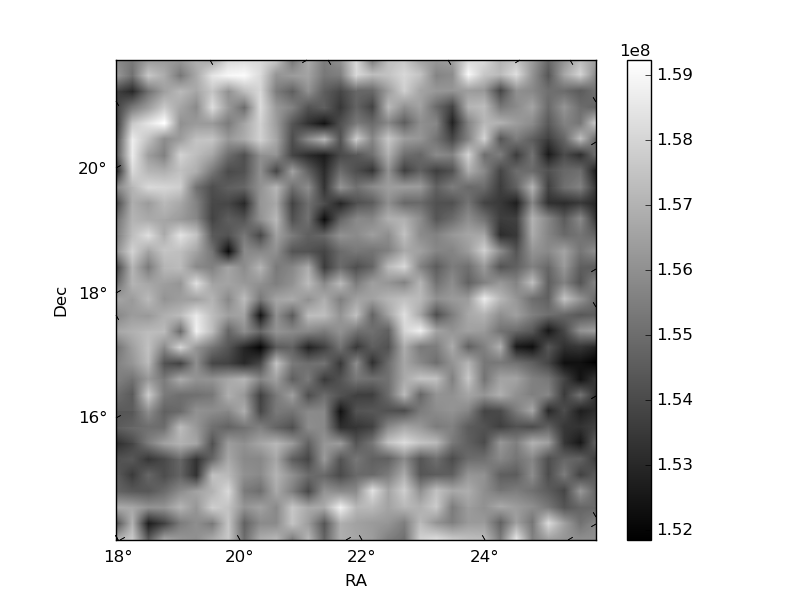
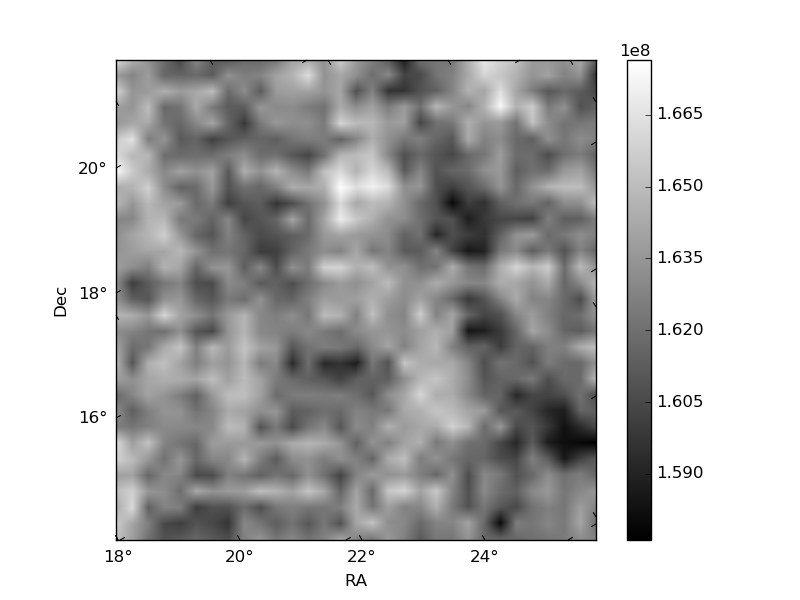
Histogram calculated using DETX and DETY for each event in the final _common_clean file
| Quadrant A |  |
 |
Quadrant B |
|---|---|---|---|
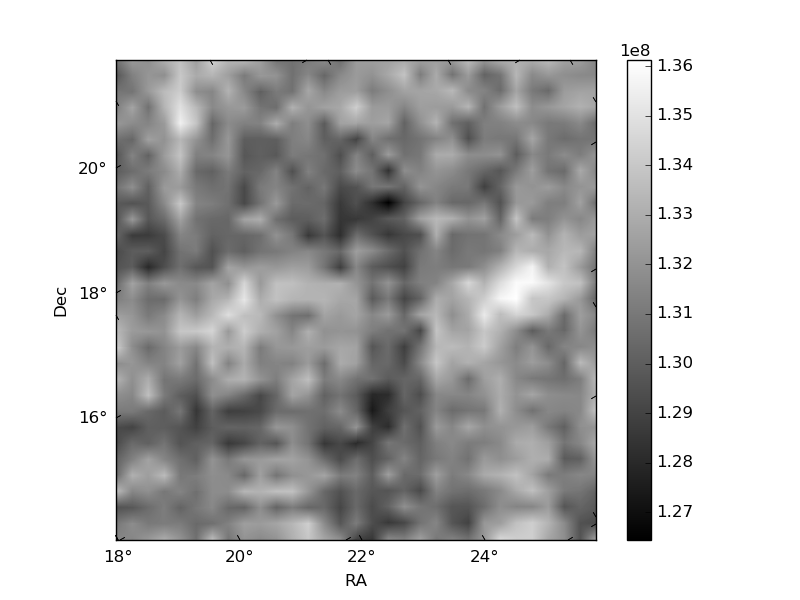
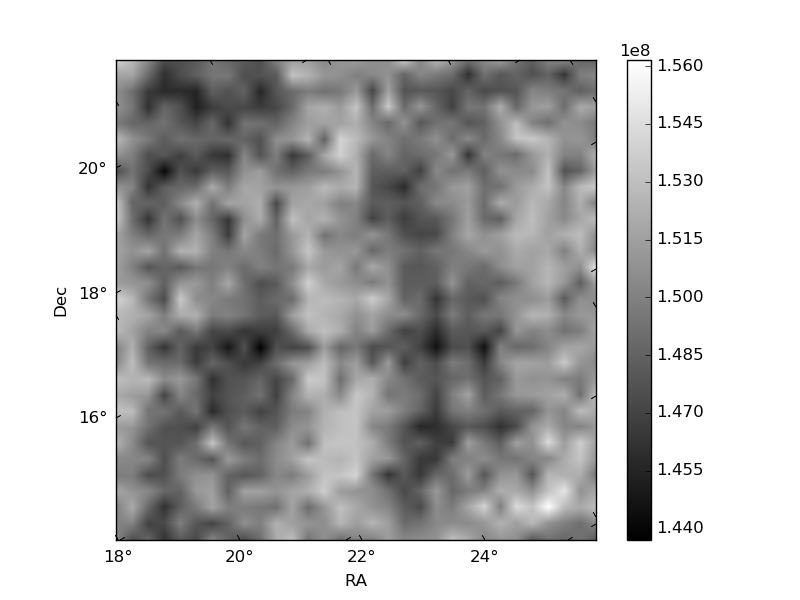
| Quadrant D |  |
 |
Quadrant C |
| Plot type | Count rate plots | Images |
|---|---|---|
| Comparison with Poisson distribution Blue bars denote a histogram of data divided into 1 sec bins. Red curve is a Poisson curve with rate = median count rate of data. |
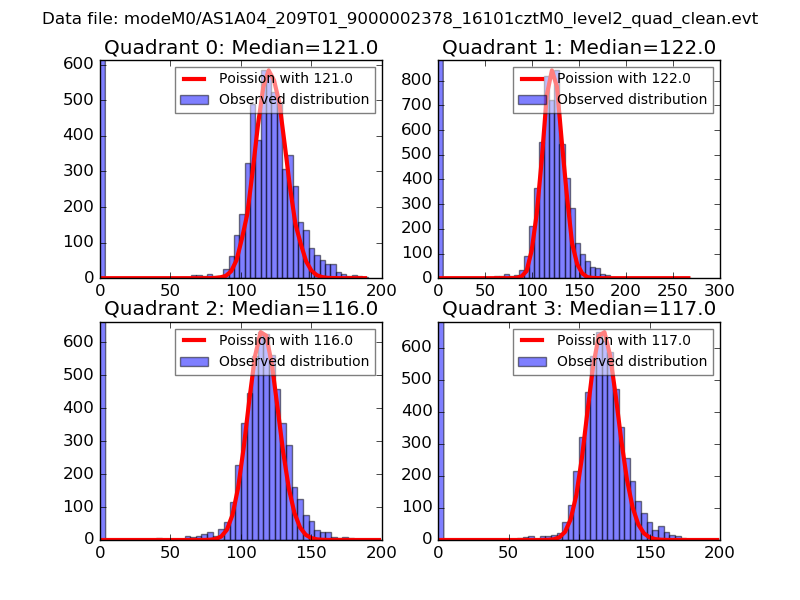 |
 |
| Quadrant-wise count rates Data is divided into 100 sec bins |
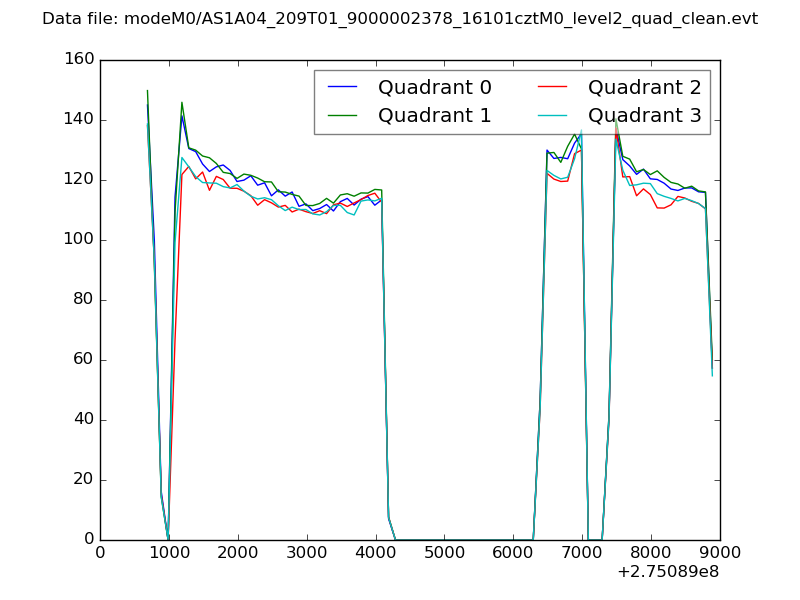 |
|
| Module-wise count rates for Quadrant A Data is divided into 100 sec bins |
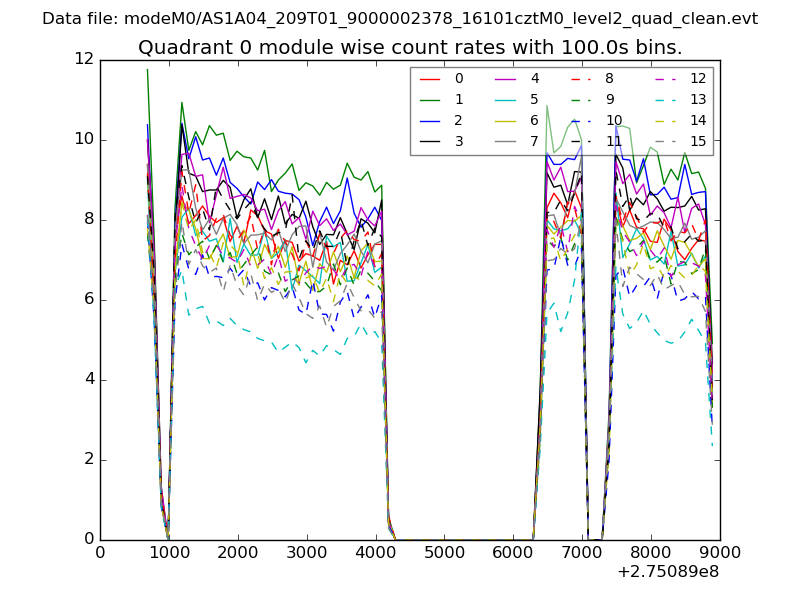 |
 |
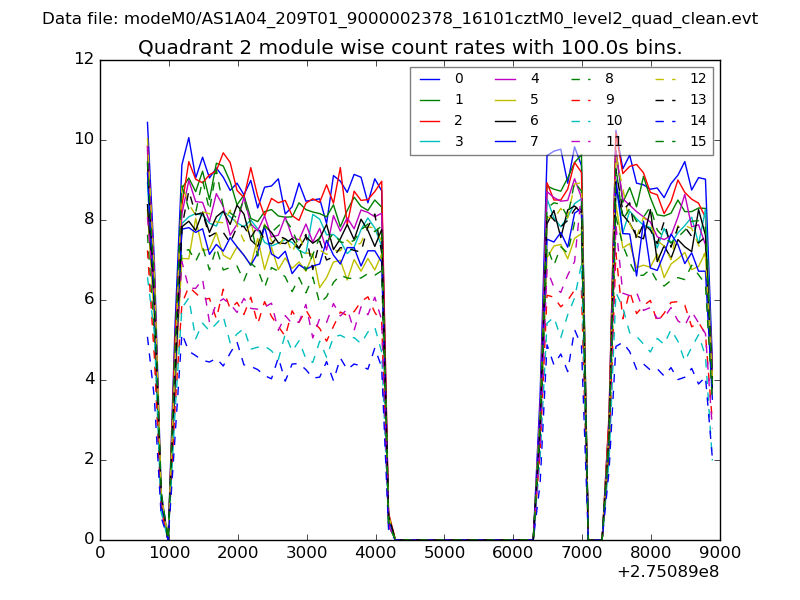
| Module-wise count rates for Quadrant B Data is divided into 100 sec bins |
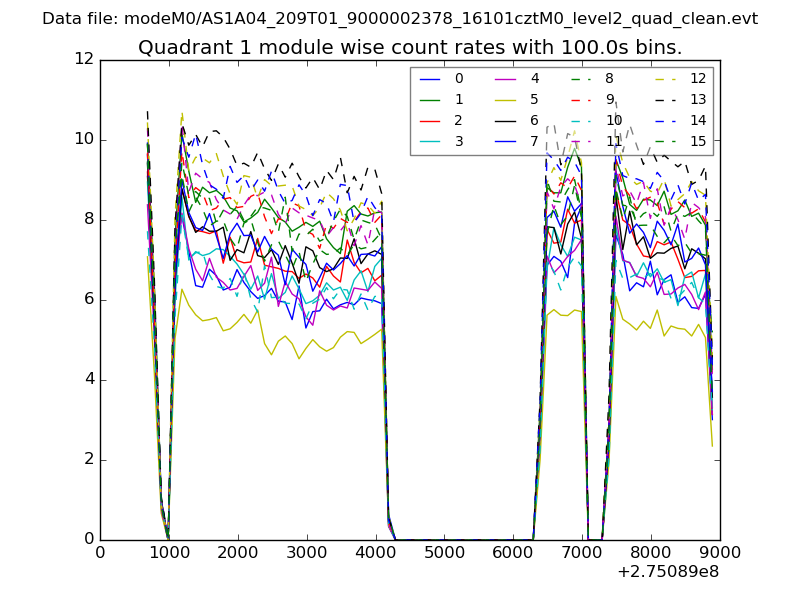 |
 |
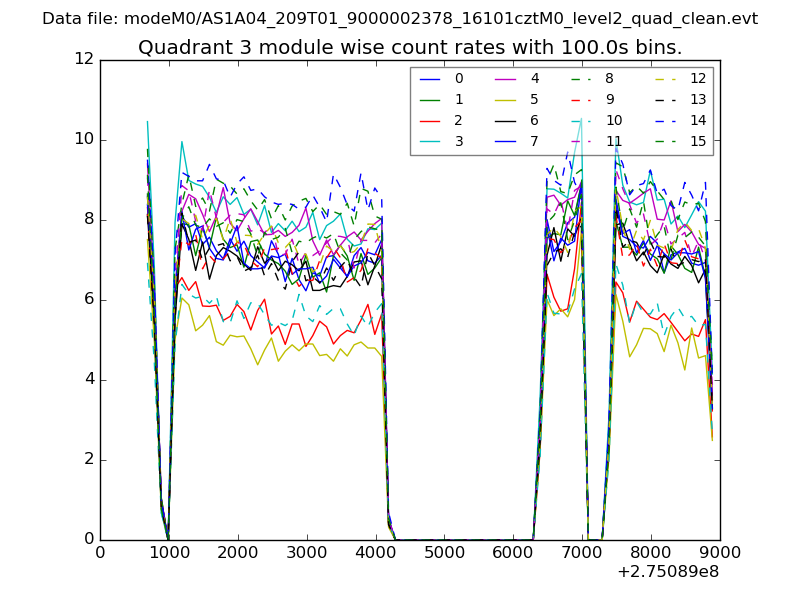
| Module-wise count rates for Quadrant C Data is divided into 100 sec bins |
 |
 |
| Module-wise count rates for Quadrant D Data is divided into 100 sec bins |
 |
 |
| Parameter | Plot |
|---|---|
| CZT HV Monitor | 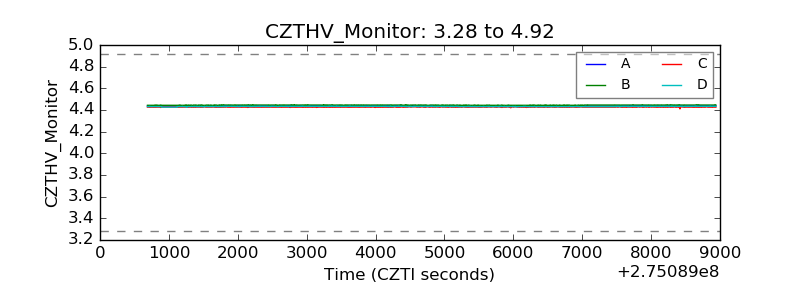 |
| D_VDD | 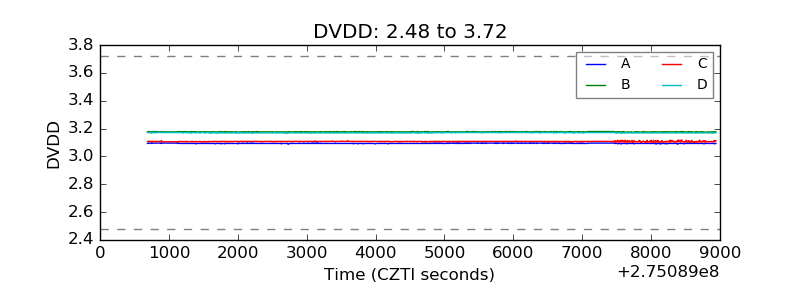 |
| Temperature 1 | 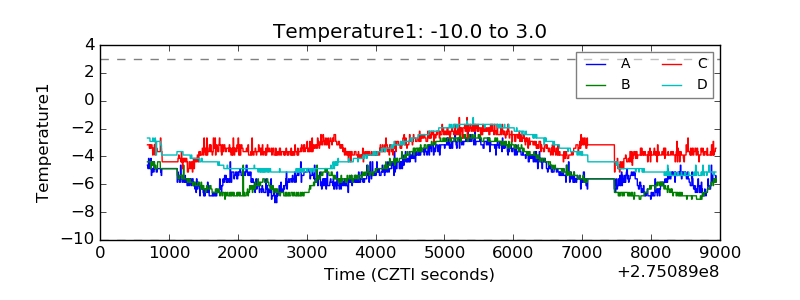 |
| Veto HV Monitor | 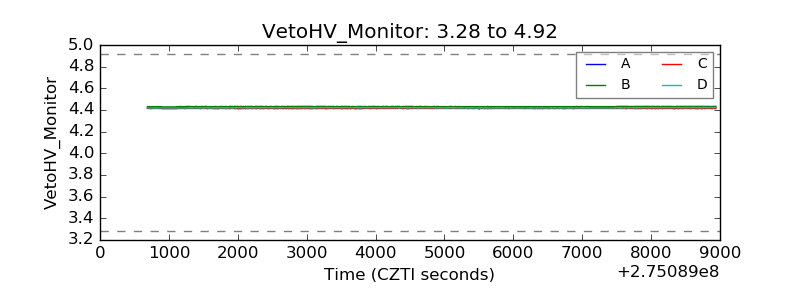 |
| Veto LLD | 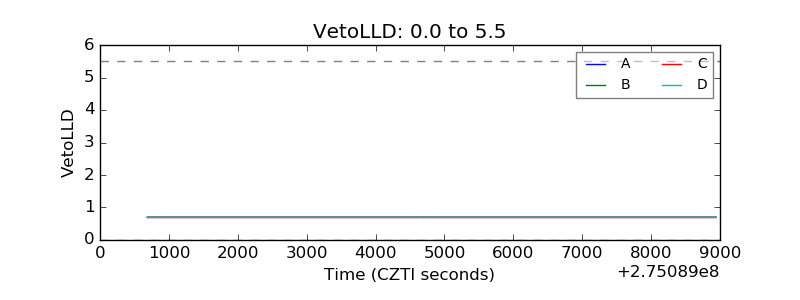 |
| Alpha Counter | 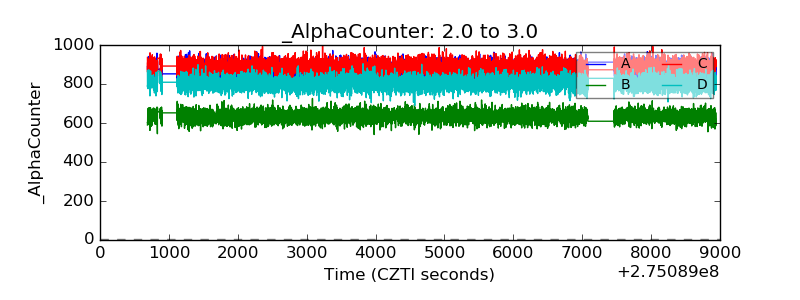 |
| _CPM_Rate | 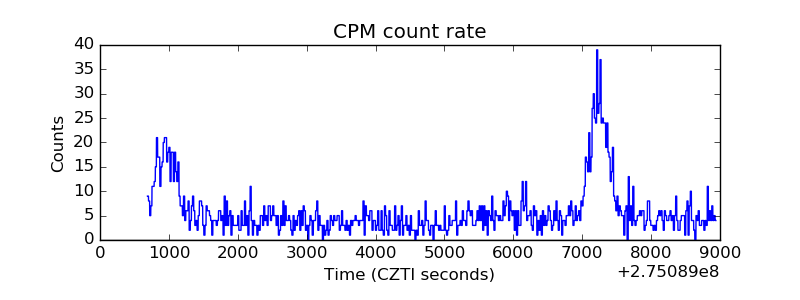 |
| CZT Counter | 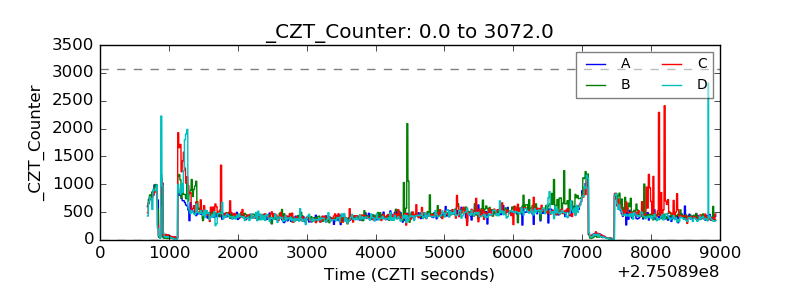 |
| +2.5 Volts monitor |  |
| +5 Volts monitor | 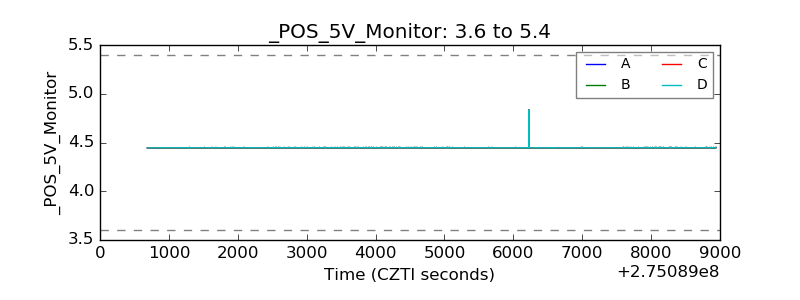 |
| _ROLL_ROT | 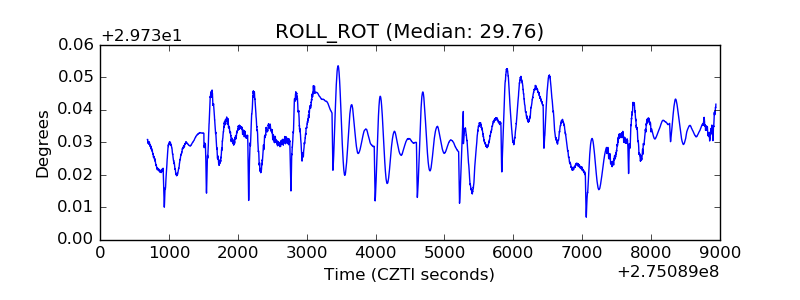 |
| _Roll_DEC | 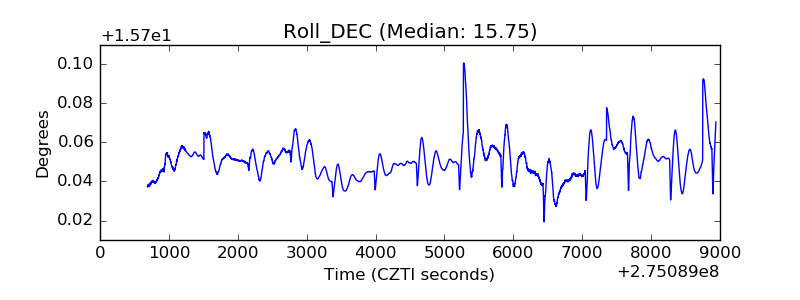 |
| _Roll_RA | 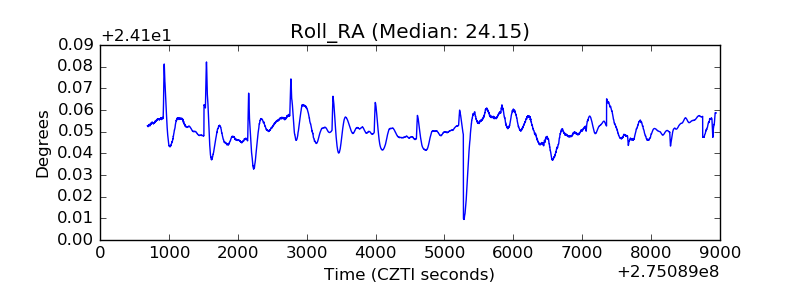 |
| Veto Counter | 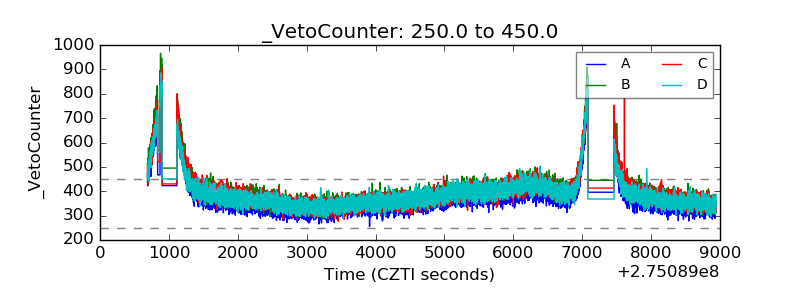 |