| Param | Original file | Final file |
|---|---|---|
| Filename | modeM0/AS1A04_209T01_9000002378_16104cztM0_level2.evt | modeM0/AS1A04_209T01_9000002378_16104cztM0_level2_quad_clean.evt |
| Size (bytes) | 537,848,640 | 109,874,880 |
| Size | 512.9 MB | 104.8 MB |
| Events in quadrant A | 3,714,894 | 704,241 |
| Events in quadrant B | 4,575,917 | 709,239 |
| Events in quadrant C | 3,837,502 | 682,766 |
| Events in quadrant D | 3,621,737 | 679,644 |
| Mode M0 | |||
|---|---|---|---|
| Quadrant | BADHDUFLAG | Total packets | Discarded packets |
| A | 0 | 16144 | 3 |
| B | 0 | 18708 | 2 |
| C | 0 | 16434 | 2 |
| D | 0 | 16223 | 2 |
| Mode M9 | |||
|---|---|---|---|
| Quadrant | BADHDUFLAG | Total packets | Discarded packets |
| A | 0 | 15 | 0 |
| B | 0 | 15 | 0 |
| C | 0 | 15 | 0 |
| D | 0 | 15 | 0 |
| Mode SS | |||
|---|---|---|---|
| Quadrant | BADHDUFLAG | Total packets | Discarded packets |
| A | 0 | 164 | 0 |
| B | 0 | 164 | 0 |
| C | 0 | 164 | 0 |
| D | 0 | 164 | 0 |
| Quadrant | Total seconds | Saturated seconds | Saturation percentage |
|---|---|---|---|
| A | 7932 | 51 | 0.642965% |
| B | 7932 | 183 | 2.307110% |
| C | 7932 | 85 | 1.071609% |
| D | 7932 | 32 | 0.403429% |
Noise dominated data is calculated using 1-second bins in cleaned event files. If a bin has >2000 counts, and if more than 50% of those come from <1% of pixels, then it is considered to be noise-dominated and hence unusable.
| Quadrant | # 1 sec bins | Bins with >0 counts | Bins with >2000 counts | High rate bins dominated by noise | Noise dominated (total time) | Noise dominated (detector-on time) | Marked lightcurve |
|---|---|---|---|---|---|---|---|
| A | 9508 | 7933 | 0 | 0 | 0.00% | 0.00% | 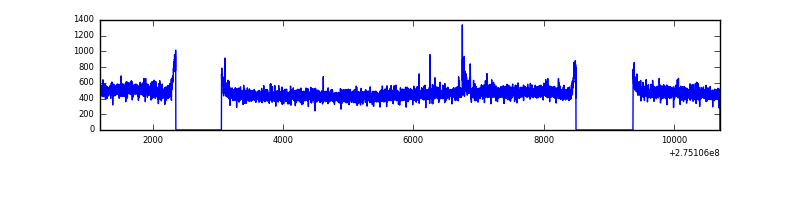 |
| B | 9508 | 7933 | 92 | 92 | 0.97% | 1.16% | 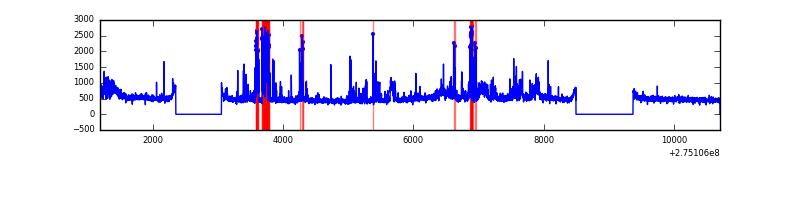 |
| C | 9508 | 7933 | 5 | 5 | 0.05% | 0.06% | 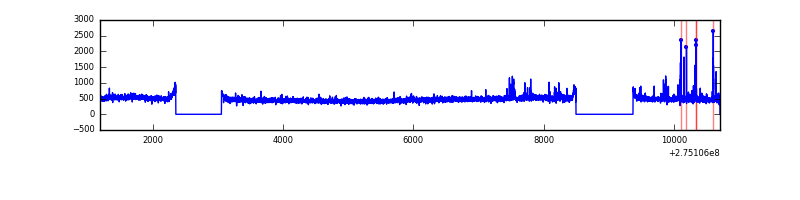 |
| D | 9508 | 7933 | 2 | 2 | 0.02% | 0.03% | 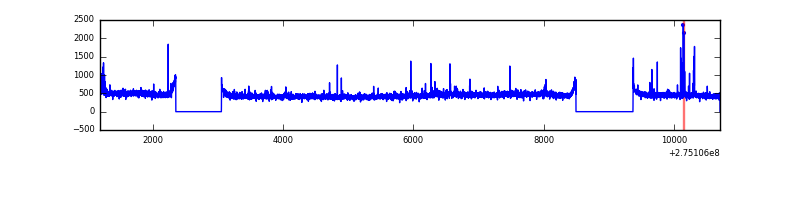 |
Top three noisy pixels from each quadrant. If the there are fewer than three noisy pixels in the level2.evt file, extra rows are filled as -1
| Pixel properties | Quadrant properties | ||||||
|---|---|---|---|---|---|---|---|
| Quadrant | DetID | PixID | Counts | Sigma | Mean | Median | Sigma |
| A | 15 | 239 | 22185 | 108.91 | 960 | 939 | 195.1 |
| A | 0 | 226 | 8197 | 37.2 | 960 | 939 | 195.1 |
| A | 12 | 194 | 7130 | 31.73 | 960 | 939 | 195.1 |
| B | 4 | 173 | 546159 | 2935.6 | 955 | 928 | 185.7 |
| B | 0 | 189 | 264715 | 1420.26 | 955 | 928 | 185.7 |
| B | 12 | 111 | 22241 | 114.75 | 955 | 928 | 185.7 |
| C | 14 | 238 | 137636 | 632.66 | 918 | 923 | 216.1 |
| C | 9 | 236 | 90707 | 415.49 | 918 | 923 | 216.1 |
| C | 0 | 207 | 11407 | 48.52 | 918 | 923 | 216.1 |
| D | 13 | 112 | 30032 | 127.41 | 936 | 908 | 228.6 |
| D | 2 | 234 | 28939 | 122.63 | 936 | 908 | 228.6 |
| D | 13 | 172 | 23437 | 98.56 | 936 | 908 | 228.6 |
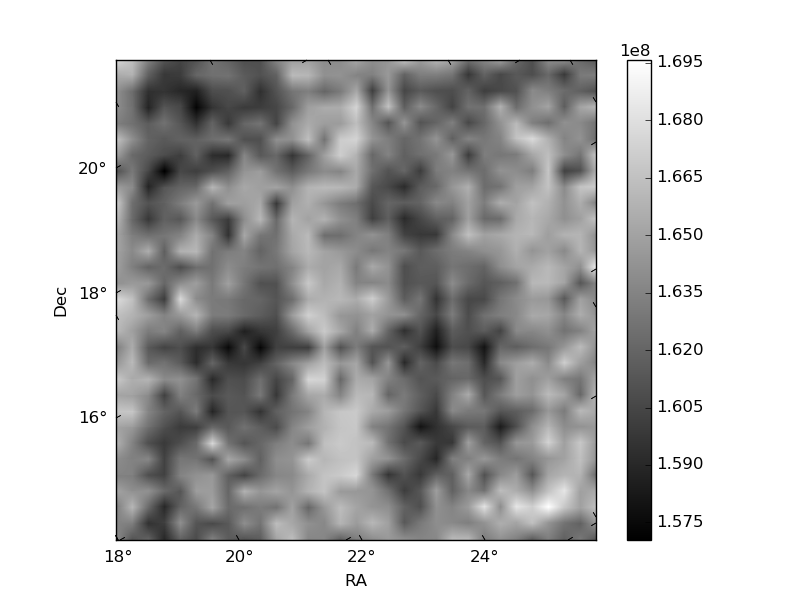
Histogram calculated using DETX and DETY for each event in the final _common_clean file
| Quadrant A | 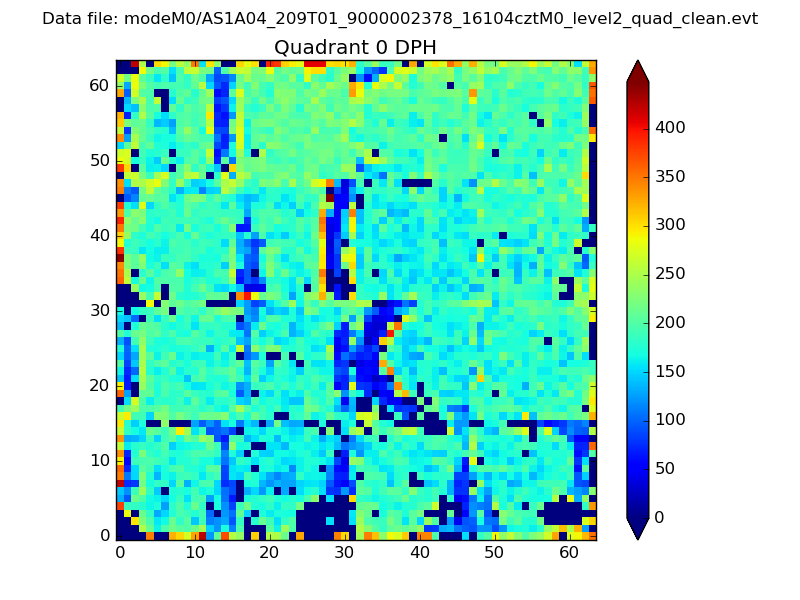 |
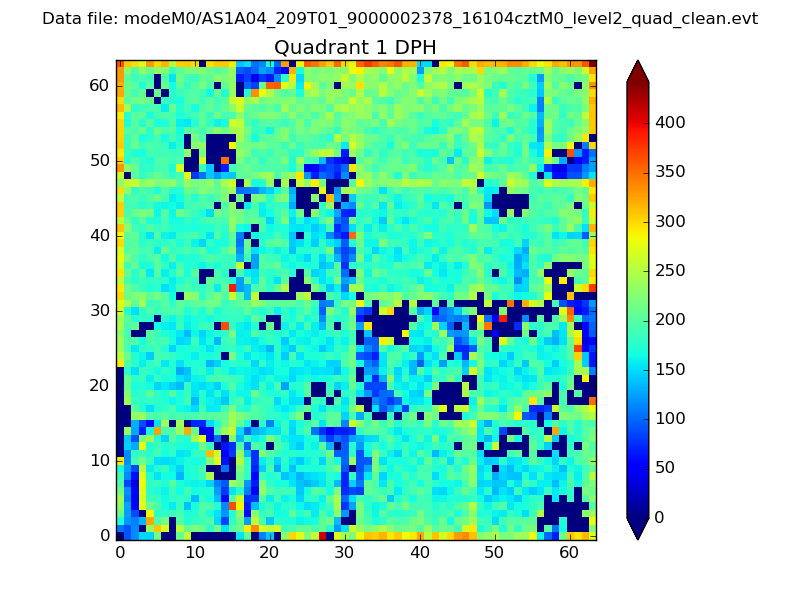 |
Quadrant B |
|---|---|---|---|
| Quadrant D | 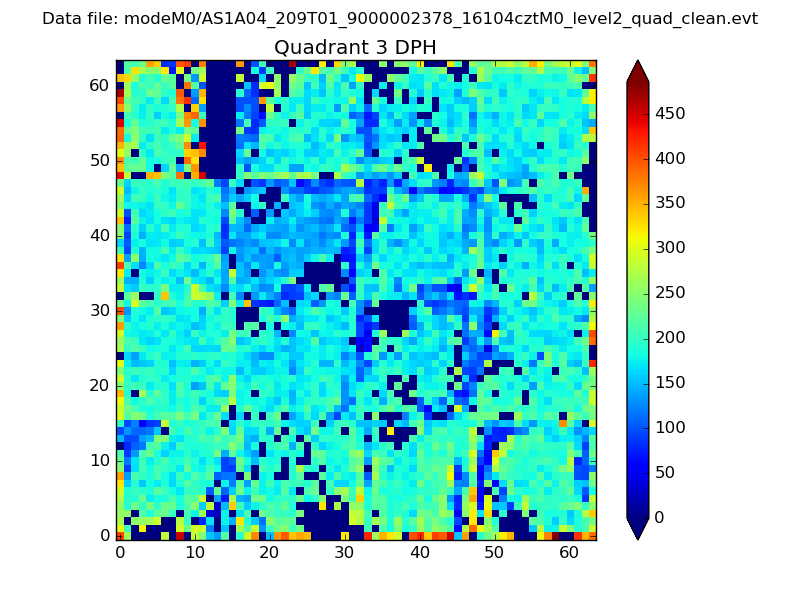 |
 |
Quadrant C |
| Plot type | Count rate plots | Images |
|---|---|---|
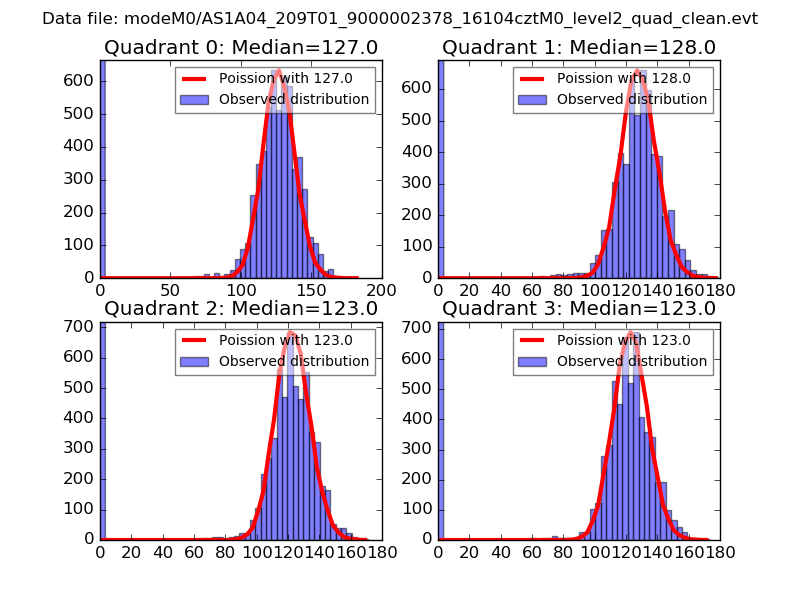
| Comparison with Poisson distribution Blue bars denote a histogram of data divided into 1 sec bins. Red curve is a Poisson curve with rate = median count rate of data. |
 |
 |
| Quadrant-wise count rates Data is divided into 100 sec bins |
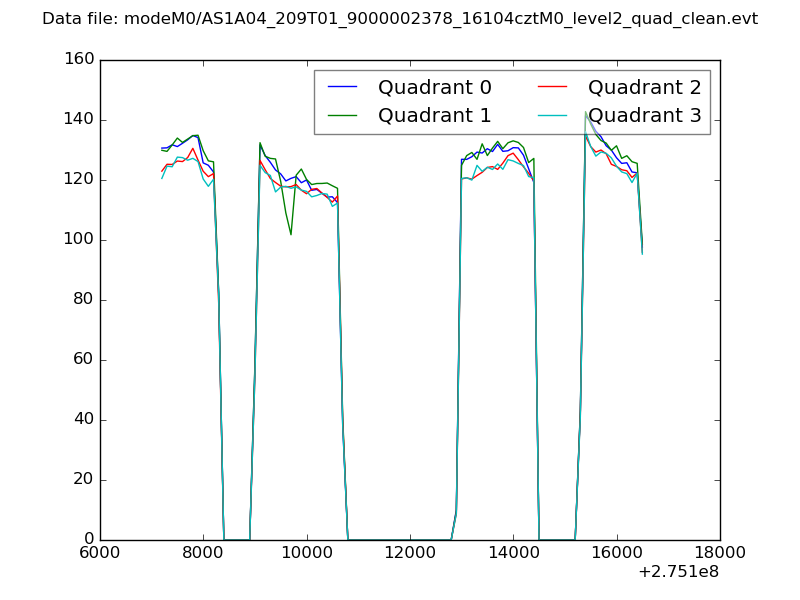 |
|
| Module-wise count rates for Quadrant A Data is divided into 100 sec bins |
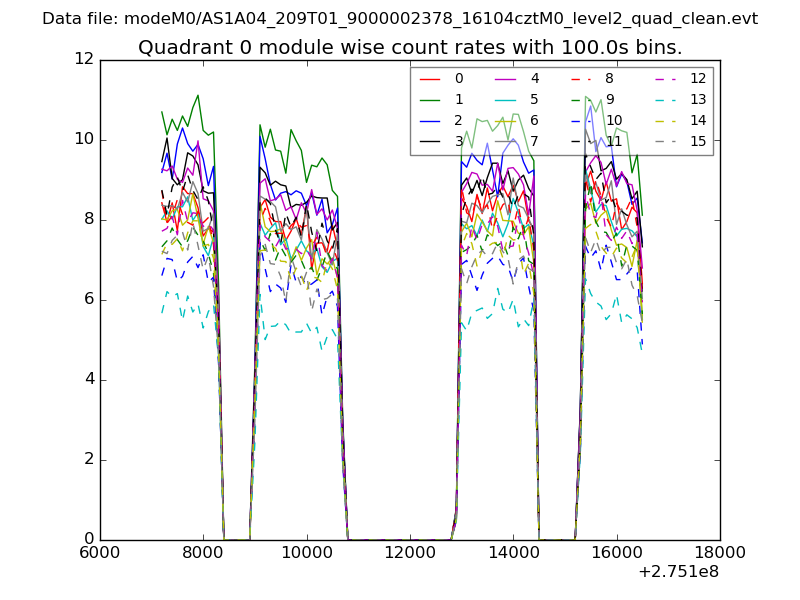 |
 |
| Module-wise count rates for Quadrant B Data is divided into 100 sec bins |
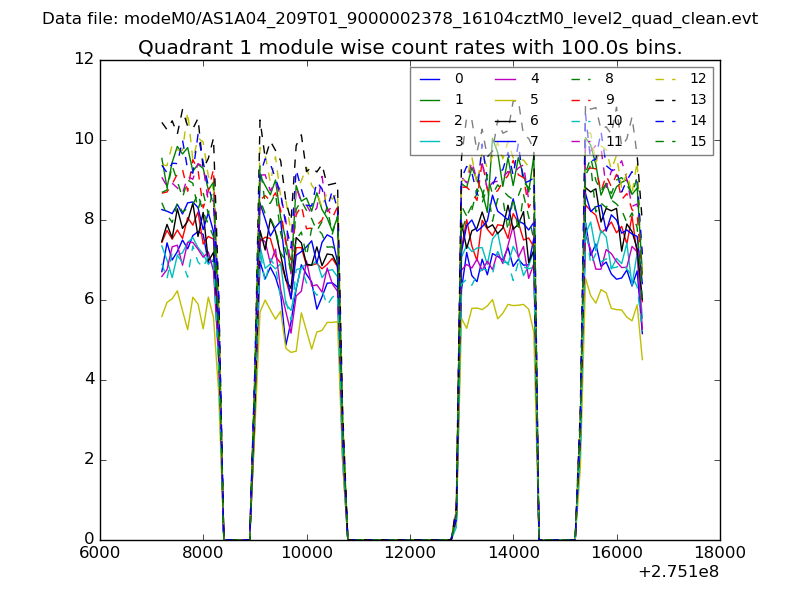 |
 |
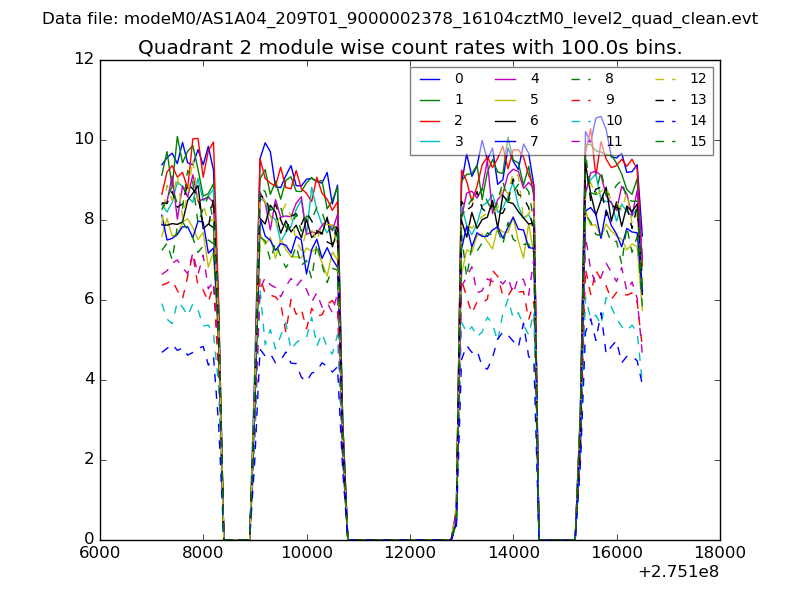
| Module-wise count rates for Quadrant C Data is divided into 100 sec bins |
 |
 |
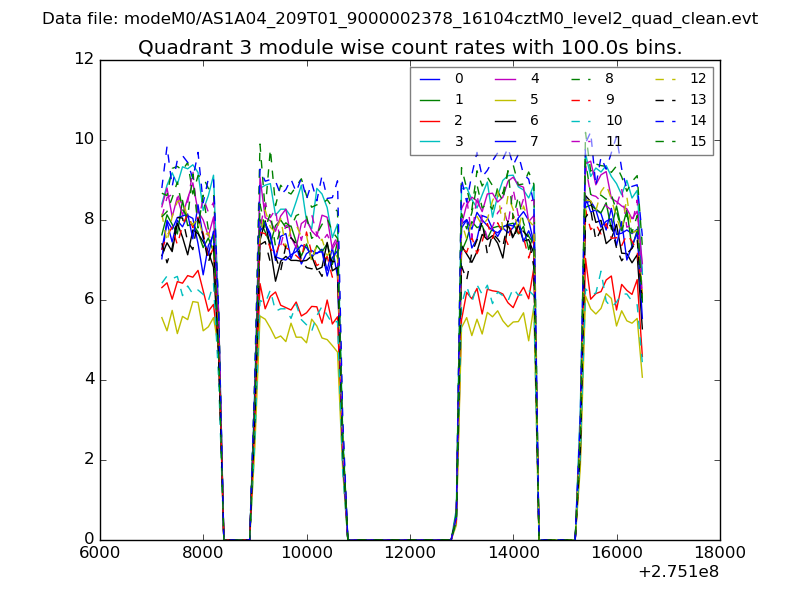
| Module-wise count rates for Quadrant D Data is divided into 100 sec bins |
 |
 |
| Parameter | Plot |
|---|---|
| CZT HV Monitor | 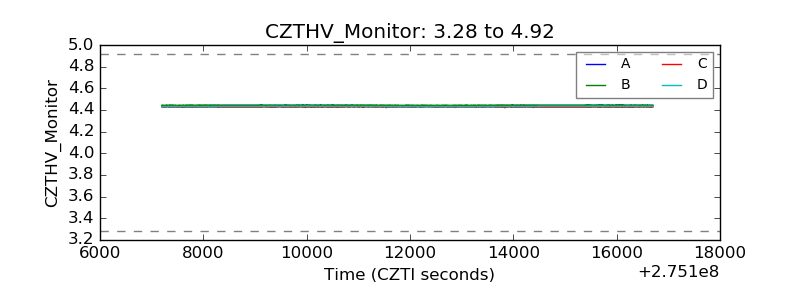 |
| D_VDD | 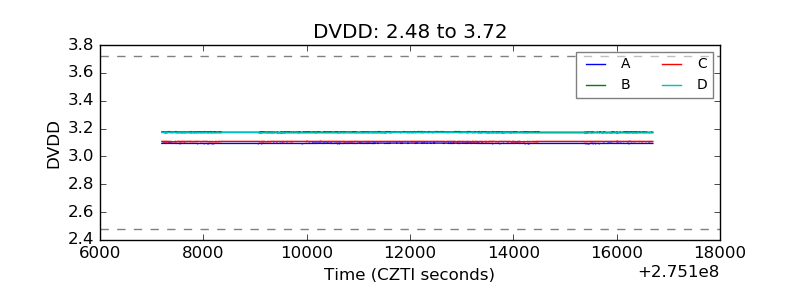 |
| Temperature 1 | 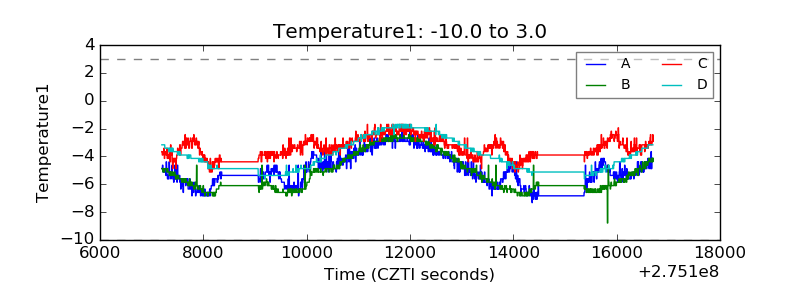 |
| Veto HV Monitor | 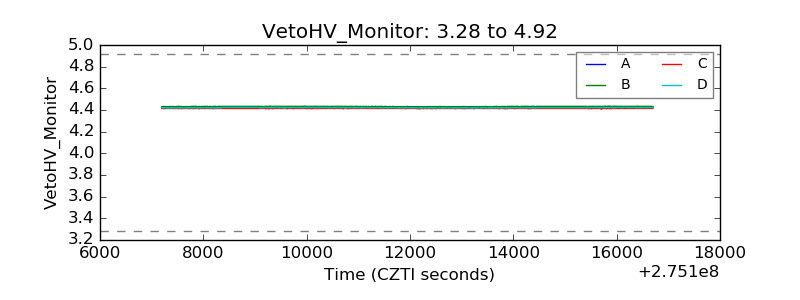 |
| Veto LLD | 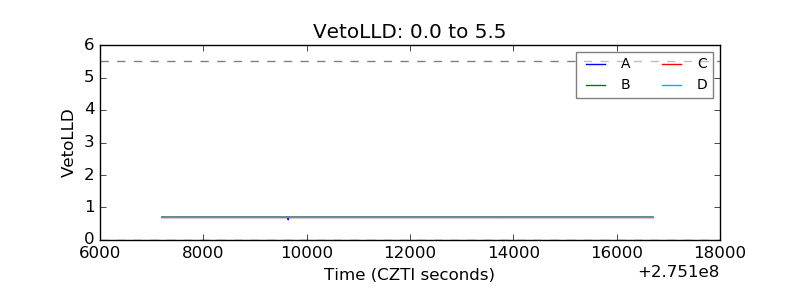 |
| Alpha Counter | 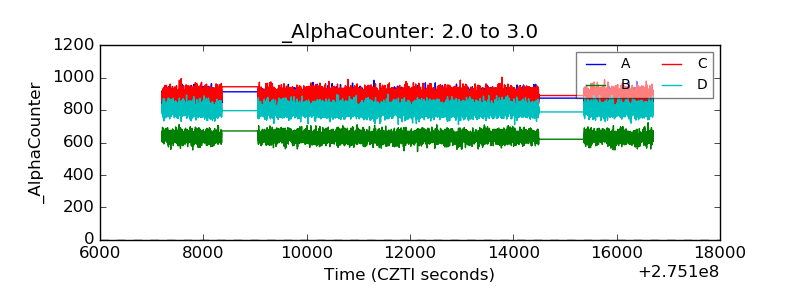 |
| _CPM_Rate | 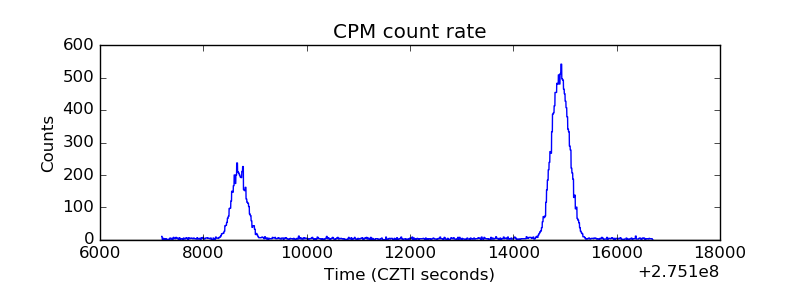 |
| CZT Counter |  |
| +2.5 Volts monitor |  |
| +5 Volts monitor | 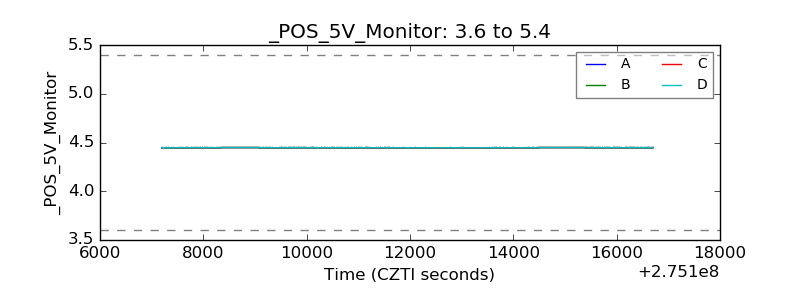 |
| _ROLL_ROT | 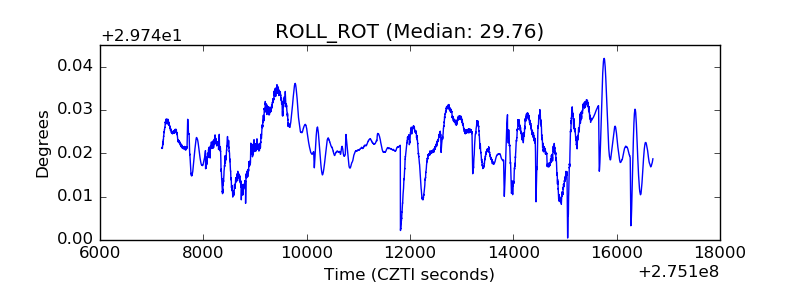 |
| _Roll_DEC | 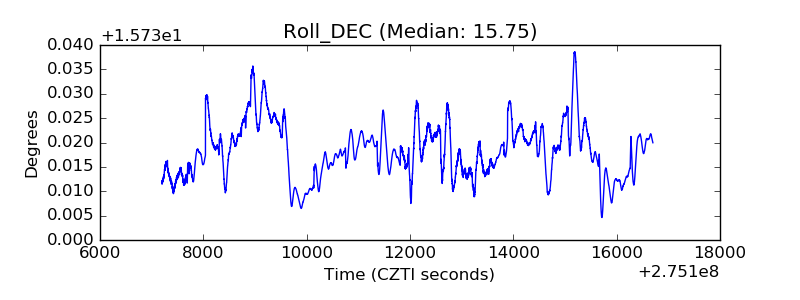 |
| _Roll_RA | 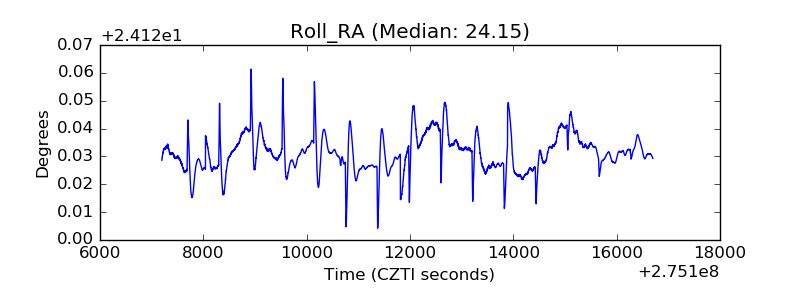 |
| Veto Counter | 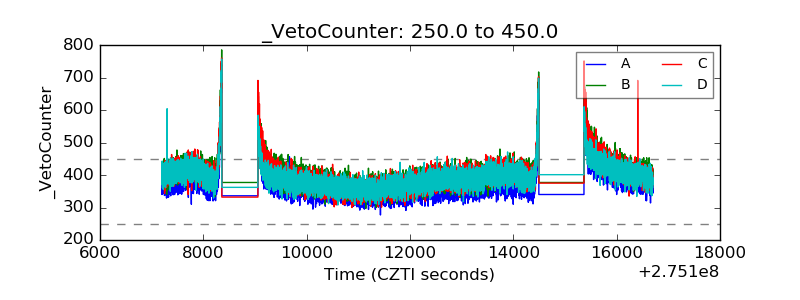 |