| Param | Original file | Final file |
|---|---|---|
| Filename | modeM0/AS1A04_209T01_9000002378_16105cztM0_level2.evt | modeM0/AS1A04_209T01_9000002378_16105cztM0_level2_quad_clean.evt |
| Size (bytes) | 448,476,480 | 80,720,640 |
| Size | 427.7 MB | 77.0 MB |
| Events in quadrant A | 3,190,417 | 503,995 |
| Events in quadrant B | 3,303,015 | 509,931 |
| Events in quadrant C | 3,500,580 | 481,419 |
| Events in quadrant D | 3,132,898 | 482,253 |
| Mode M0 | |||
|---|---|---|---|
| Quadrant | BADHDUFLAG | Total packets | Discarded packets |
| A | 0 | 13664 | 3 |
| B | 0 | 13857 | 2 |
| C | 0 | 14624 | 2 |
| D | 0 | 13796 | 2 |
| Mode M9 | |||
|---|---|---|---|
| Quadrant | BADHDUFLAG | Total packets | Discarded packets |
| A | 0 | 15 | 0 |
| B | 0 | 15 | 0 |
| C | 0 | 15 | 0 |
| D | 0 | 16 | 0 |
| Mode SS | |||
|---|---|---|---|
| Quadrant | BADHDUFLAG | Total packets | Discarded packets |
| A | 0 | 136 | 0 |
| B | 0 | 136 | 0 |
| C | 0 | 136 | 0 |
| D | 0 | 136 | 0 |
| Quadrant | Total seconds | Saturated seconds | Saturation percentage |
|---|---|---|---|
| A | 6696 | 46 | 0.686977% |
| B | 6696 | 59 | 0.881123% |
| C | 6696 | 143 | 2.135603% |
| D | 6696 | 47 | 0.701912% |
Noise dominated data is calculated using 1-second bins in cleaned event files. If a bin has >2000 counts, and if more than 50% of those come from <1% of pixels, then it is considered to be noise-dominated and hence unusable.
| Quadrant | # 1 sec bins | Bins with >0 counts | Bins with >2000 counts | High rate bins dominated by noise | Noise dominated (total time) | Noise dominated (detector-on time) | Marked lightcurve |
|---|---|---|---|---|---|---|---|
| A | 7722 | 6697 | 2 | 2 | 0.03% | 0.03% | 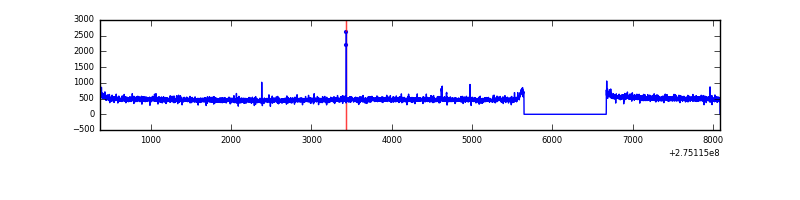 |
| B | 7722 | 6697 | 9 | 9 | 0.12% | 0.13% | 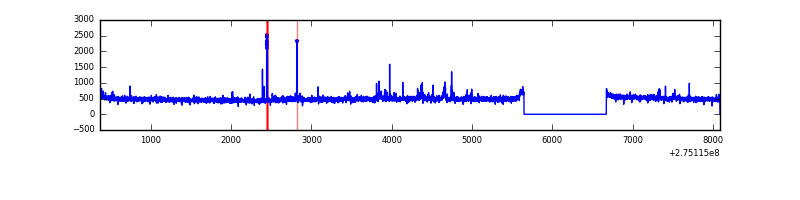 |
| C | 7722 | 6697 | 62 | 62 | 0.80% | 0.93% | 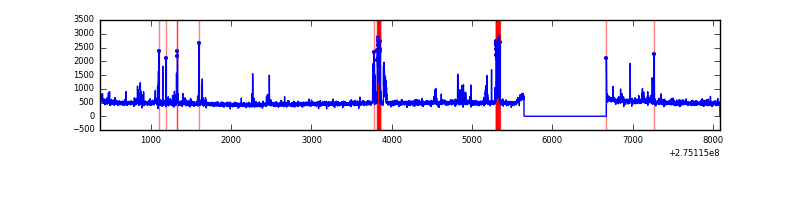 |
| D | 7722 | 6697 | 8 | 8 | 0.10% | 0.12% | 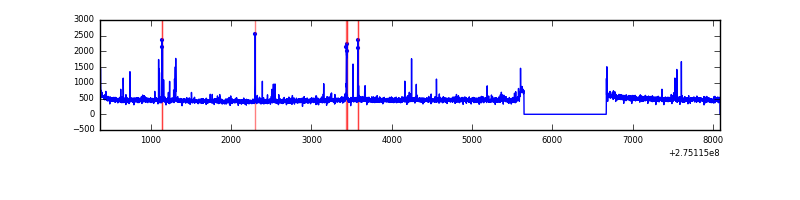 |
Top three noisy pixels from each quadrant. If the there are fewer than three noisy pixels in the level2.evt file, extra rows are filled as -1
| Pixel properties | Quadrant properties | ||||||
|---|---|---|---|---|---|---|---|
| Quadrant | DetID | PixID | Counts | Sigma | Mean | Median | Sigma |
| A | 15 | 239 | 11167 | 61.91 | 826 | 809 | 167.3 |
| A | 0 | 226 | 7239 | 38.43 | 826 | 809 | 167.3 |
| A | 12 | 194 | 6167 | 32.03 | 826 | 809 | 167.3 |
| B | 0 | 189 | 62530 | 389.35 | 817 | 797 | 158.6 |
| B | 4 | 48 | 23032 | 140.24 | 817 | 797 | 158.6 |
| B | 12 | 111 | 18808 | 113.6 | 817 | 797 | 158.6 |
| C | 9 | 236 | 344944 | 1890.85 | 777 | 780 | 182.0 |
| C | 14 | 238 | 119419 | 651.8 | 777 | 780 | 182.0 |
| C | 13 | 61 | 5482 | 25.83 | 777 | 780 | 182.0 |
| D | 13 | 172 | 38211 | 191.67 | 800 | 779 | 195.3 |
| D | 13 | 112 | 30595 | 152.67 | 800 | 779 | 195.3 |
| D | 2 | 234 | 23845 | 118.11 | 800 | 779 | 195.3 |
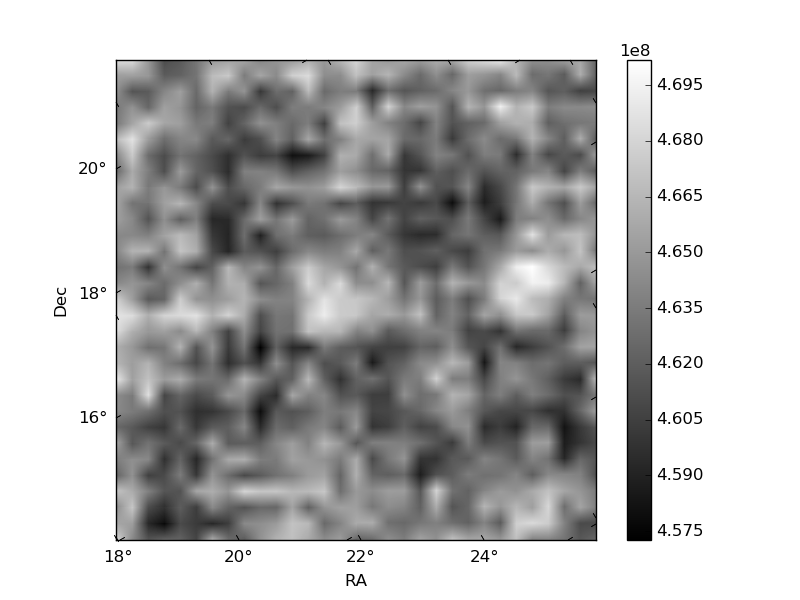
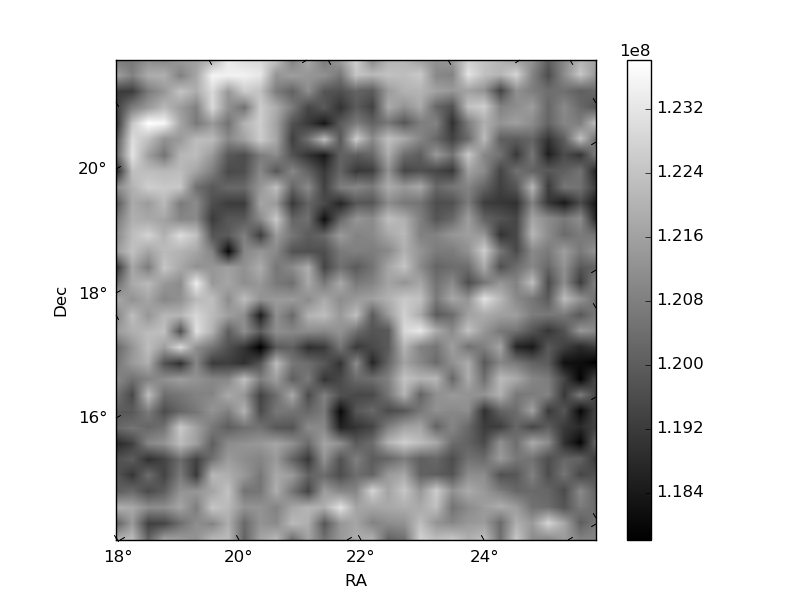
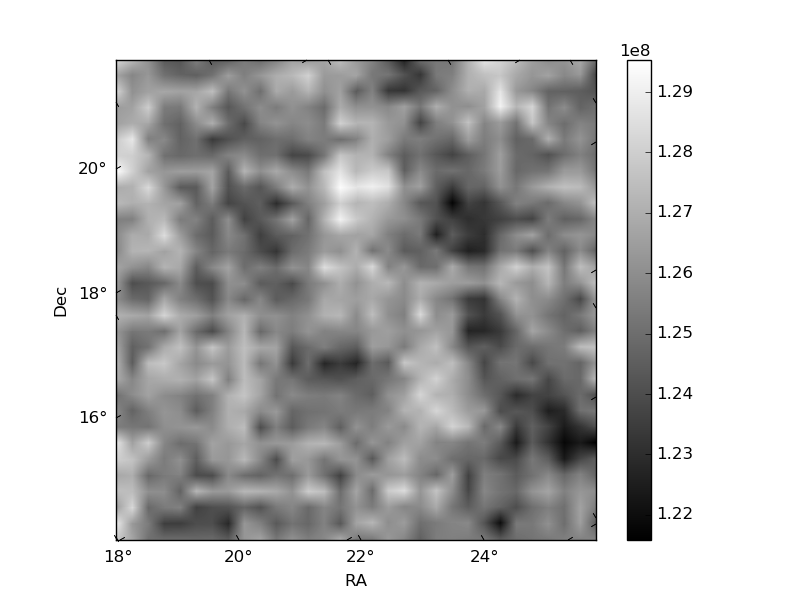
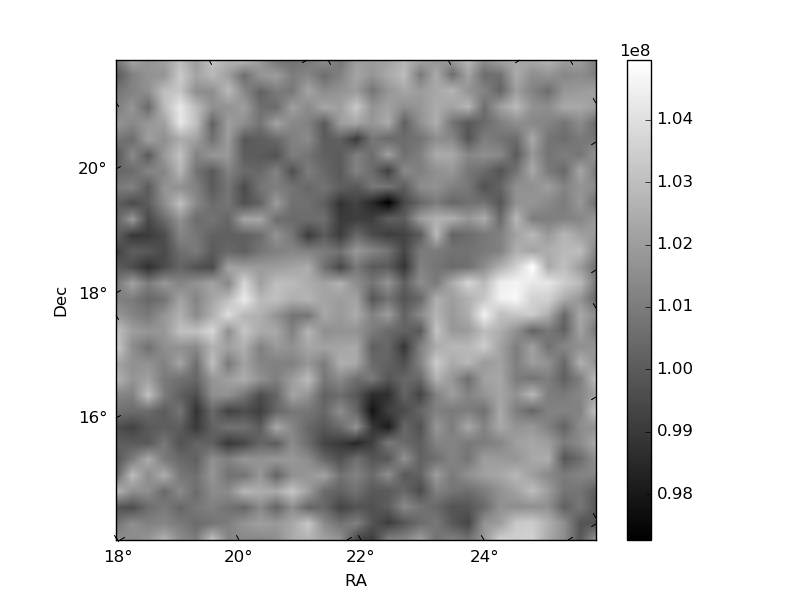
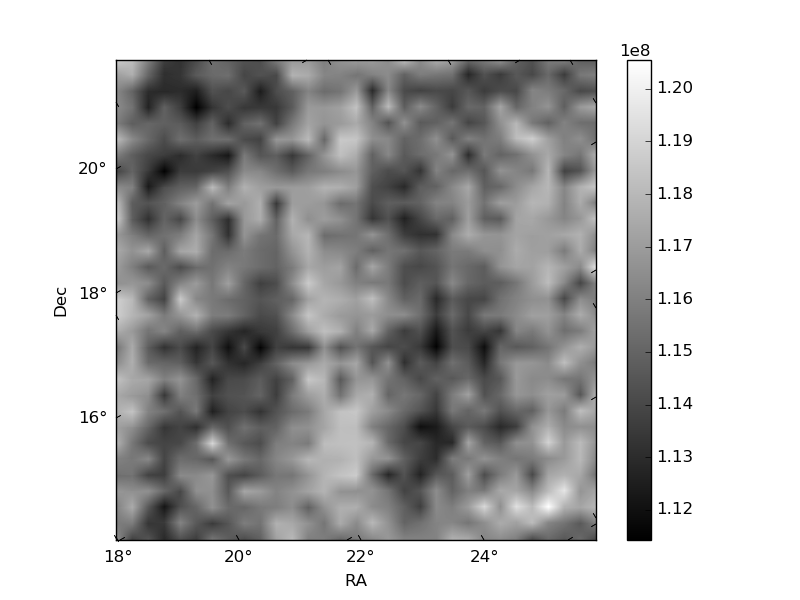
Histogram calculated using DETX and DETY for each event in the final _common_clean file
| Quadrant A | 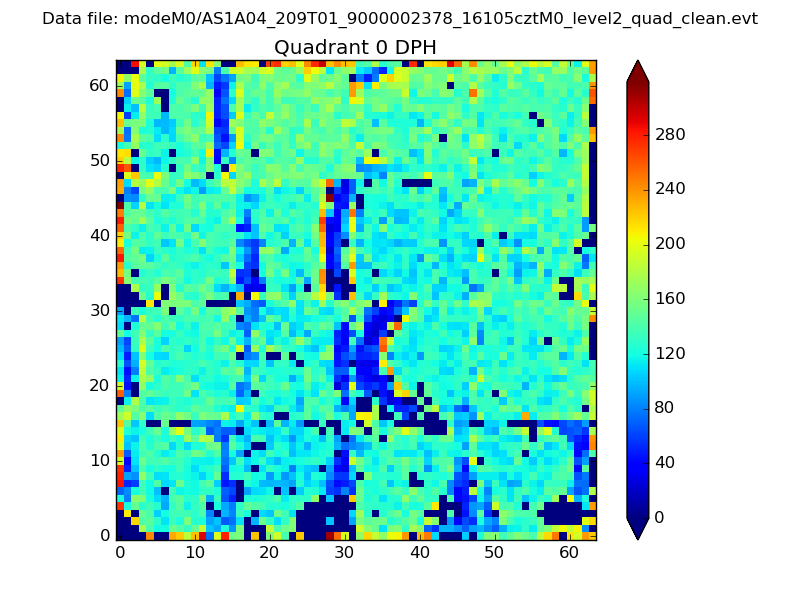 |
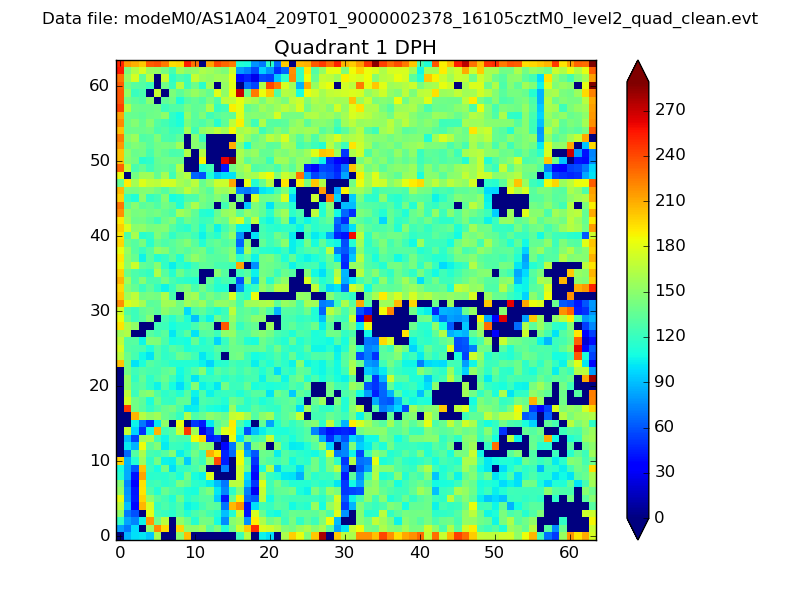 |
Quadrant B |
|---|---|---|---|
| Quadrant D | 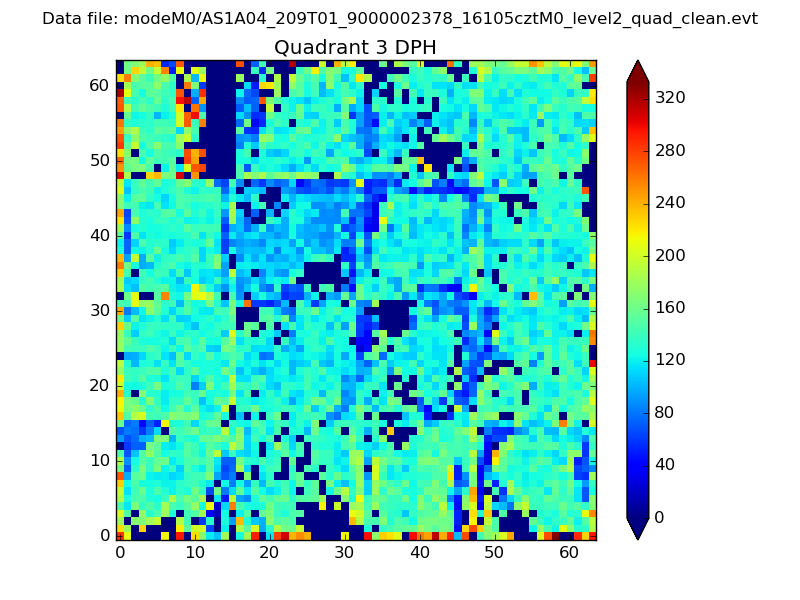 |
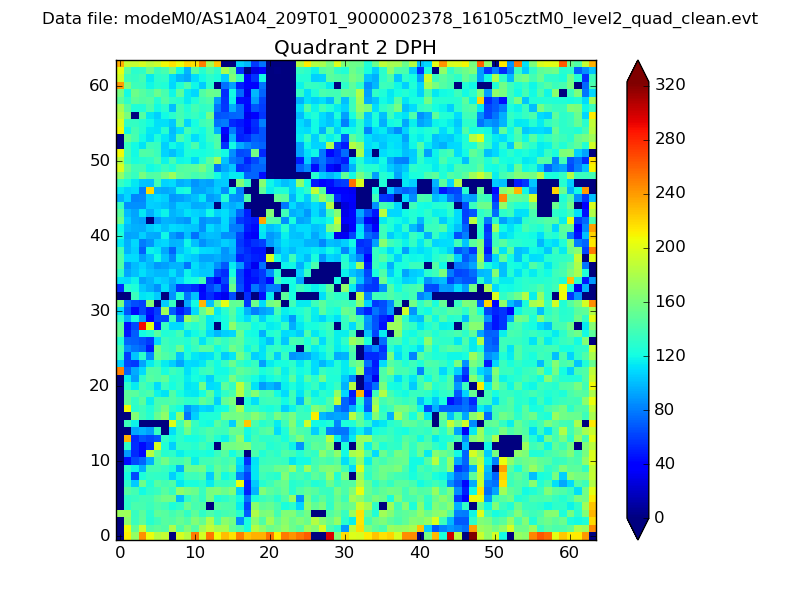 |
Quadrant C |
| Plot type | Count rate plots | Images |
|---|---|---|
| Comparison with Poisson distribution Blue bars denote a histogram of data divided into 1 sec bins. Red curve is a Poisson curve with rate = median count rate of data. |
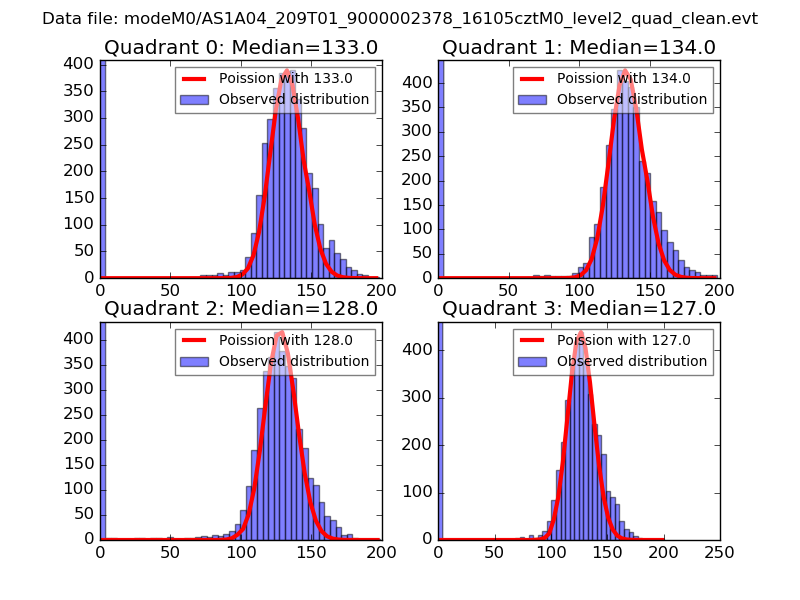 |
 |
| Quadrant-wise count rates Data is divided into 100 sec bins |
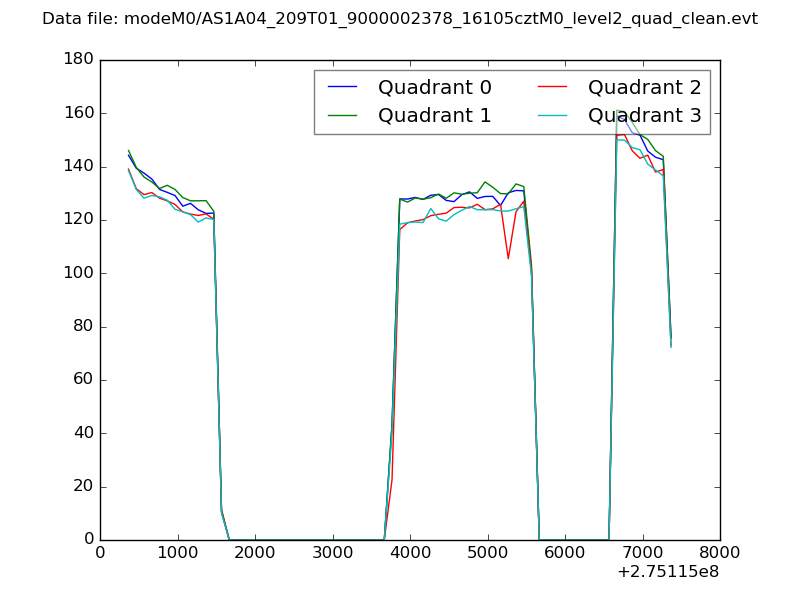 |
|
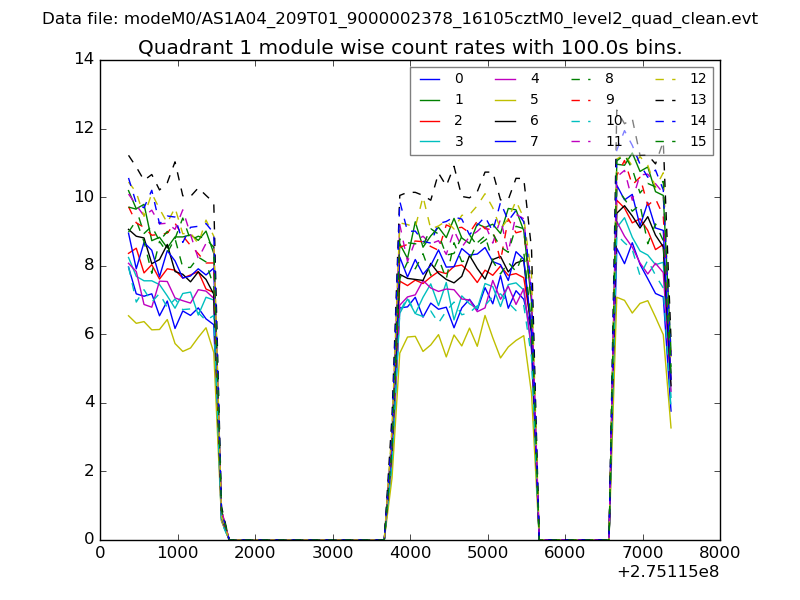
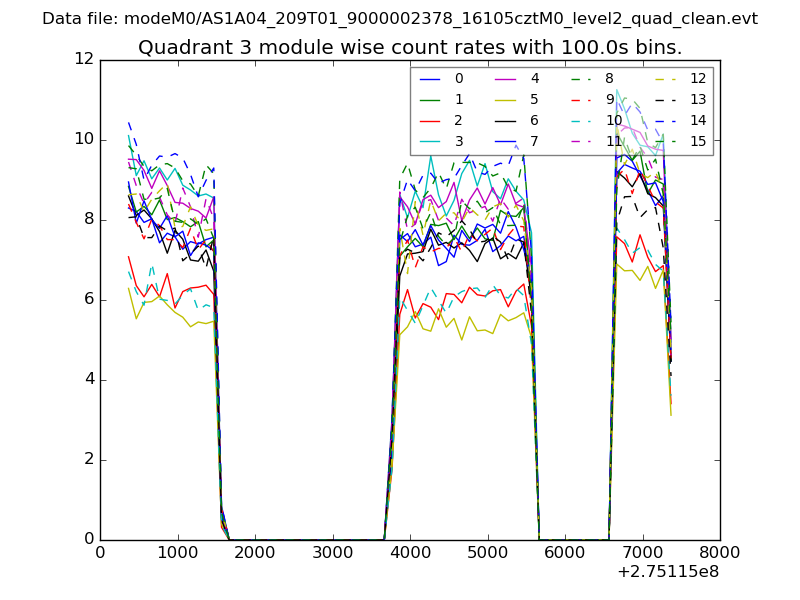
| Module-wise count rates for Quadrant A Data is divided into 100 sec bins |
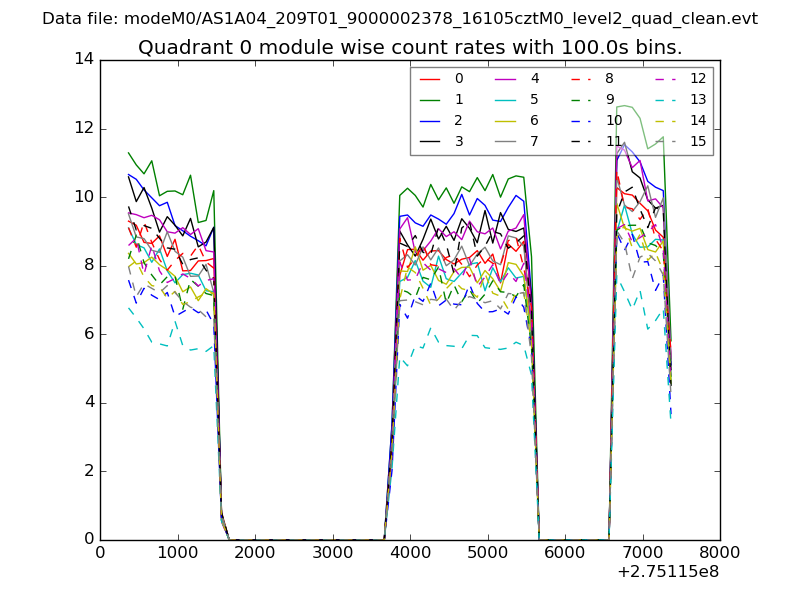 |
 |
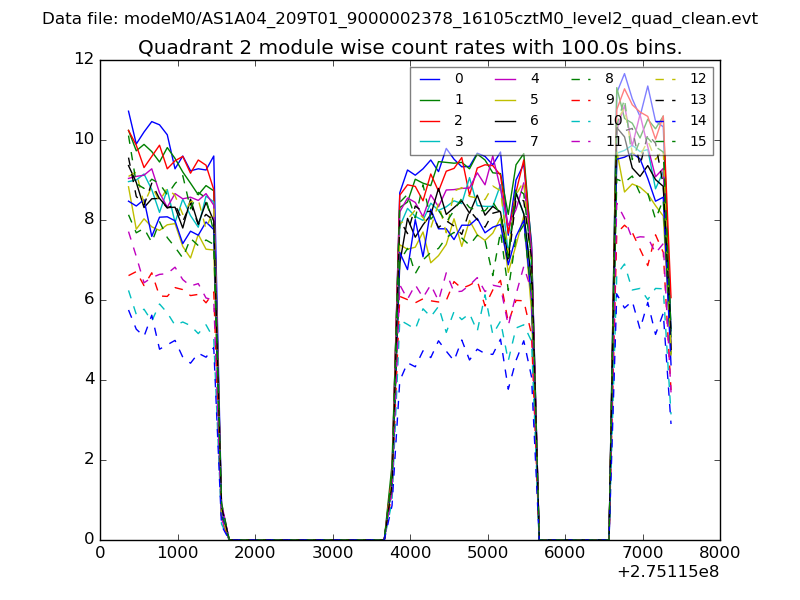
| Module-wise count rates for Quadrant B Data is divided into 100 sec bins |
 |
 |
| Module-wise count rates for Quadrant C Data is divided into 100 sec bins |
 |
 |
| Module-wise count rates for Quadrant D Data is divided into 100 sec bins |
 |
 |
| Parameter | Plot |
|---|---|
| CZT HV Monitor | 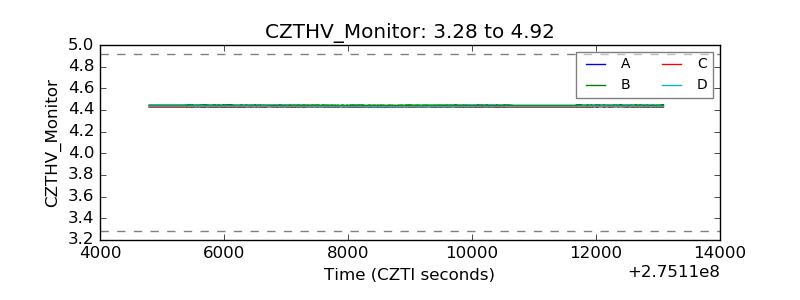 |
| D_VDD | 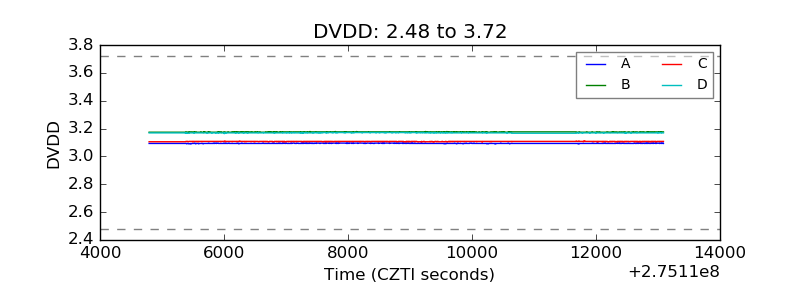 |
| Temperature 1 | 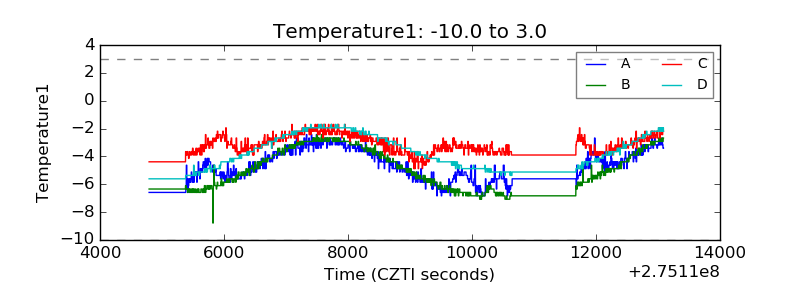 |
| Veto HV Monitor |  |
| Veto LLD | 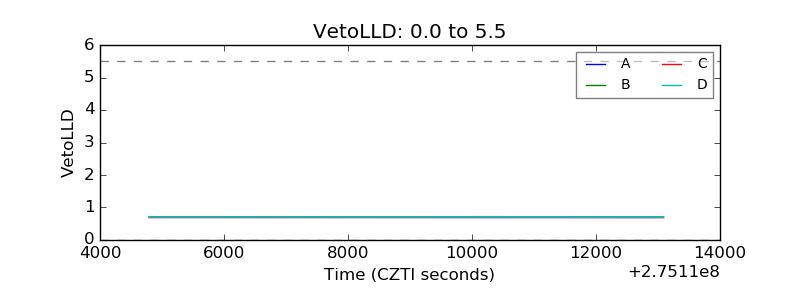 |
| Alpha Counter | 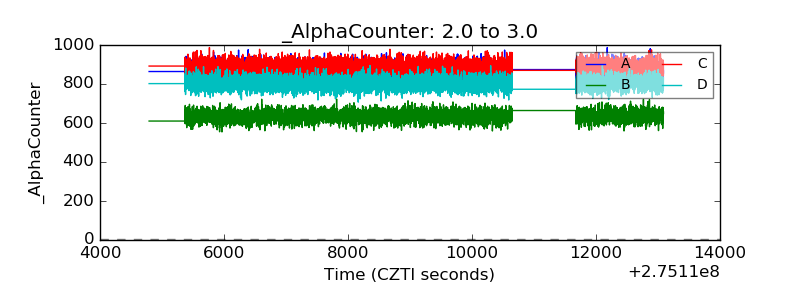 |
| _CPM_Rate | 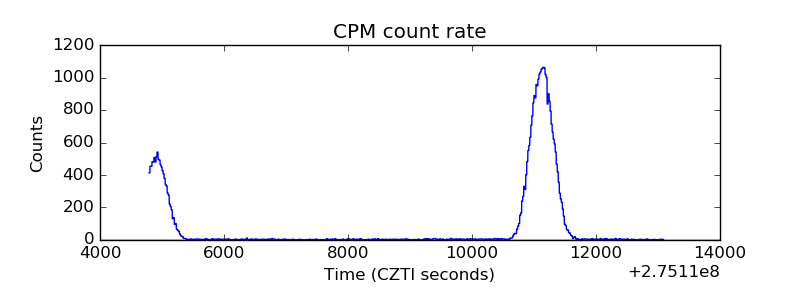 |
| CZT Counter | 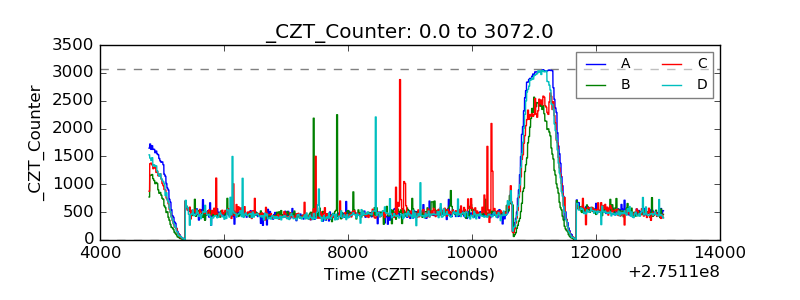 |
| +2.5 Volts monitor |  |
| +5 Volts monitor |  |
| _ROLL_ROT | 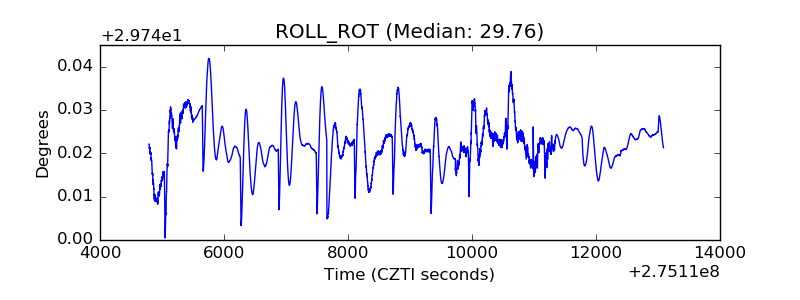 |
| _Roll_DEC | 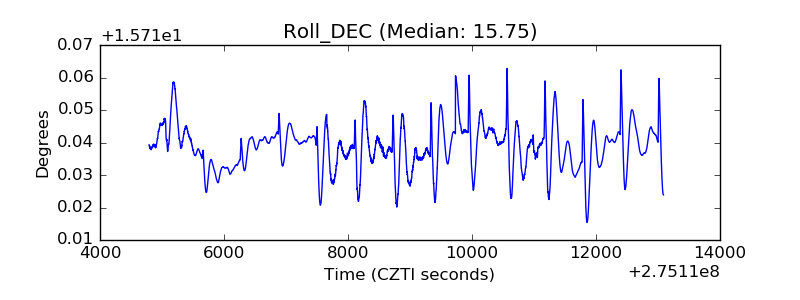 |
| _Roll_RA | 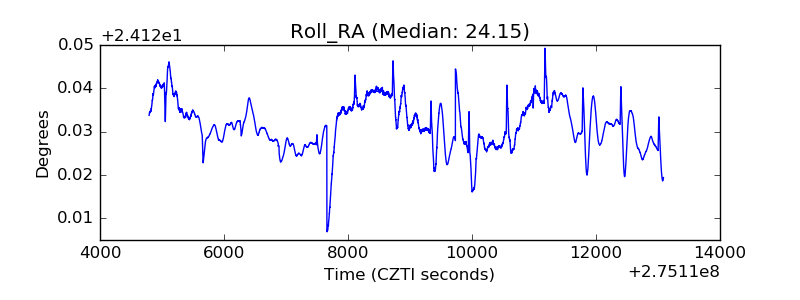 |
| Veto Counter | 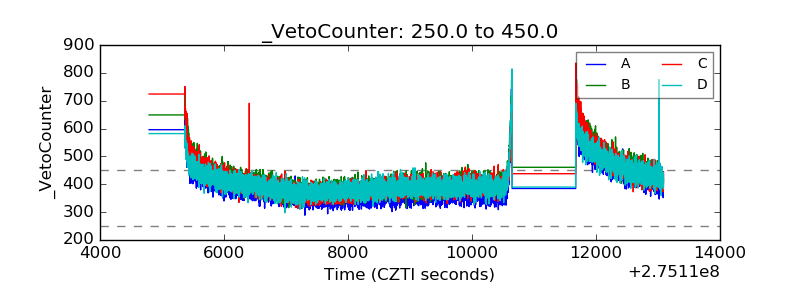 |