| Param | Original file | Final file |
|---|---|---|
| Filename | modeM0/AS1A04_209T01_9000002378_16108cztM0_level2.evt | modeM0/AS1A04_209T01_9000002378_16108cztM0_level2_quad_clean.evt |
| Size (bytes) | 485,697,600 | 66,384,000 |
| Size | 463.2 MB | 63.3 MB |
| Events in quadrant A | 3,462,564 | 397,053 |
| Events in quadrant B | 3,615,262 | 399,547 |
| Events in quadrant C | 3,495,244 | 379,748 |
| Events in quadrant D | 3,694,031 | 378,930 |
| Mode M0 | |||
|---|---|---|---|
| Quadrant | BADHDUFLAG | Total packets | Discarded packets |
| A | 0 | 14321 | 3 |
| B | 0 | 14780 | 2 |
| C | 0 | 14354 | 2 |
| D | 0 | 15068 | 2 |
| Mode M9 | |||
|---|---|---|---|
| Quadrant | BADHDUFLAG | Total packets | Discarded packets |
| A | 0 | 16 | 0 |
| B | 0 | 16 | 0 |
| C | 0 | 16 | 0 |
| D | 0 | 17 | 0 |
| Mode SS | |||
|---|---|---|---|
| Quadrant | BADHDUFLAG | Total packets | Discarded packets |
| A | 0 | 132 | 0 |
| B | 0 | 132 | 0 |
| C | 0 | 132 | 0 |
| D | 0 | 132 | 0 |
| Quadrant | Total seconds | Saturated seconds | Saturation percentage |
|---|---|---|---|
| A | 6519 | 96 | 1.472618% |
| B | 6519 | 107 | 1.641356% |
| C | 6519 | 107 | 1.641356% |
| D | 6519 | 113 | 1.733395% |
Noise dominated data is calculated using 1-second bins in cleaned event files. If a bin has >2000 counts, and if more than 50% of those come from <1% of pixels, then it is considered to be noise-dominated and hence unusable.
| Quadrant | # 1 sec bins | Bins with >0 counts | Bins with >2000 counts | High rate bins dominated by noise | Noise dominated (total time) | Noise dominated (detector-on time) | Marked lightcurve |
|---|---|---|---|---|---|---|---|
| A | 7740 | 6520 | 2 | 2 | 0.03% | 0.03% | 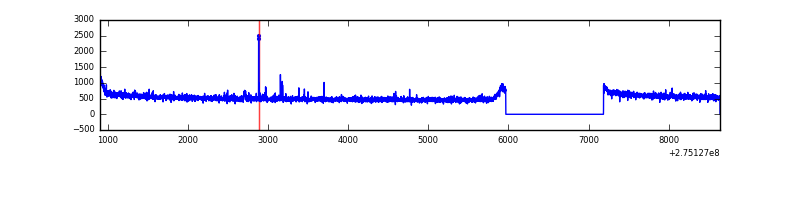 |
| B | 7740 | 6520 | 2 | 2 | 0.03% | 0.03% | 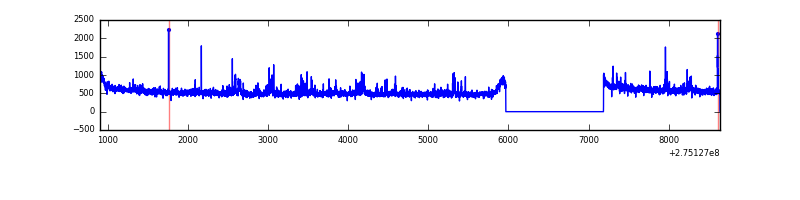 |
| C | 7740 | 6520 | 0 | 0 | 0.00% | 0.00% | 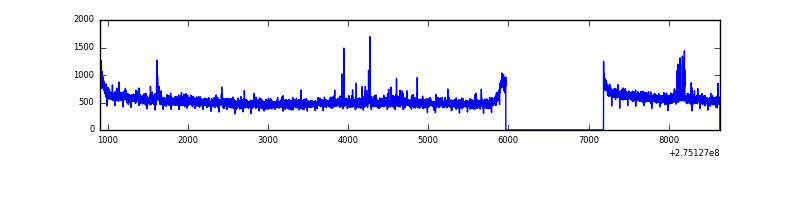 |
| D | 7740 | 6520 | 51 | 51 | 0.66% | 0.78% | 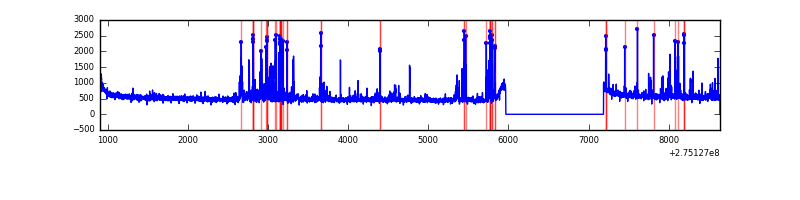 |
Top three noisy pixels from each quadrant. If the there are fewer than three noisy pixels in the level2.evt file, extra rows are filled as -1
| Pixel properties | Quadrant properties | ||||||
|---|---|---|---|---|---|---|---|
| Quadrant | DetID | PixID | Counts | Sigma | Mean | Median | Sigma |
| A | 15 | 174 | 20820 | 112.06 | 892 | 875 | 178.0 |
| A | 15 | 239 | 15264 | 80.84 | 892 | 875 | 178.0 |
| A | 0 | 226 | 7922 | 39.59 | 892 | 875 | 178.0 |
| B | 0 | 189 | 91400 | 545.9 | 879 | 858 | 165.9 |
| B | 4 | 216 | 33125 | 194.55 | 879 | 858 | 165.9 |
| B | 4 | 173 | 31943 | 187.42 | 879 | 858 | 165.9 |
| C | 14 | 238 | 132259 | 675.39 | 841 | 848 | 194.6 |
| C | 9 | 236 | 72510 | 368.31 | 841 | 848 | 194.6 |
| C | 3 | 233 | 10912 | 51.72 | 841 | 848 | 194.6 |
| D | 1 | 52 | 356403 | 1694.7 | 866 | 843 | 209.8 |
| D | 13 | 172 | 39771 | 185.54 | 866 | 843 | 209.8 |
| D | 2 | 234 | 24456 | 112.55 | 866 | 843 | 209.8 |
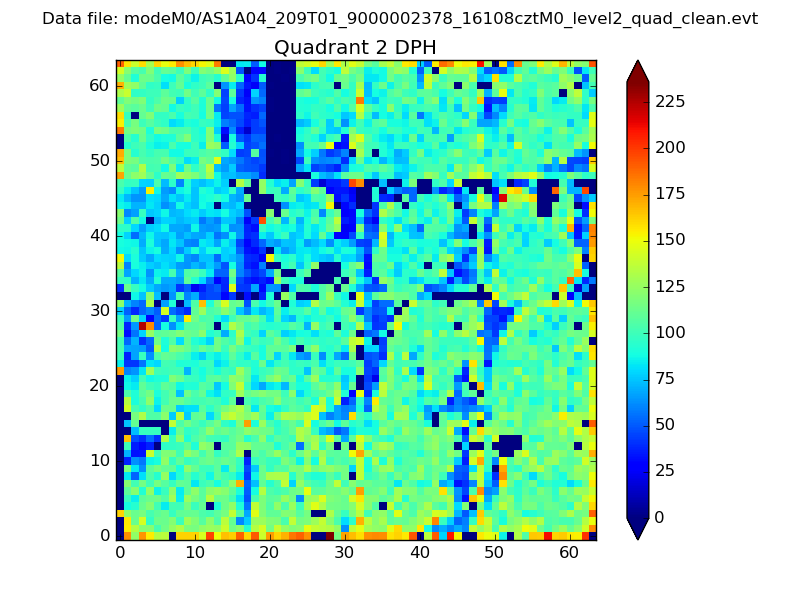
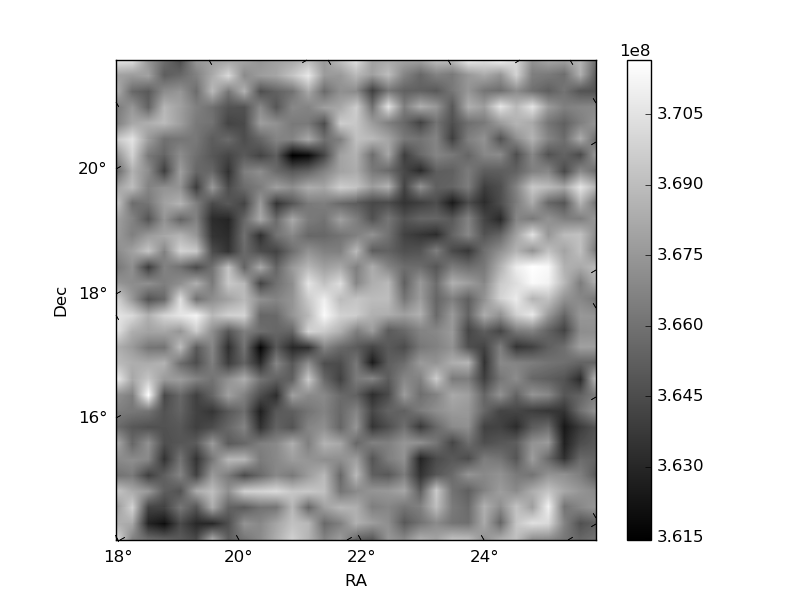
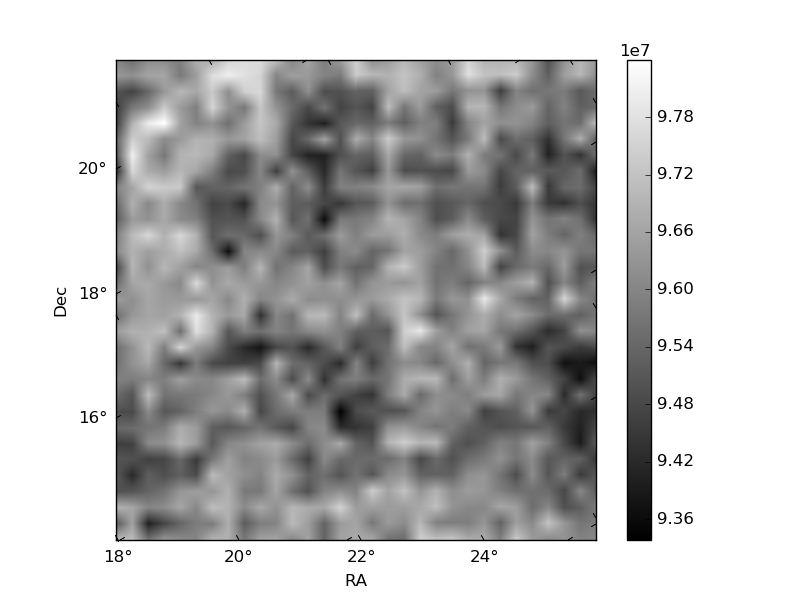
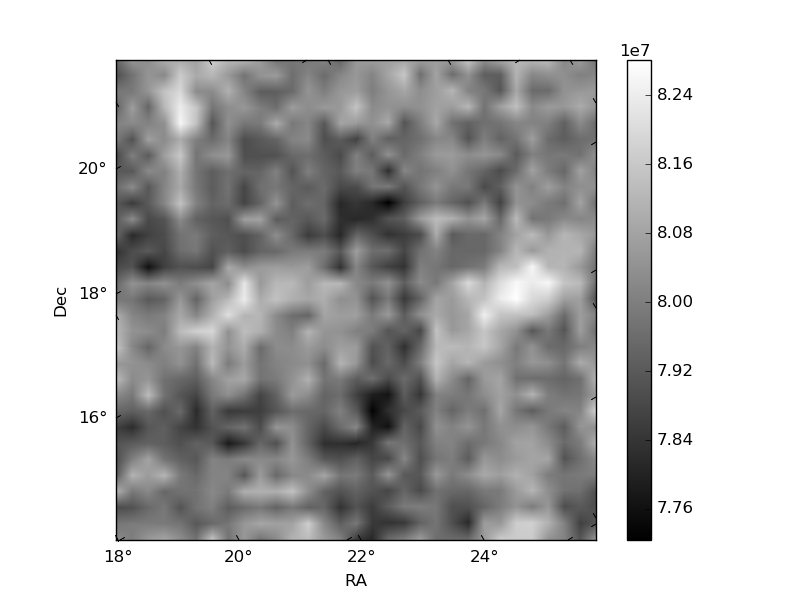
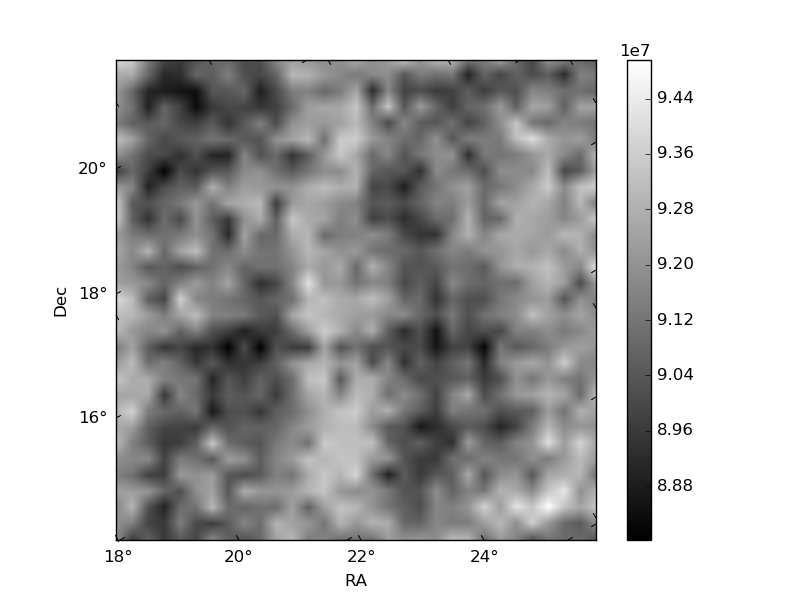
Histogram calculated using DETX and DETY for each event in the final _common_clean file
| Quadrant A | 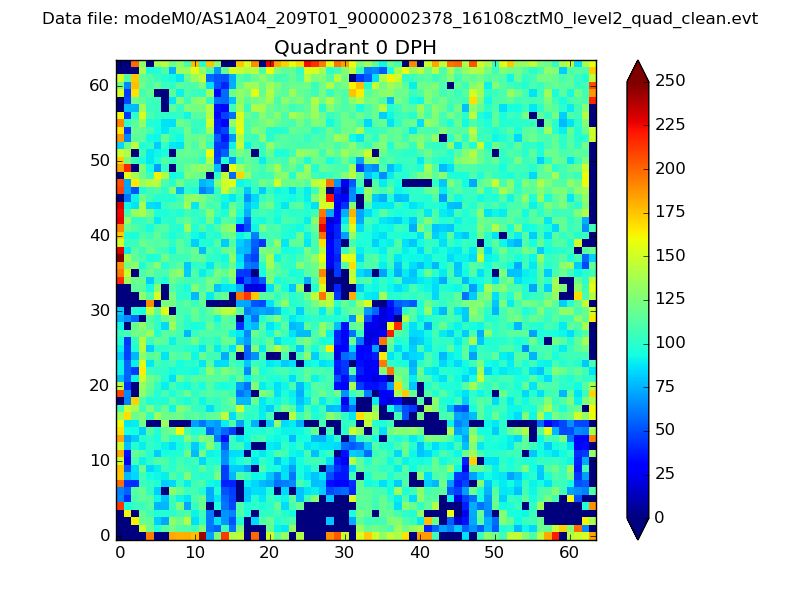 |
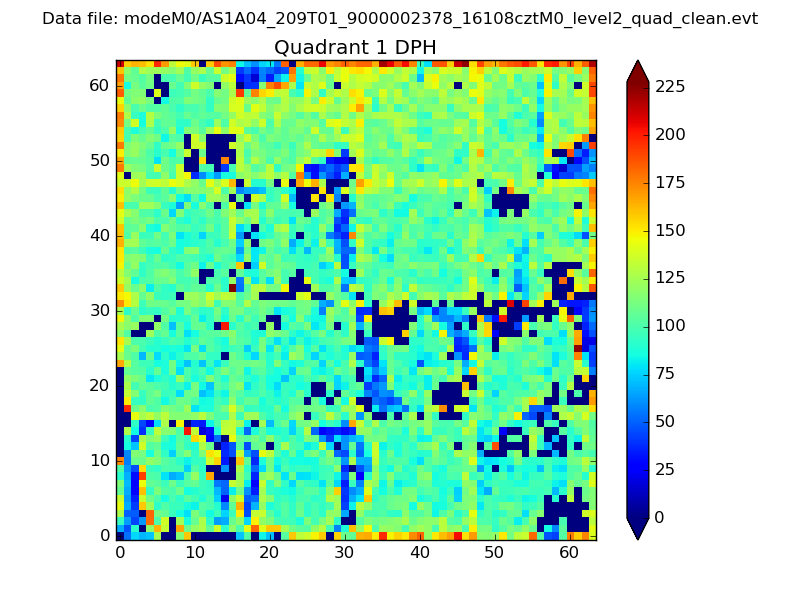 |
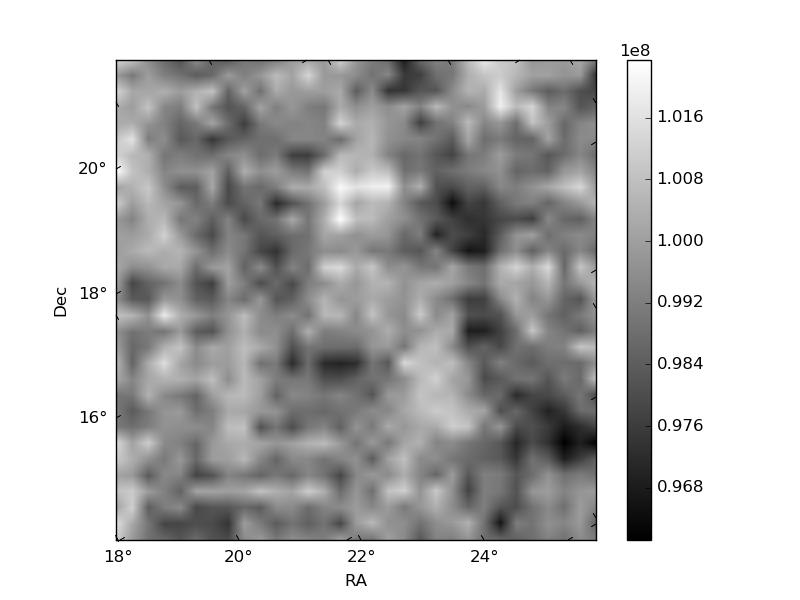
Quadrant B |
|---|---|---|---|
| Quadrant D | 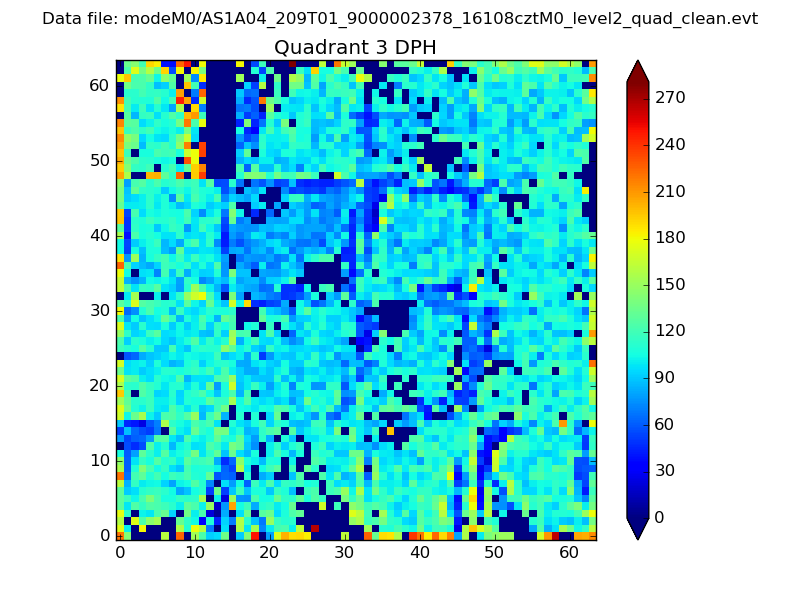 |
 |
Quadrant C |
| Plot type | Count rate plots | Images |
|---|---|---|
| Comparison with Poisson distribution Blue bars denote a histogram of data divided into 1 sec bins. Red curve is a Poisson curve with rate = median count rate of data. |
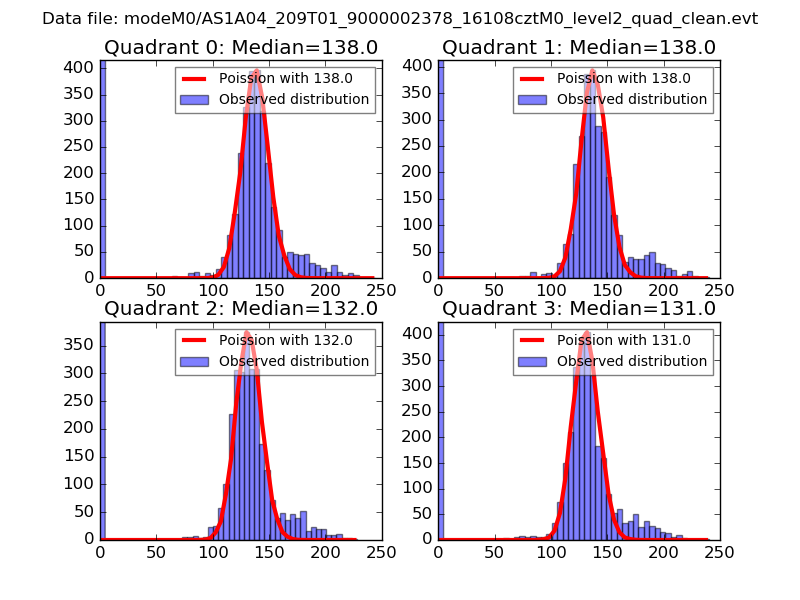 |
 |
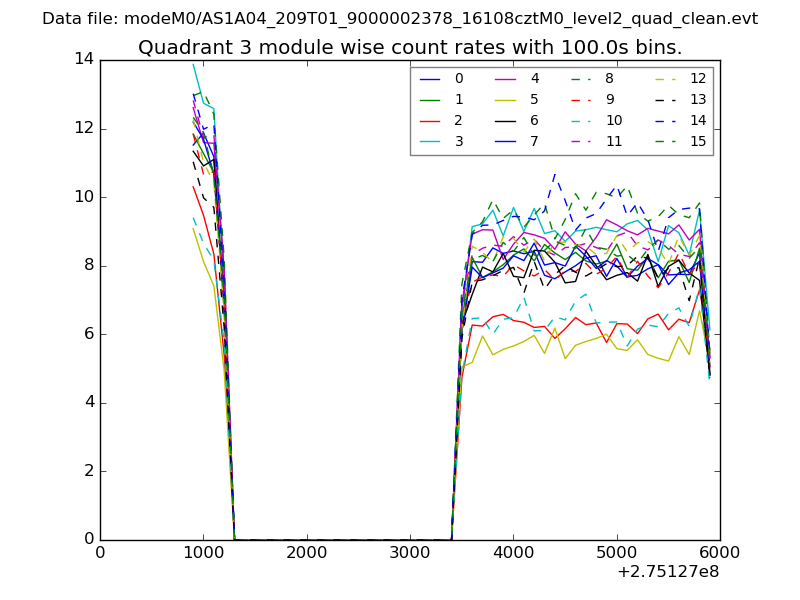
| Quadrant-wise count rates Data is divided into 100 sec bins |
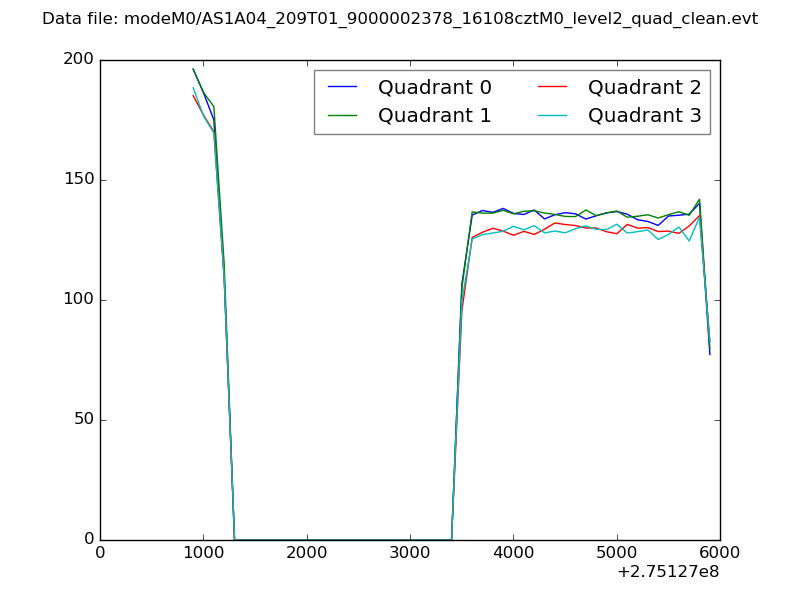 |
|
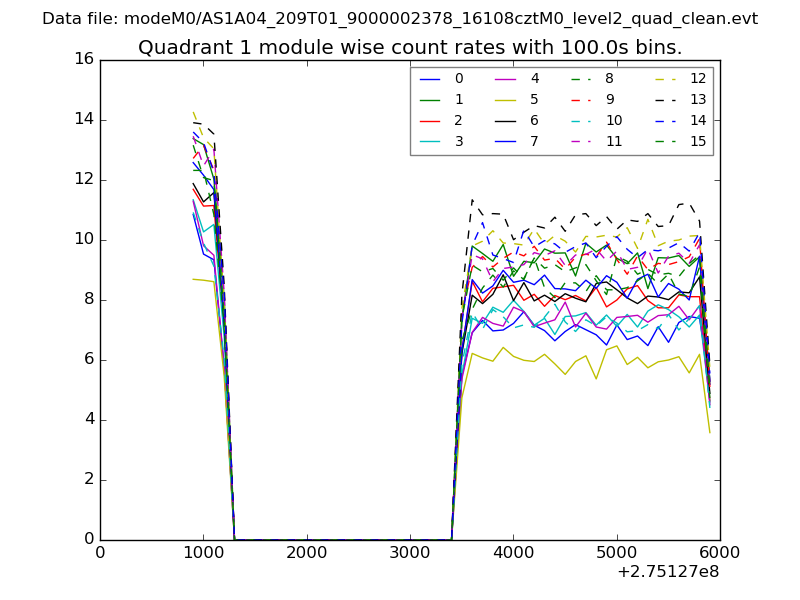
| Module-wise count rates for Quadrant A Data is divided into 100 sec bins |
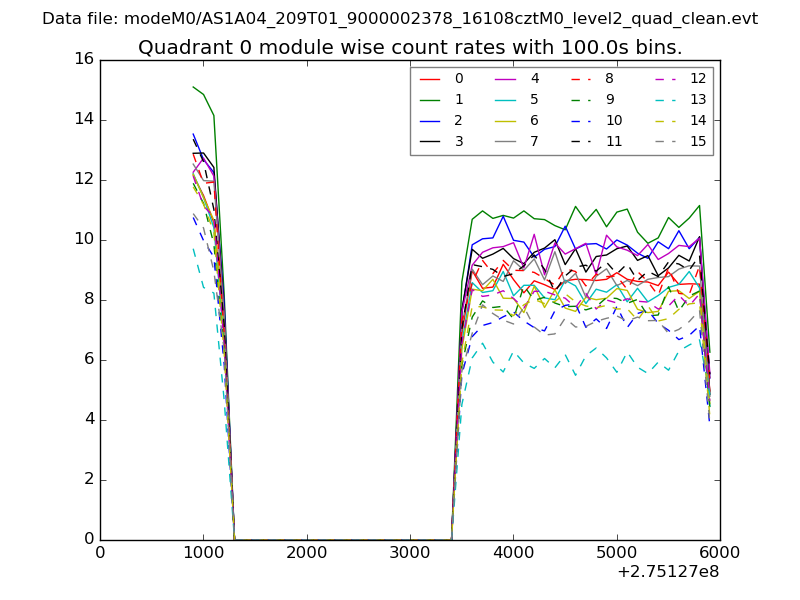 |
 |
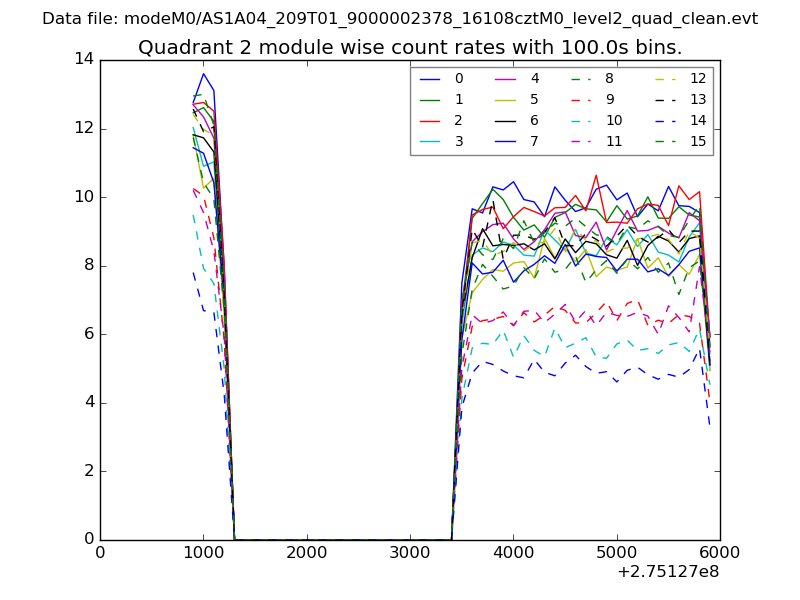
| Module-wise count rates for Quadrant B Data is divided into 100 sec bins |
 |
 |
| Module-wise count rates for Quadrant C Data is divided into 100 sec bins |
 |
 |
| Module-wise count rates for Quadrant D Data is divided into 100 sec bins |
 |
 |
| Parameter | Plot |
|---|---|
| CZT HV Monitor | 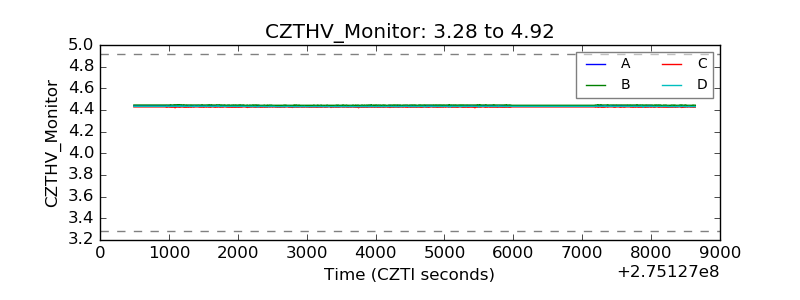 |
| D_VDD | 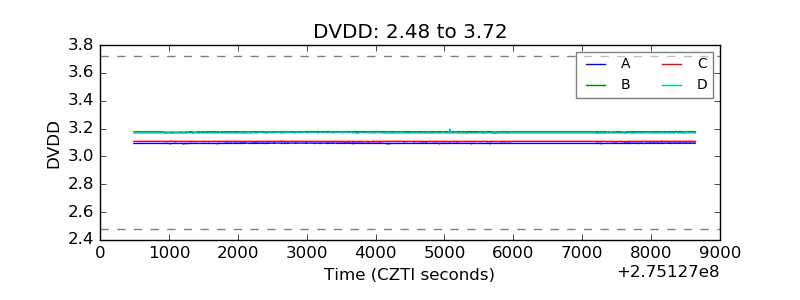 |
| Temperature 1 | 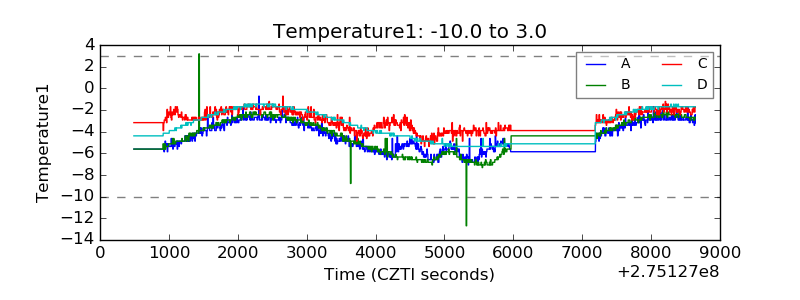 |
| Veto HV Monitor | 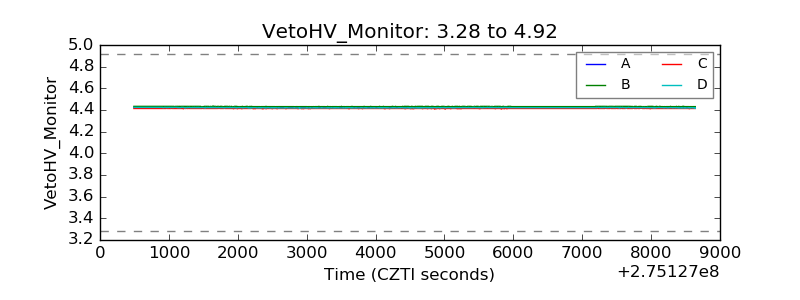 |
| Veto LLD | 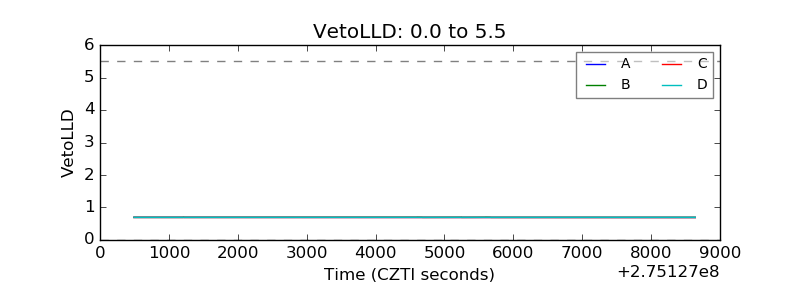 |
| Alpha Counter | 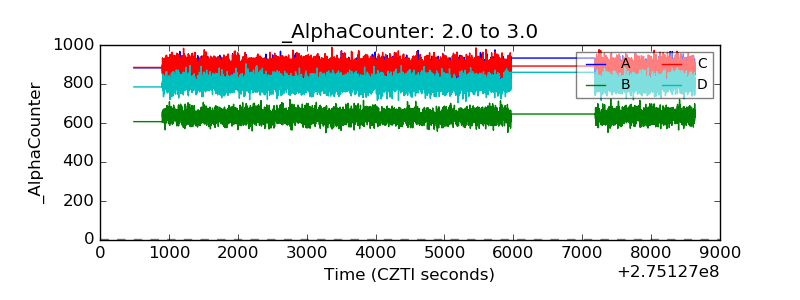 |
| _CPM_Rate | 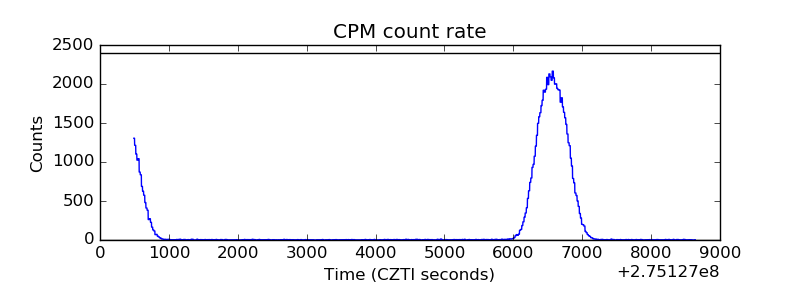 |
| CZT Counter | 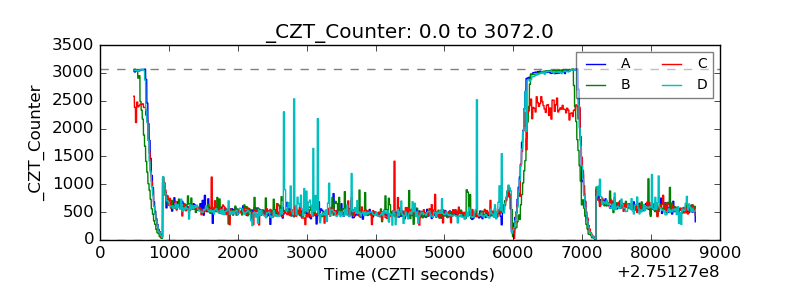 |
| +2.5 Volts monitor | 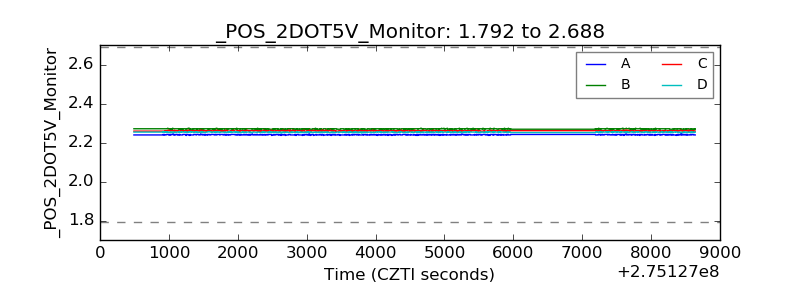 |
| +5 Volts monitor |  |
| _ROLL_ROT | 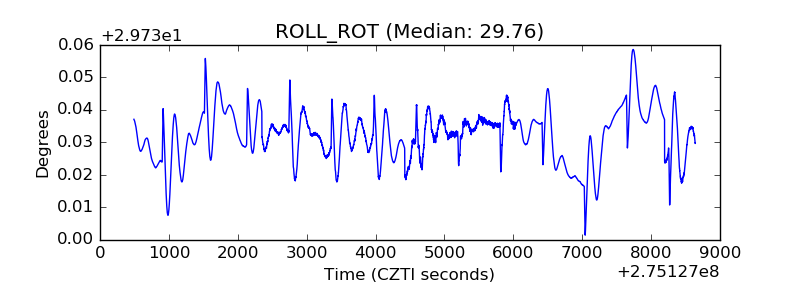 |
| _Roll_DEC | 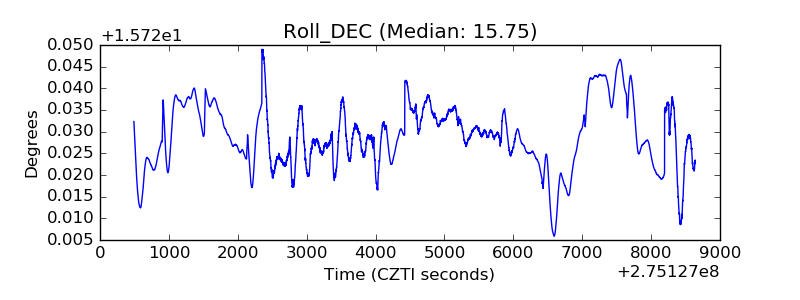 |
| _Roll_RA | 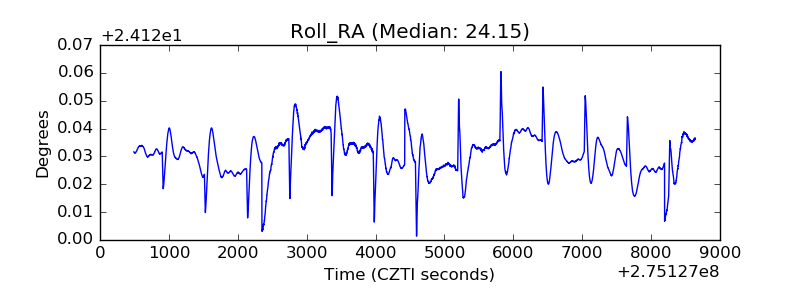 |
| Veto Counter | 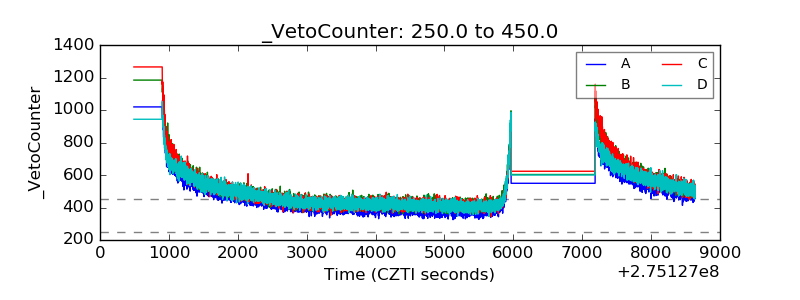 |