| Param | Original file | Final file |
|---|---|---|
| Filename | modeM0/AS1A04_209T01_9000002378_16109cztM0_level2.evt | modeM0/AS1A04_209T01_9000002378_16109cztM0_level2_quad_clean.evt |
| Size (bytes) | 498,101,760 | 65,142,720 |
| Size | 475.0 MB | 62.1 MB |
| Events in quadrant A | 3,567,994 | 388,462 |
| Events in quadrant B | 3,581,982 | 391,985 |
| Events in quadrant C | 3,671,731 | 373,332 |
| Events in quadrant D | 3,828,588 | 371,374 |
| Mode M0 | |||
|---|---|---|---|
| Quadrant | BADHDUFLAG | Total packets | Discarded packets |
| A | 0 | 14619 | 3 |
| B | 0 | 14770 | 2 |
| C | 0 | 14915 | 2 |
| D | 0 | 15422 | 2 |
| Mode M9 | |||
|---|---|---|---|
| Quadrant | BADHDUFLAG | Total packets | Discarded packets |
| A | 0 | 23 | 0 |
| B | 0 | 23 | 0 |
| C | 0 | 23 | 0 |
| D | 0 | 24 | 0 |
| Mode SS | |||
|---|---|---|---|
| Quadrant | BADHDUFLAG | Total packets | Discarded packets |
| A | 0 | 130 | 0 |
| B | 0 | 130 | 0 |
| C | 0 | 130 | 0 |
| D | 0 | 130 | 0 |
| Quadrant | Total seconds | Saturated seconds | Saturation percentage |
|---|---|---|---|
| A | 6409 | 97 | 1.513497% |
| B | 6409 | 101 | 1.575909% |
| C | 6409 | 138 | 2.153222% |
| D | 6409 | 139 | 2.168825% |
Noise dominated data is calculated using 1-second bins in cleaned event files. If a bin has >2000 counts, and if more than 50% of those come from <1% of pixels, then it is considered to be noise-dominated and hence unusable.
| Quadrant | # 1 sec bins | Bins with >0 counts | Bins with >2000 counts | High rate bins dominated by noise | Noise dominated (total time) | Noise dominated (detector-on time) | Marked lightcurve |
|---|---|---|---|---|---|---|---|
| A | 7700 | 6410 | 11 | 11 | 0.14% | 0.17% | 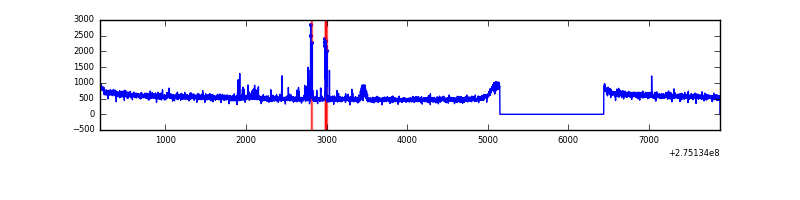 |
| B | 7700 | 6410 | 1 | 1 | 0.01% | 0.02% | 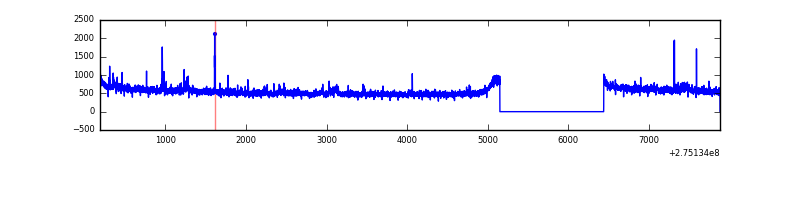 |
| C | 7700 | 6410 | 22 | 22 | 0.29% | 0.34% | 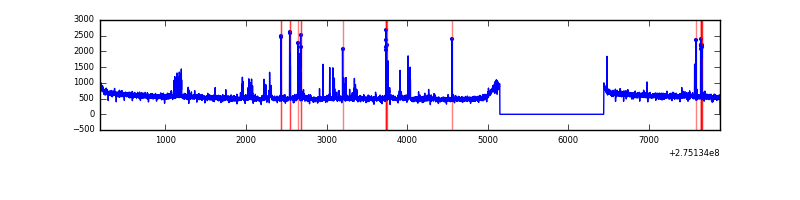 |
| D | 7700 | 6410 | 96 | 96 | 1.25% | 1.50% | 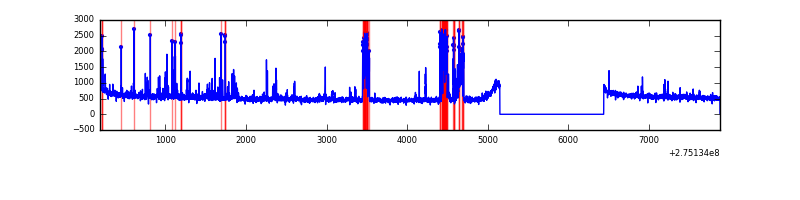 |
Top three noisy pixels from each quadrant. If the there are fewer than three noisy pixels in the level2.evt file, extra rows are filled as -1
| Pixel properties | Quadrant properties | ||||||
|---|---|---|---|---|---|---|---|
| Quadrant | DetID | PixID | Counts | Sigma | Mean | Median | Sigma |
| A | 15 | 174 | 120016 | 667.79 | 897 | 883 | 178.4 |
| A | 0 | 226 | 8040 | 40.12 | 897 | 883 | 178.4 |
| A | 12 | 194 | 6604 | 32.07 | 897 | 883 | 178.4 |
| B | 0 | 189 | 41954 | 244.74 | 888 | 870 | 167.9 |
| B | 4 | 173 | 23700 | 136.0 | 888 | 870 | 167.9 |
| B | 0 | 244 | 19293 | 109.75 | 888 | 870 | 167.9 |
| C | 9 | 236 | 199743 | 1018.68 | 851 | 861 | 195.2 |
| C | 14 | 238 | 134130 | 682.61 | 851 | 861 | 195.2 |
| C | 3 | 233 | 17321 | 84.31 | 851 | 861 | 195.2 |
| D | 1 | 52 | 483232 | 2275.29 | 874 | 852 | 212.0 |
| D | 2 | 234 | 22782 | 103.44 | 874 | 852 | 212.0 |
| D | 13 | 172 | 20320 | 91.83 | 874 | 852 | 212.0 |
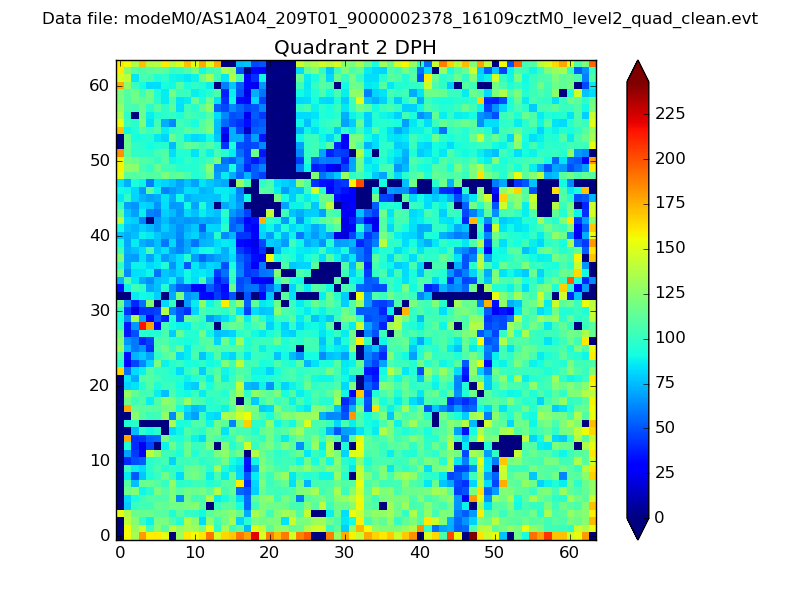
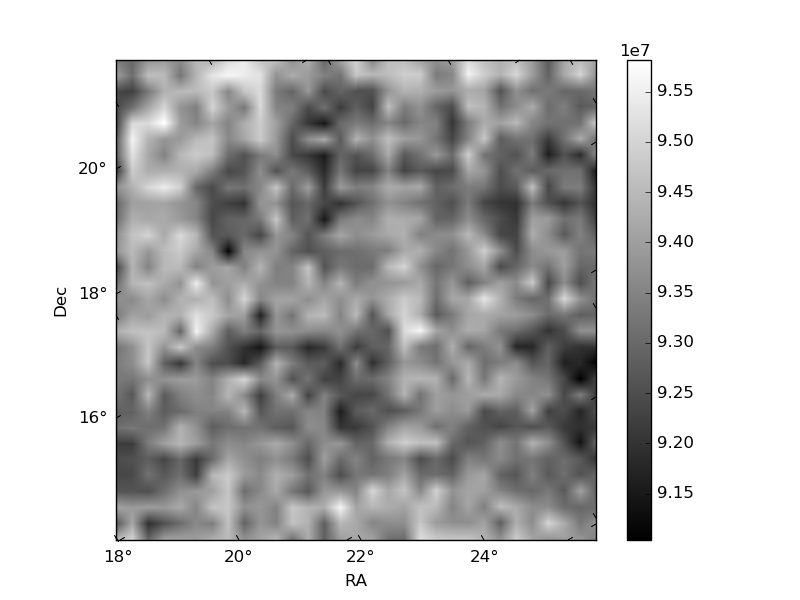
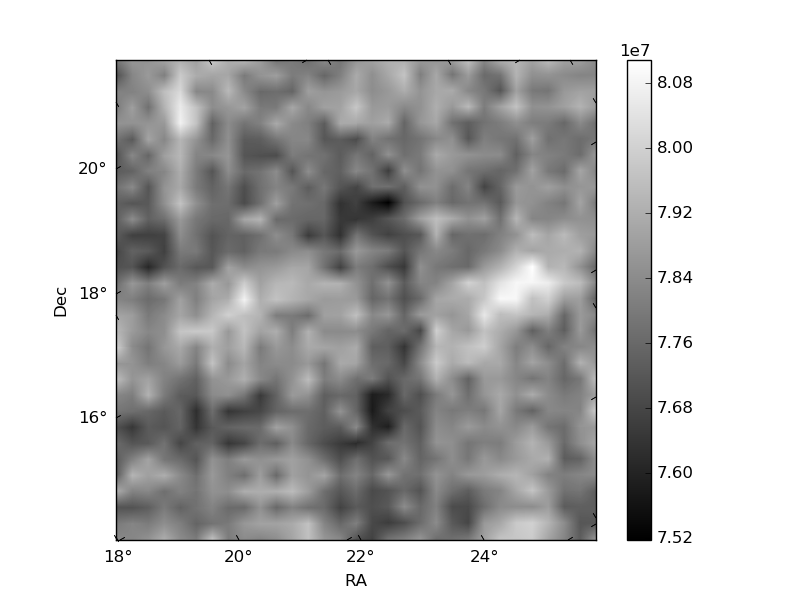
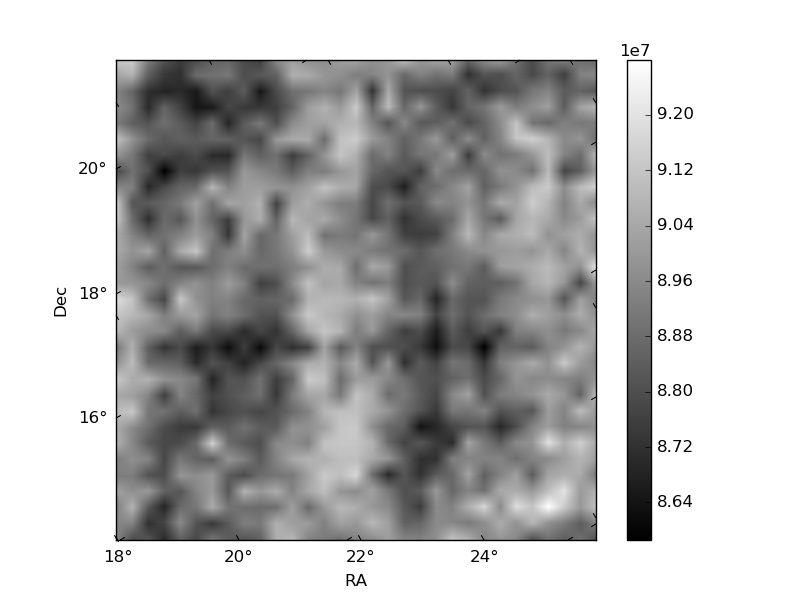
Histogram calculated using DETX and DETY for each event in the final _common_clean file
| Quadrant A | 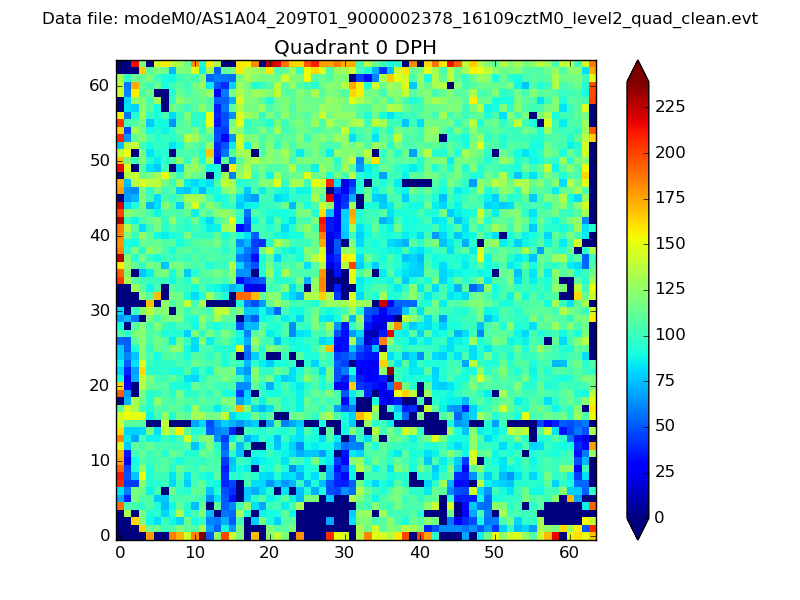 |
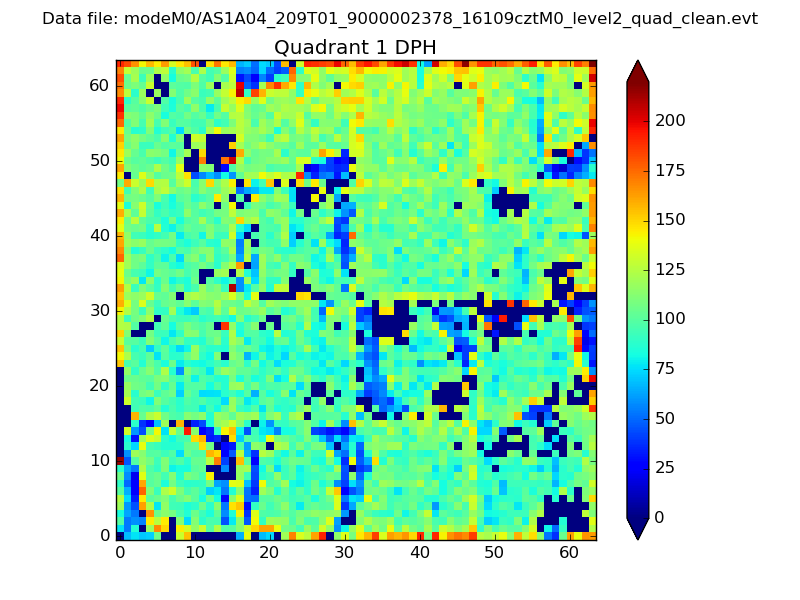 |
Quadrant B |
|---|---|---|---|
| Quadrant D | 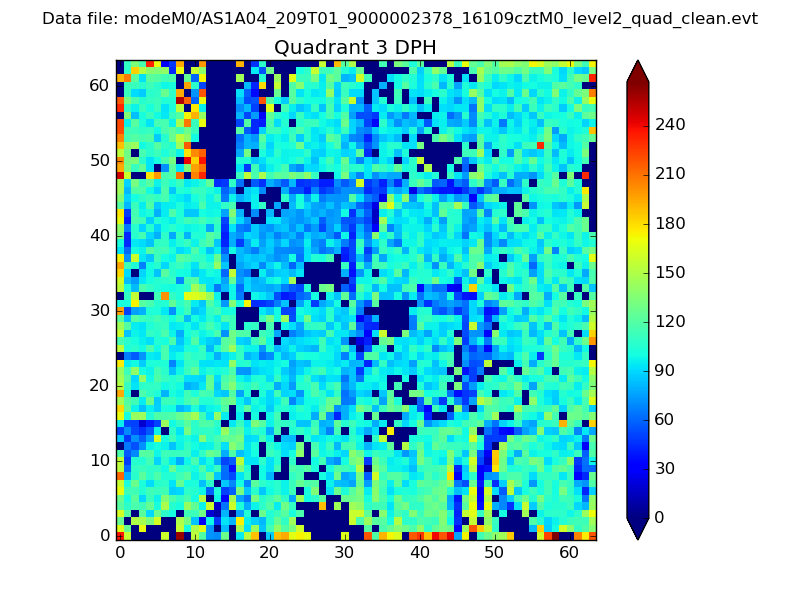 |
 |
Quadrant C |
| Plot type | Count rate plots | Images |
|---|---|---|
| Comparison with Poisson distribution Blue bars denote a histogram of data divided into 1 sec bins. Red curve is a Poisson curve with rate = median count rate of data. |
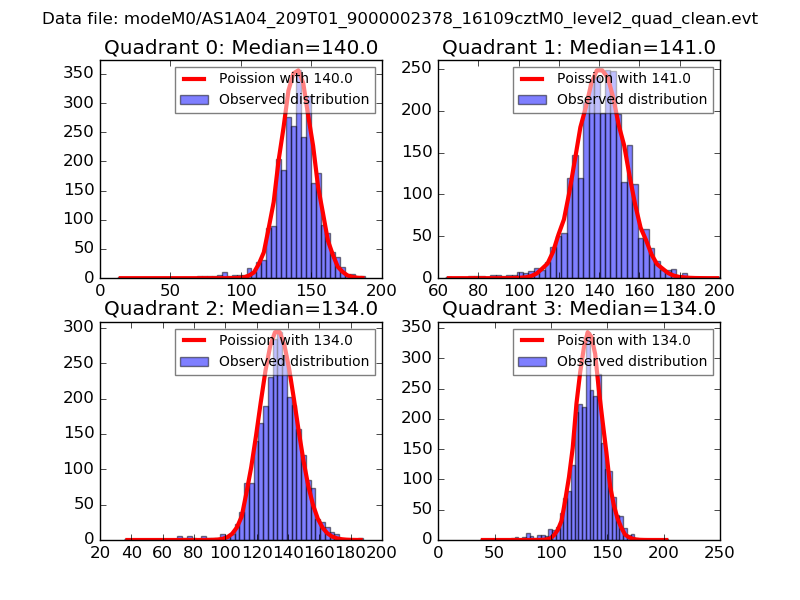 |
 |
| Quadrant-wise count rates Data is divided into 100 sec bins |
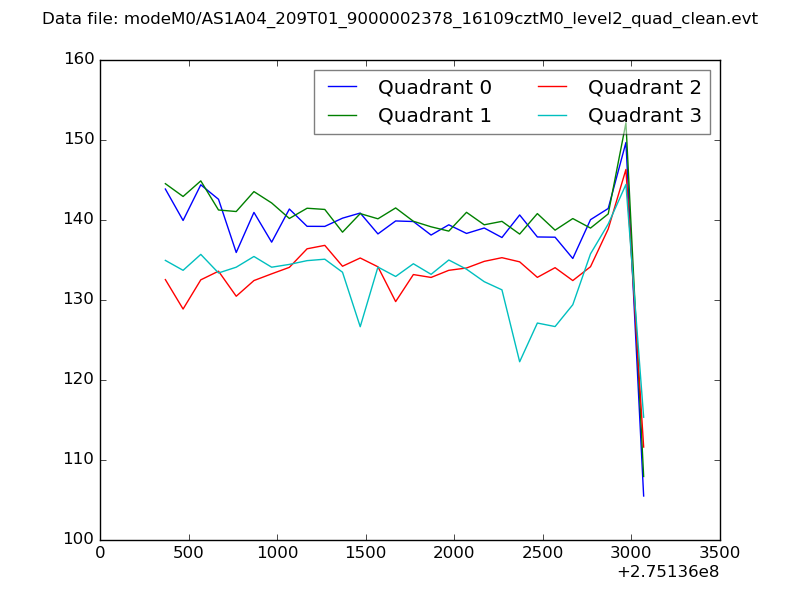 |
|
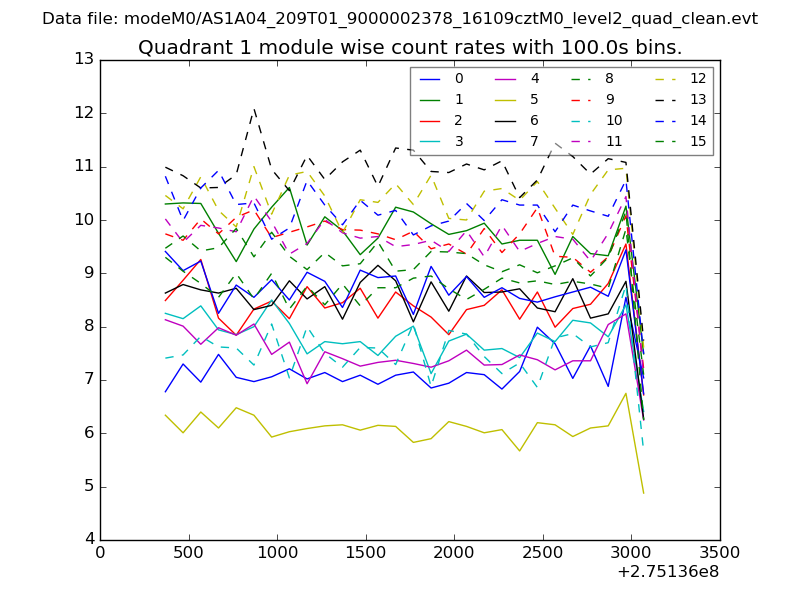
| Module-wise count rates for Quadrant A Data is divided into 100 sec bins |
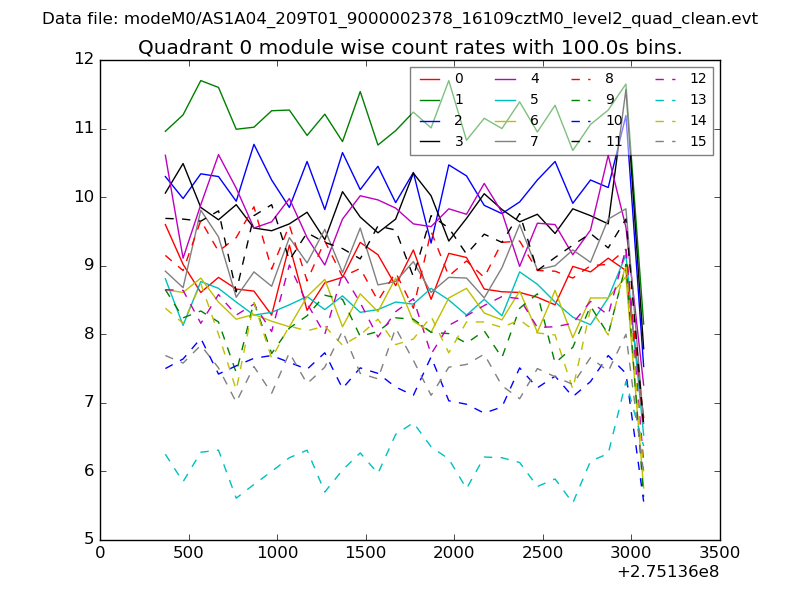 |
 |
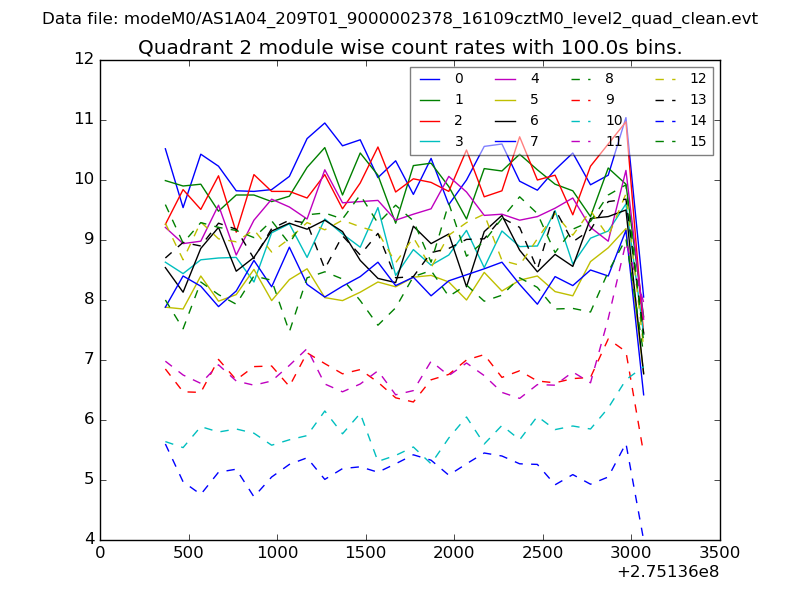
| Module-wise count rates for Quadrant B Data is divided into 100 sec bins |
 |
 |
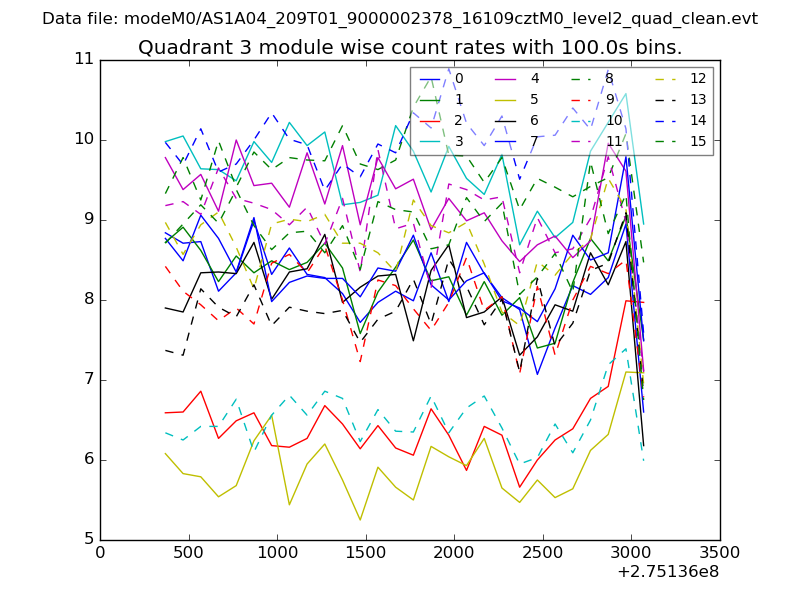
| Module-wise count rates for Quadrant C Data is divided into 100 sec bins |
 |
 |
| Module-wise count rates for Quadrant D Data is divided into 100 sec bins |
 |
 |
| Parameter | Plot |
|---|---|
| CZT HV Monitor | 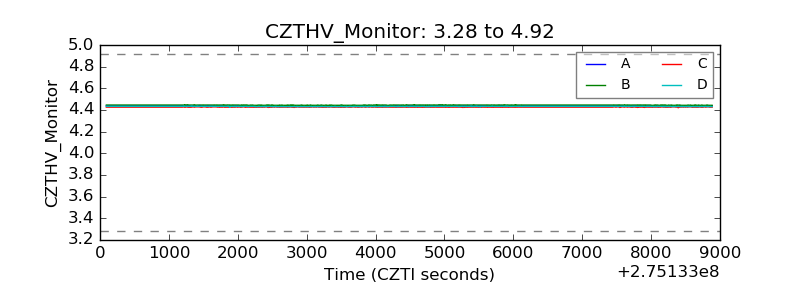 |
| D_VDD |  |
| Temperature 1 | 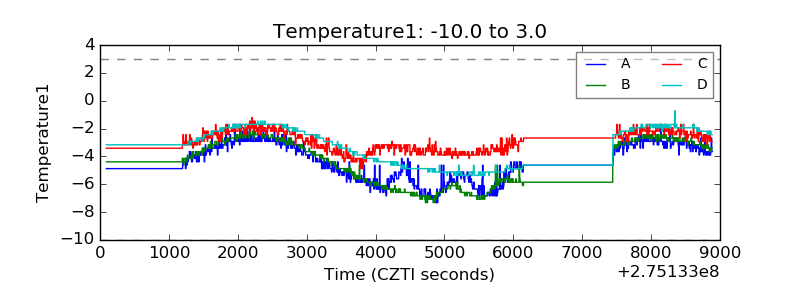 |
| Veto HV Monitor | 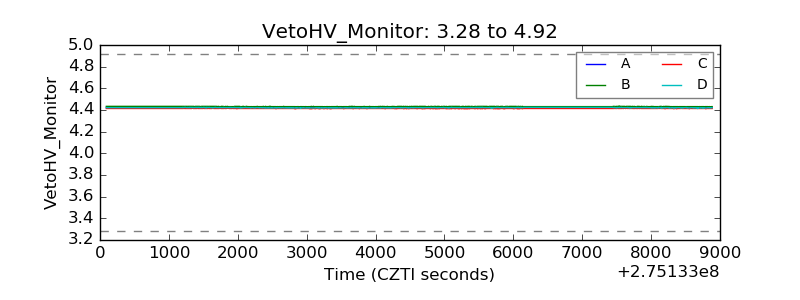 |
| Veto LLD | 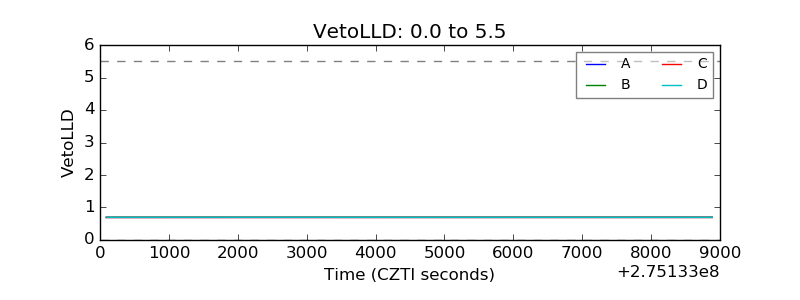 |
| Alpha Counter | 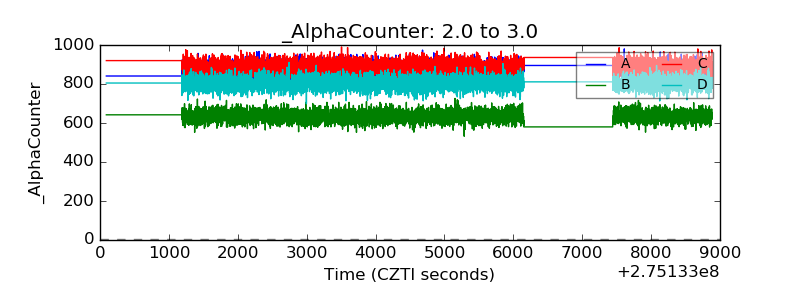 |
| _CPM_Rate |  |
| CZT Counter |  |
| +2.5 Volts monitor |  |
| +5 Volts monitor |  |
| _ROLL_ROT | 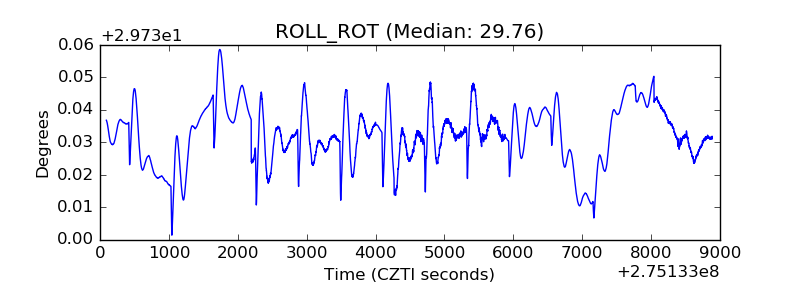 |
| _Roll_DEC | 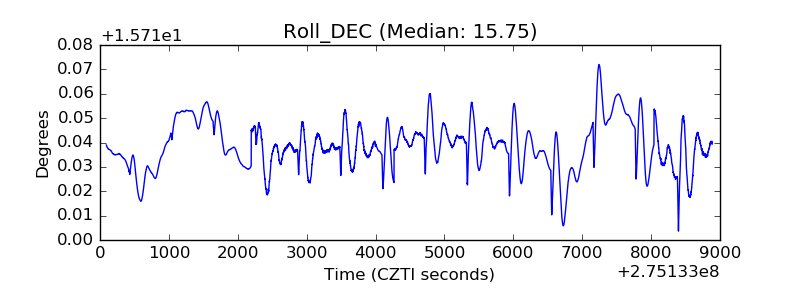 |
| _Roll_RA |  |
| Veto Counter | 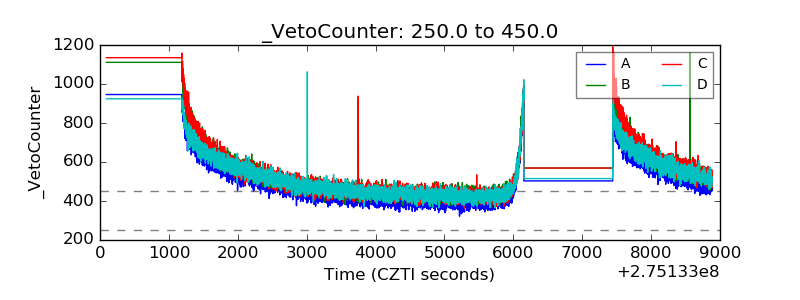 |