| Param | Original file | Final file |
|---|---|---|
| Filename | modeM0/AS1A04_209T01_9000002378_16112cztM0_level2.evt | modeM0/AS1A04_209T01_9000002378_16112cztM0_level2_quad_clean.evt |
| Size (bytes) | 532,140,480 | 90,509,760 |
| Size | 507.5 MB | 86.3 MB |
| Events in quadrant A | 4,451,325 | 569,389 |
| Events in quadrant B | 3,373,619 | 590,176 |
| Events in quadrant C | 3,823,811 | 564,072 |
| Events in quadrant D | 4,017,474 | 555,166 |
| Mode M0 | |||
|---|---|---|---|
| Quadrant | BADHDUFLAG | Total packets | Discarded packets |
| A | 0 | 17639 | 3 |
| B | 0 | 14222 | 2 |
| C | 0 | 15598 | 2 |
| D | 0 | 16249 | 2 |
| Mode M9 | |||
|---|---|---|---|
| Quadrant | BADHDUFLAG | Total packets | Discarded packets |
| A | 0 | 21 | 0 |
| B | 0 | 21 | 0 |
| C | 0 | 21 | 0 |
| D | 0 | 22 | 0 |
| Mode SS | |||
|---|---|---|---|
| Quadrant | BADHDUFLAG | Total packets | Discarded packets |
| A | 0 | 134 | 0 |
| B | 0 | 134 | 0 |
| C | 0 | 134 | 0 |
| D | 0 | 134 | 0 |
| Quadrant | Total seconds | Saturated seconds | Saturation percentage |
|---|---|---|---|
| A | 6627 | 529 | 7.982496% |
| B | 6627 | 89 | 1.342991% |
| C | 6627 | 193 | 2.912328% |
| D | 6627 | 214 | 3.229214% |
Noise dominated data is calculated using 1-second bins in cleaned event files. If a bin has >2000 counts, and if more than 50% of those come from <1% of pixels, then it is considered to be noise-dominated and hence unusable.
| Quadrant | # 1 sec bins | Bins with >0 counts | Bins with >2000 counts | High rate bins dominated by noise | Noise dominated (total time) | Noise dominated (detector-on time) | Marked lightcurve |
|---|---|---|---|---|---|---|---|
| A | 7648 | 6628 | 304 | 304 | 3.97% | 4.59% | 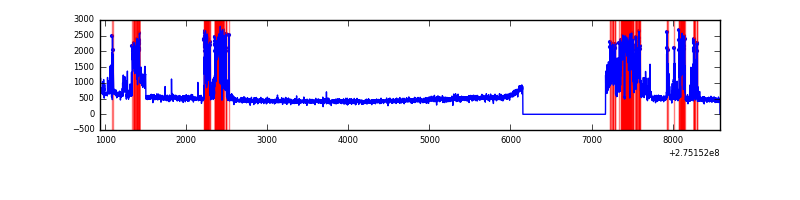 |
| B | 7648 | 6628 | 2 | 2 | 0.03% | 0.03% | 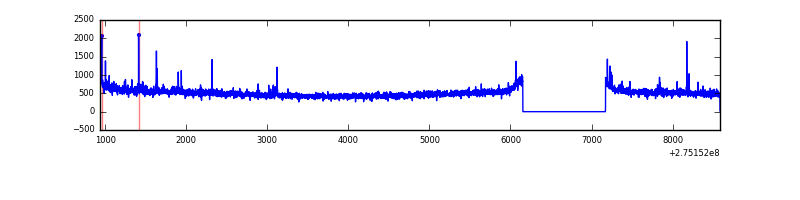 |
| C | 7648 | 6628 | 35 | 35 | 0.46% | 0.53% | 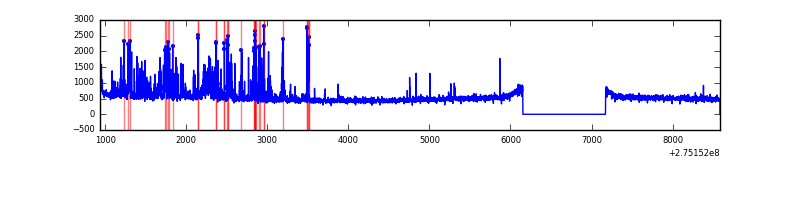 |
| D | 7648 | 6628 | 146 | 146 | 1.91% | 2.20% |  |
Top three noisy pixels from each quadrant. If the there are fewer than three noisy pixels in the level2.evt file, extra rows are filled as -1
| Pixel properties | Quadrant properties | ||||||
|---|---|---|---|---|---|---|---|
| Quadrant | DetID | PixID | Counts | Sigma | Mean | Median | Sigma |
| A | 15 | 174 | 1298595 | 7802.34 | 820 | 803 | 166.3 |
| A | 0 | 226 | 7422 | 39.79 | 820 | 803 | 166.3 |
| A | 12 | 194 | 6098 | 31.83 | 820 | 803 | 166.3 |
| B | 0 | 190 | 27060 | 161.07 | 840 | 819 | 162.9 |
| B | 0 | 189 | 19801 | 116.52 | 840 | 819 | 162.9 |
| B | 4 | 216 | 19427 | 114.22 | 840 | 819 | 162.9 |
| C | 9 | 236 | 531648 | 2813.67 | 808 | 813 | 188.7 |
| C | 14 | 238 | 124061 | 653.27 | 808 | 813 | 188.7 |
| C | 3 | 233 | 8754 | 42.09 | 808 | 813 | 188.7 |
| D | 15 | 0 | 522682 | 2630.18 | 820 | 794 | 198.4 |
| D | 1 | 52 | 304983 | 1533.03 | 820 | 794 | 198.4 |
| D | 5 | 222 | 65451 | 325.85 | 820 | 794 | 198.4 |
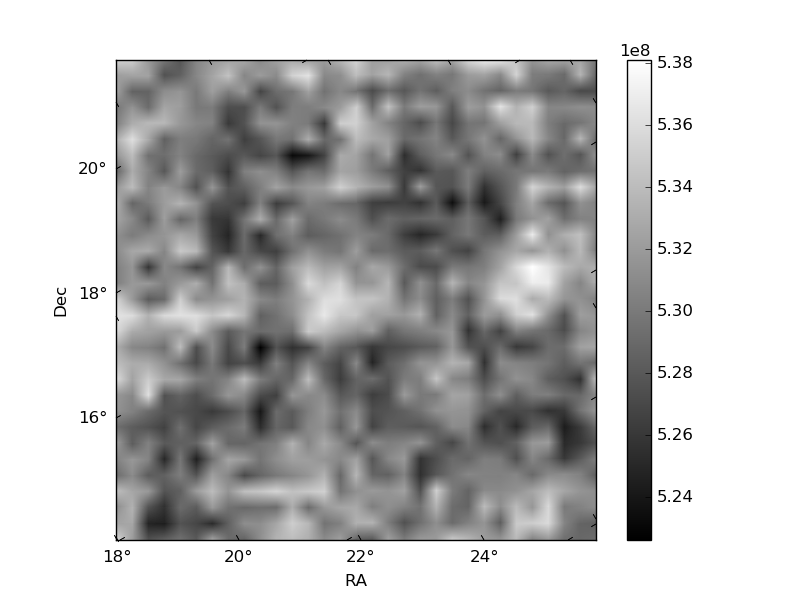
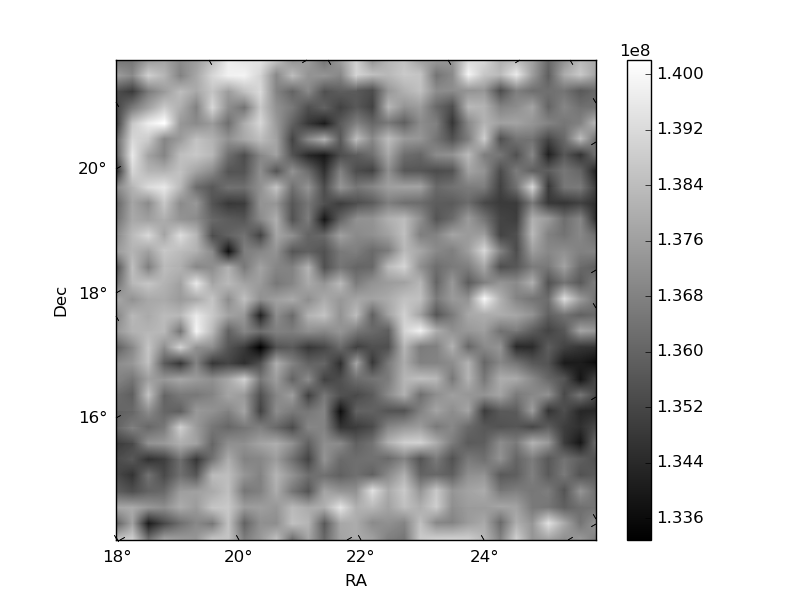
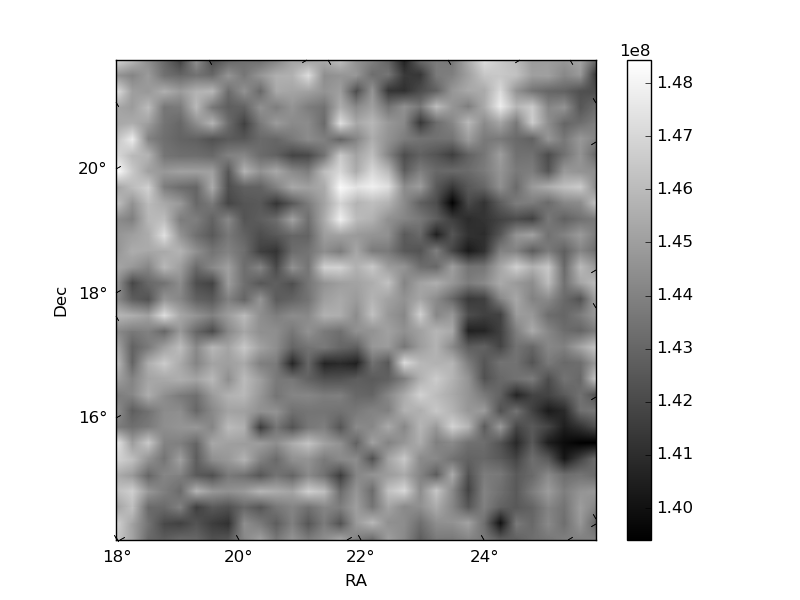
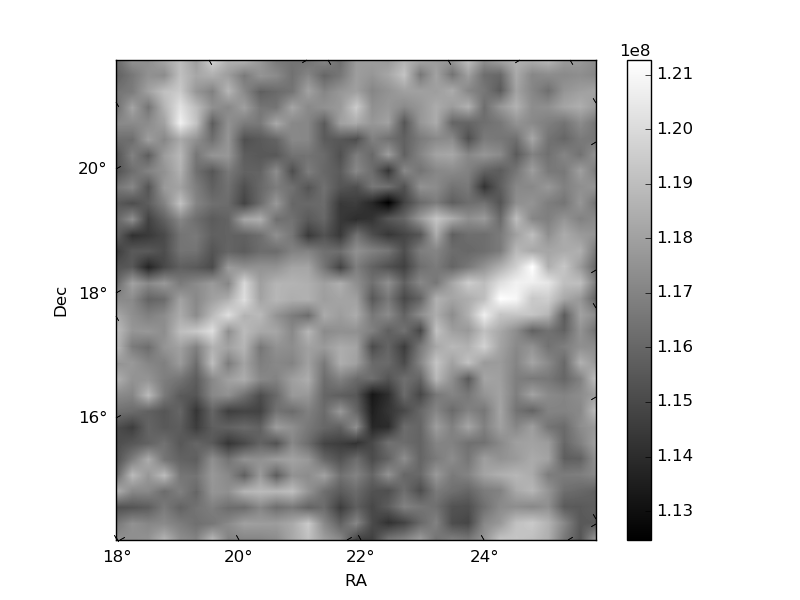
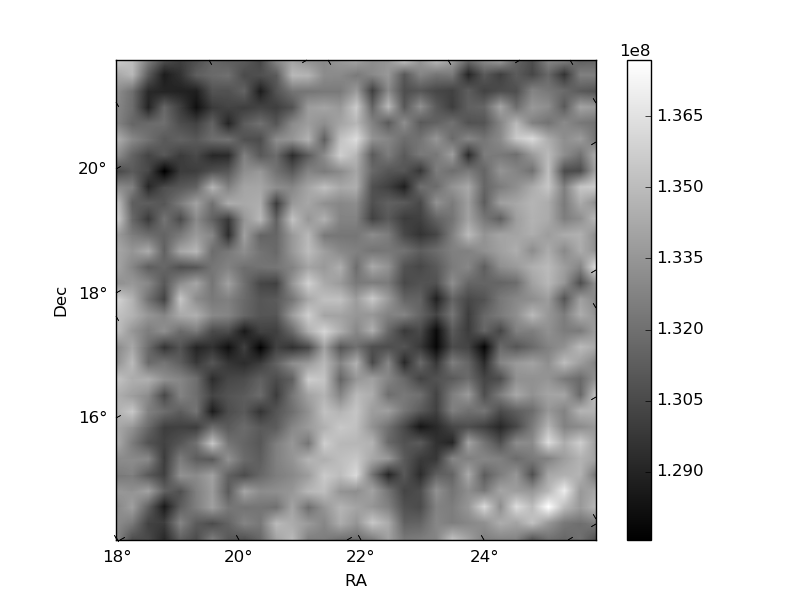
Histogram calculated using DETX and DETY for each event in the final _common_clean file
| Quadrant A |  |
 |
Quadrant B |
|---|---|---|---|
| Quadrant D |  |
 |
Quadrant C |
| Plot type | Count rate plots | Images |
|---|---|---|
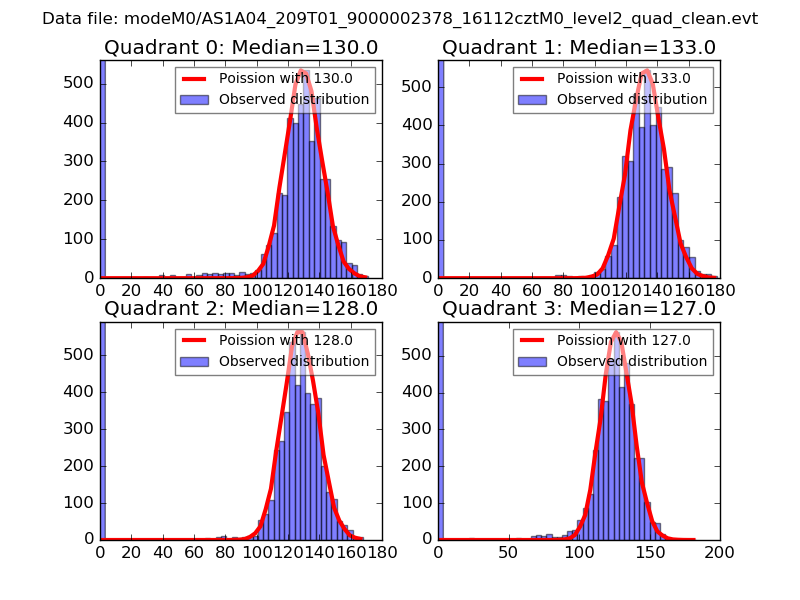
| Comparison with Poisson distribution Blue bars denote a histogram of data divided into 1 sec bins. Red curve is a Poisson curve with rate = median count rate of data. |
 |
 |
| Quadrant-wise count rates Data is divided into 100 sec bins |
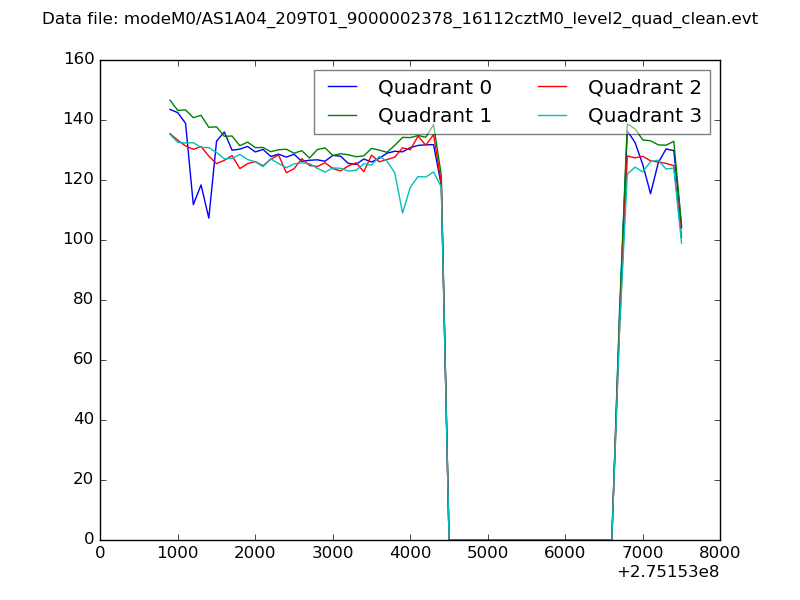 |
|
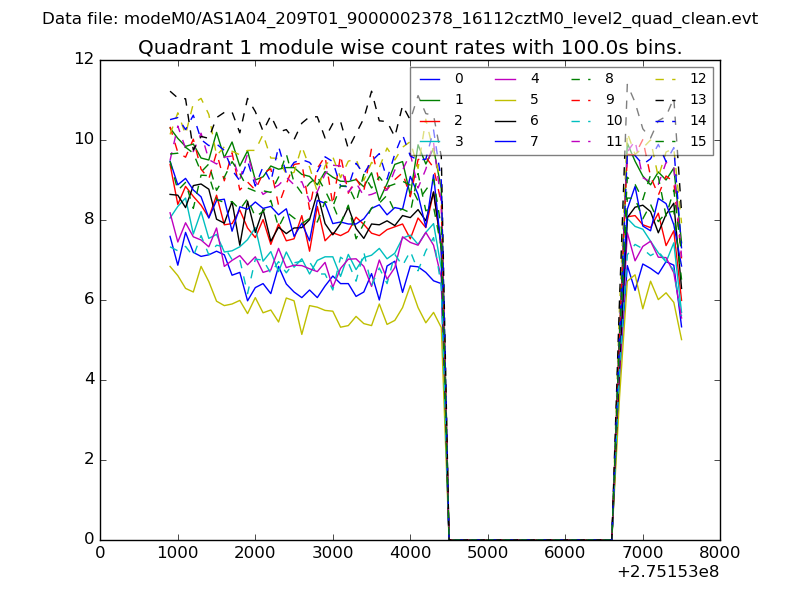
| Module-wise count rates for Quadrant A Data is divided into 100 sec bins |
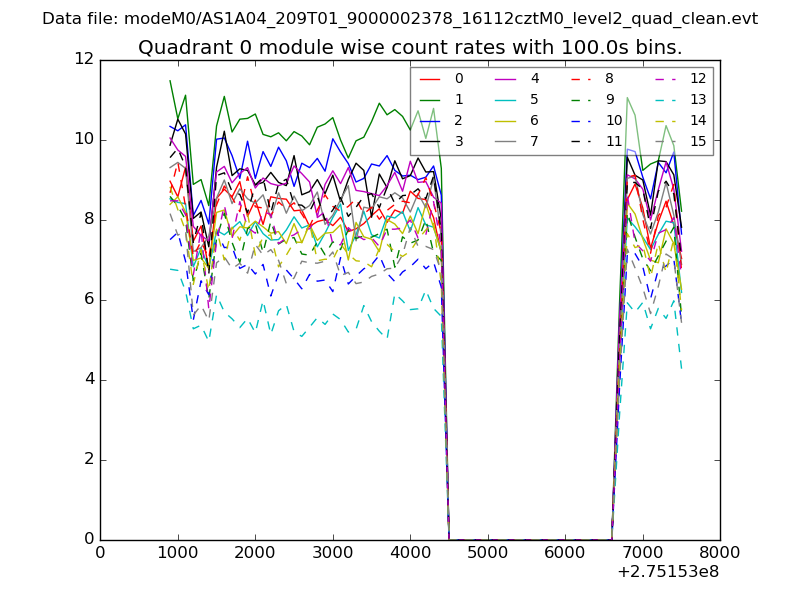 |
 |
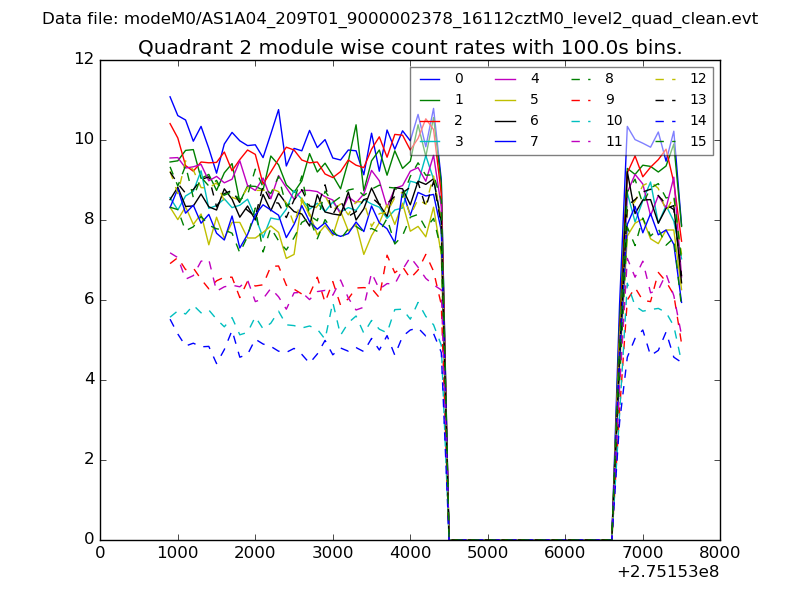
| Module-wise count rates for Quadrant B Data is divided into 100 sec bins |
 |
 |
| Module-wise count rates for Quadrant C Data is divided into 100 sec bins |
 |
 |
| Module-wise count rates for Quadrant D Data is divided into 100 sec bins |
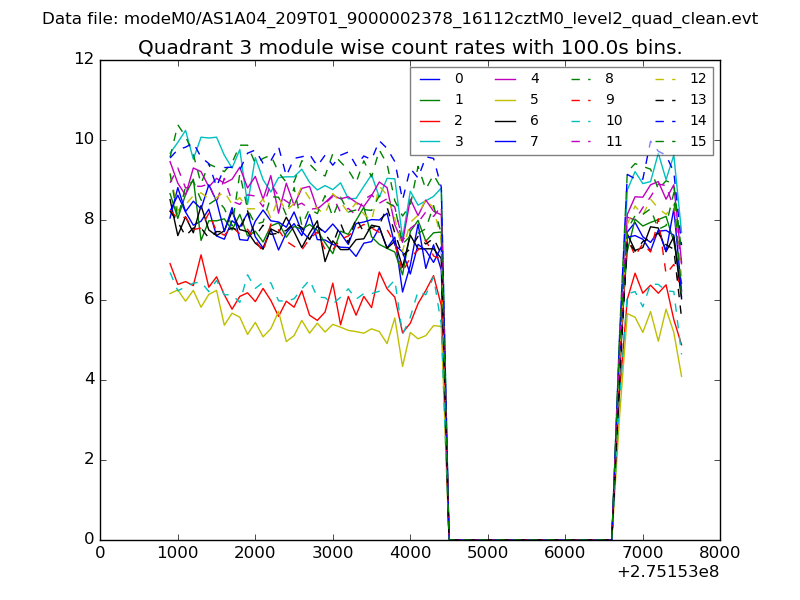 |
 |
| Parameter | Plot |
|---|---|
| CZT HV Monitor | 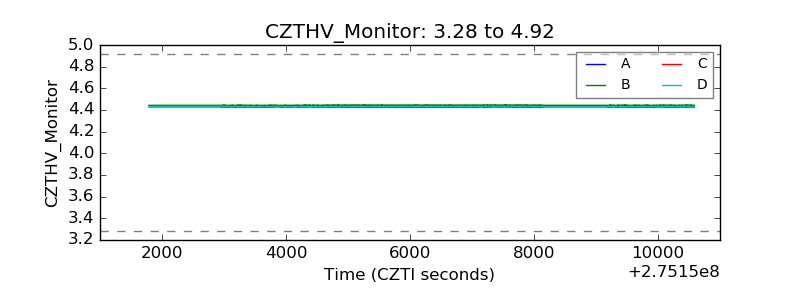 |
| D_VDD | 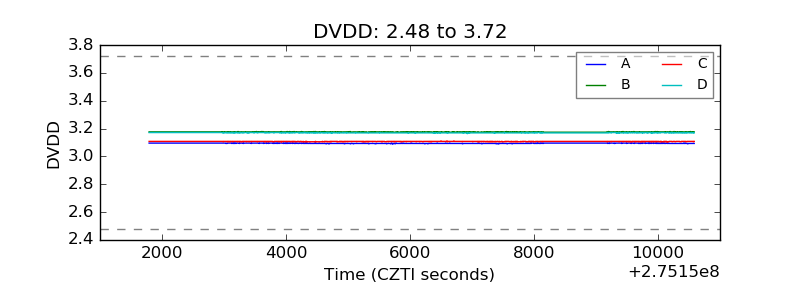 |
| Temperature 1 | 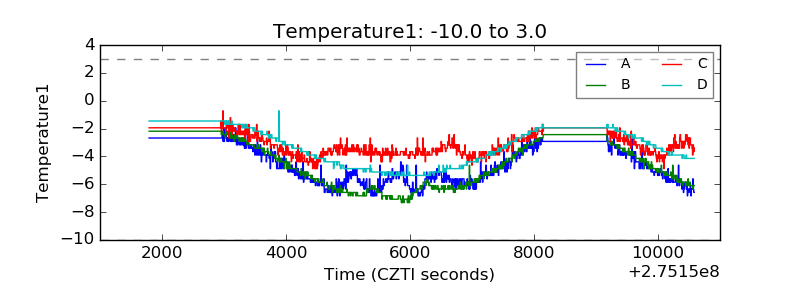 |
| Veto HV Monitor | 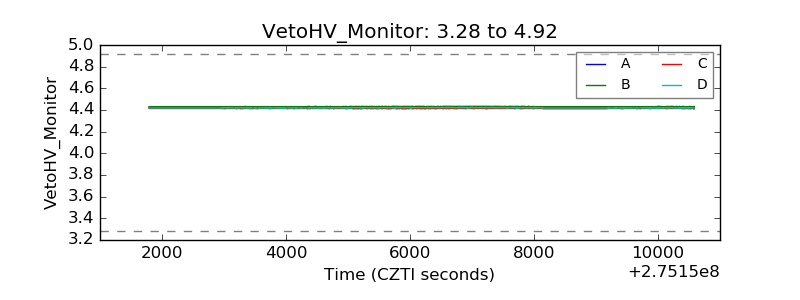 |
| Veto LLD | 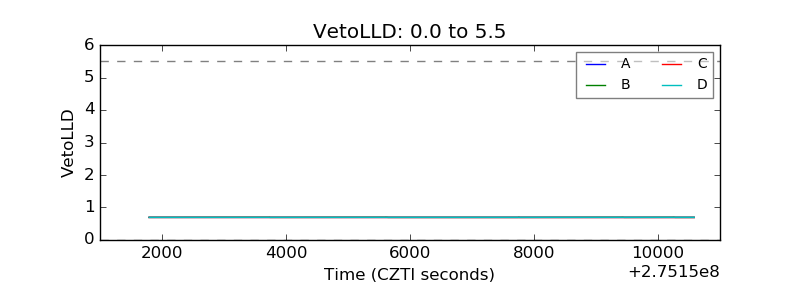 |
| Alpha Counter | 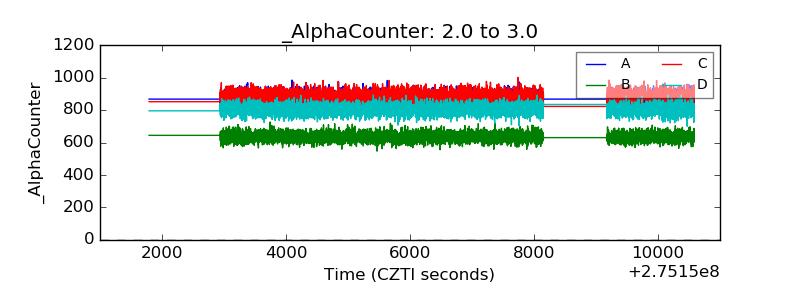 |
| _CPM_Rate | 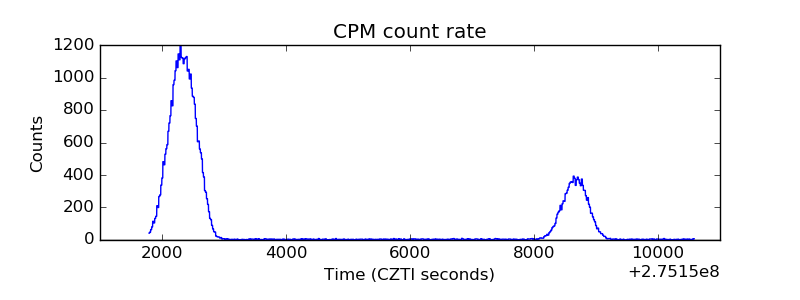 |
| CZT Counter |  |
| +2.5 Volts monitor |  |
| +5 Volts monitor |  |
| _ROLL_ROT | 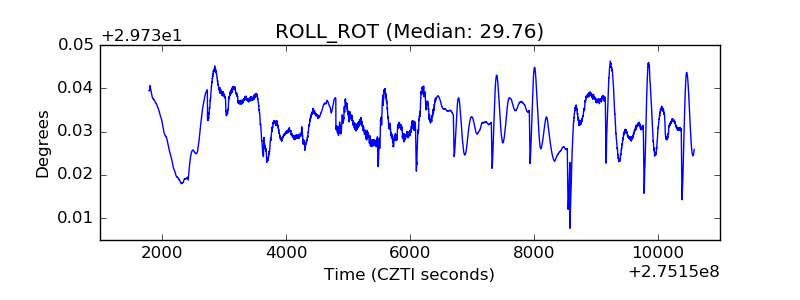 |
| _Roll_DEC | 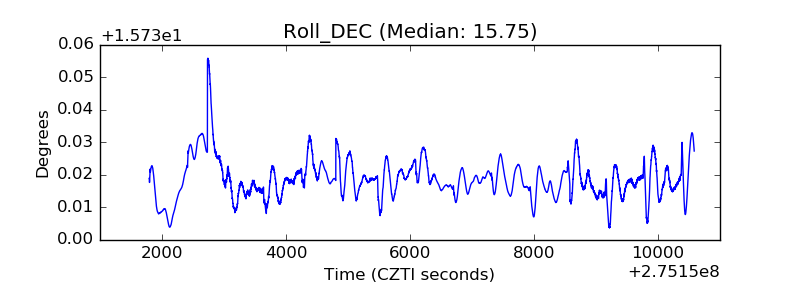 |
| _Roll_RA | 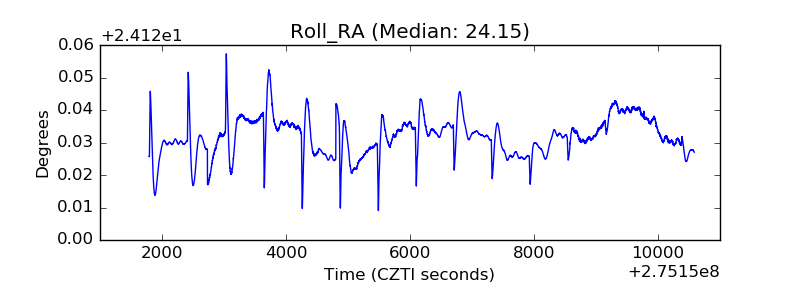 |
| Veto Counter | 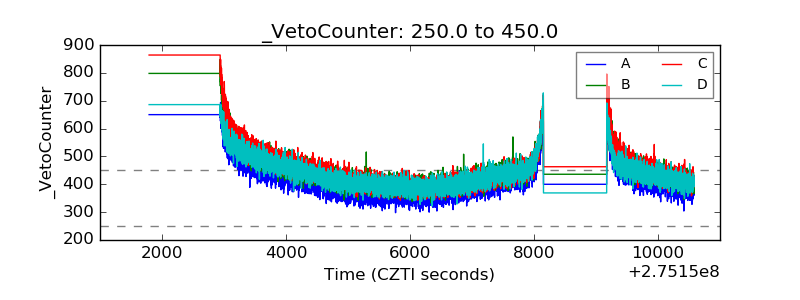 |