| Param | Original file | Final file |
|---|---|---|
| Filename | modeM0/AS1A04_209T01_9000002378_16113cztM0_level2.evt | modeM0/AS1A04_209T01_9000002378_16113cztM0_level2_quad_clean.evt |
| Size (bytes) | 609,019,200 | 94,098,240 |
| Size | 580.8 MB | 89.7 MB |
| Events in quadrant A | 4,249,943 | 594,002 |
| Events in quadrant B | 3,757,736 | 606,049 |
| Events in quadrant C | 4,024,062 | 579,703 |
| Events in quadrant D | 5,910,600 | 554,374 |
| Mode M0 | |||
|---|---|---|---|
| Quadrant | BADHDUFLAG | Total packets | Discarded packets |
| A | 0 | 17567 | 3 |
| B | 0 | 15902 | 2 |
| C | 0 | 16592 | 2 |
| D | 0 | 22698 | 2 |
| Mode M9 | |||
|---|---|---|---|
| Quadrant | BADHDUFLAG | Total packets | Discarded packets |
| A | 0 | 16 | 0 |
| B | 0 | 16 | 0 |
| C | 0 | 16 | 0 |
| D | 0 | 16 | 0 |
| Mode SS | |||
|---|---|---|---|
| Quadrant | BADHDUFLAG | Total packets | Discarded packets |
| A | 0 | 154 | 0 |
| B | 0 | 154 | 0 |
| C | 0 | 154 | 0 |
| D | 0 | 154 | 0 |
| Quadrant | Total seconds | Saturated seconds | Saturation percentage |
|---|---|---|---|
| A | 7397 | 359 | 4.853319% |
| B | 7397 | 113 | 1.527646% |
| C | 7397 | 198 | 2.676761% |
| D | 7397 | 482 | 6.516155% |
Noise dominated data is calculated using 1-second bins in cleaned event files. If a bin has >2000 counts, and if more than 50% of those come from <1% of pixels, then it is considered to be noise-dominated and hence unusable.
| Quadrant | # 1 sec bins | Bins with >0 counts | Bins with >2000 counts | High rate bins dominated by noise | Noise dominated (total time) | Noise dominated (detector-on time) | Marked lightcurve |
|---|---|---|---|---|---|---|---|
| A | 9083 | 7399 | 168 | 168 | 1.85% | 2.27% | 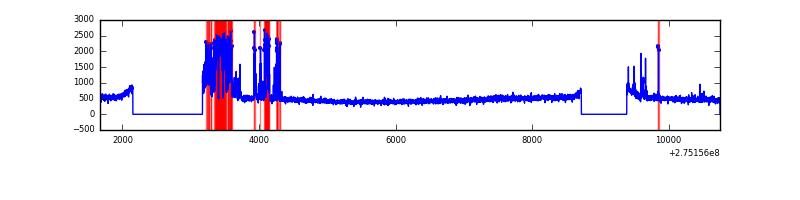 |
| B | 9083 | 7398 | 1 | 1 | 0.01% | 0.01% | 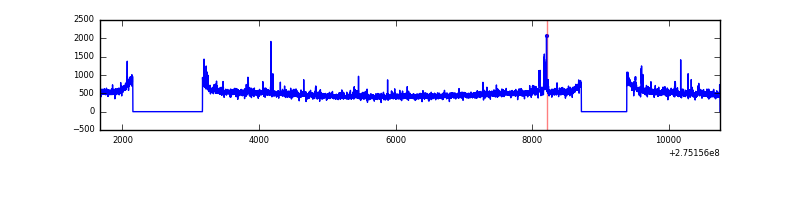 |
| C | 9083 | 7398 | 53 | 53 | 0.58% | 0.72% | 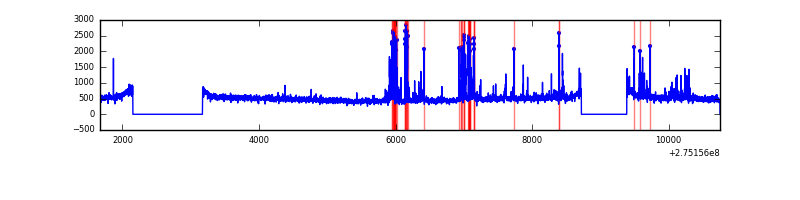 |
| D | 9083 | 7399 | 419 | 419 | 4.61% | 5.66% | 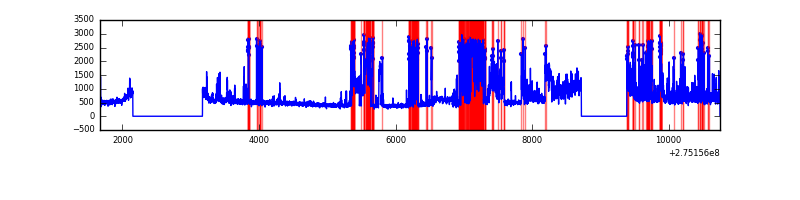 |
Top three noisy pixels from each quadrant. If the there are fewer than three noisy pixels in the level2.evt file, extra rows are filled as -1
| Pixel properties | Quadrant properties | ||||||
|---|---|---|---|---|---|---|---|
| Quadrant | DetID | PixID | Counts | Sigma | Mean | Median | Sigma |
| A | 15 | 174 | 737413 | 3977.81 | 913 | 893 | 185.2 |
| A | 0 | 226 | 8067 | 38.75 | 913 | 893 | 185.2 |
| A | 12 | 194 | 6794 | 31.87 | 913 | 893 | 185.2 |
| B | 0 | 189 | 61463 | 336.53 | 925 | 902 | 180.0 |
| B | 4 | 48 | 23139 | 123.57 | 925 | 902 | 180.0 |
| B | 12 | 111 | 21250 | 113.07 | 925 | 902 | 180.0 |
| C | 9 | 236 | 396085 | 1899.69 | 889 | 895 | 208.0 |
| C | 14 | 238 | 134156 | 640.59 | 889 | 895 | 208.0 |
| C | 3 | 233 | 16448 | 74.76 | 889 | 895 | 208.0 |
| D | 15 | 0 | 1560545 | 7249.94 | 889 | 864 | 215.1 |
| D | 1 | 52 | 673558 | 3126.91 | 889 | 864 | 215.1 |
| D | 5 | 222 | 309866 | 1436.35 | 889 | 864 | 215.1 |
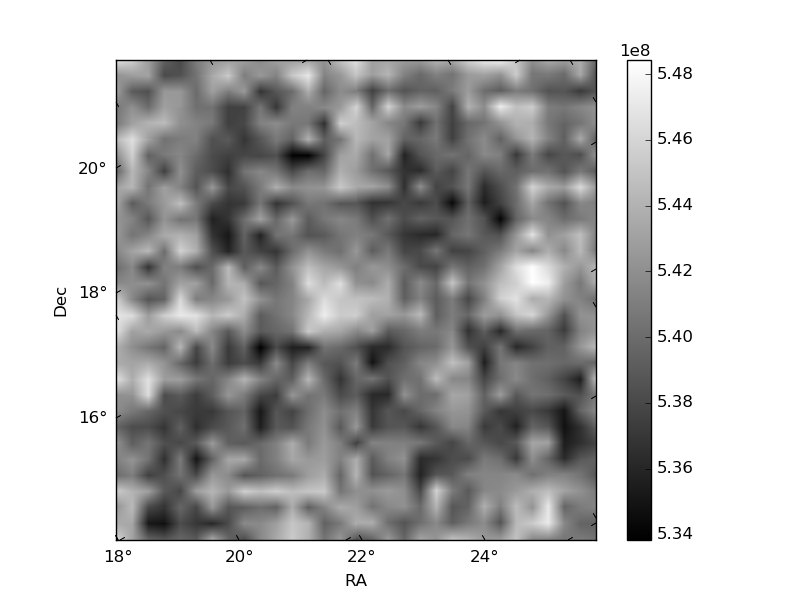
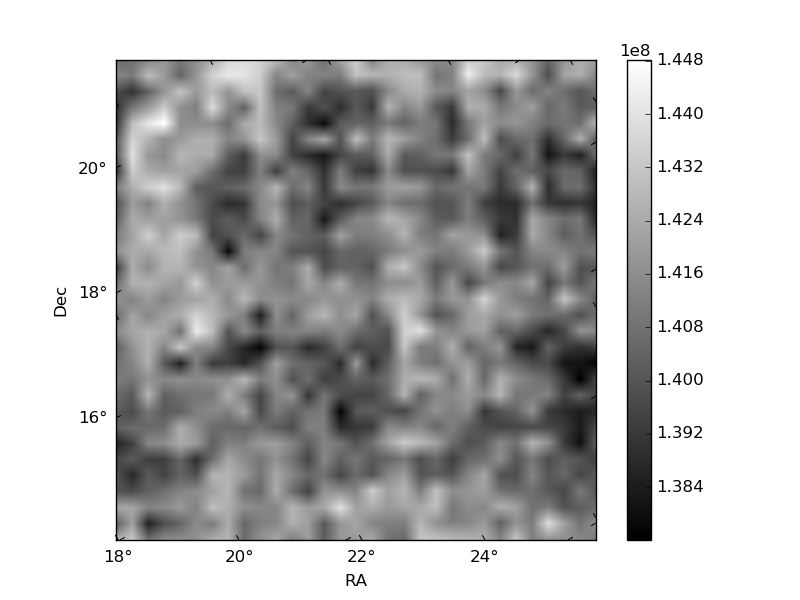
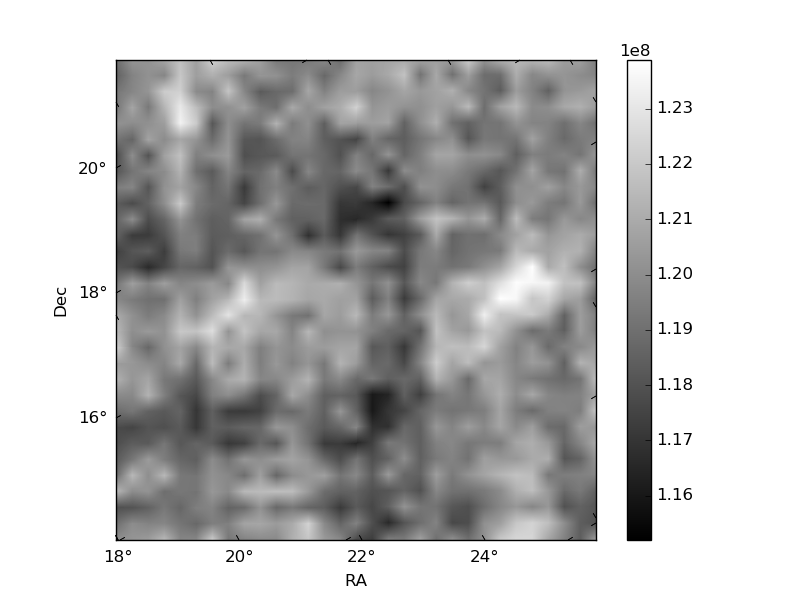
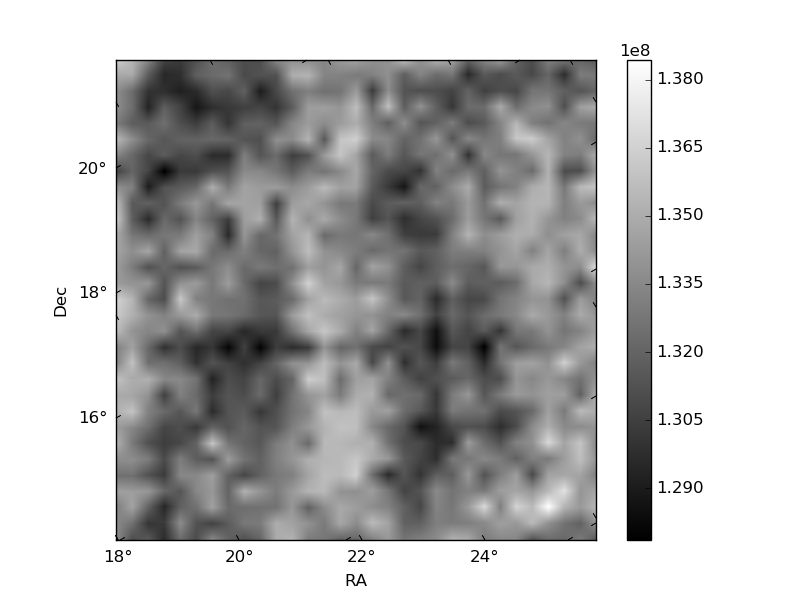
Histogram calculated using DETX and DETY for each event in the final _common_clean file
| Quadrant A | 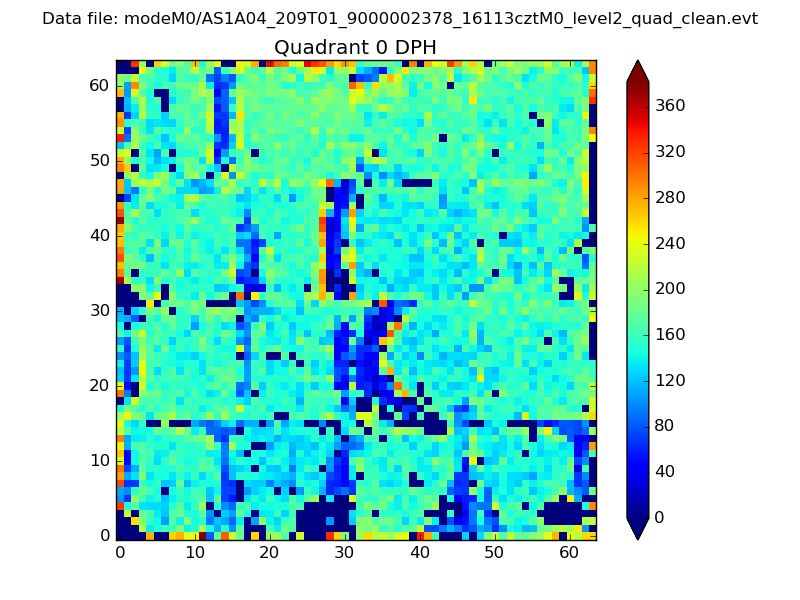 |
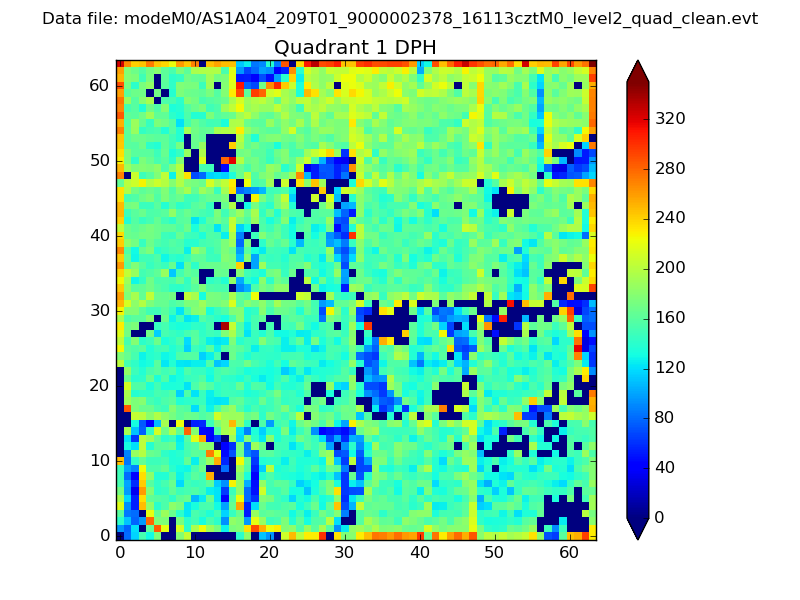 |
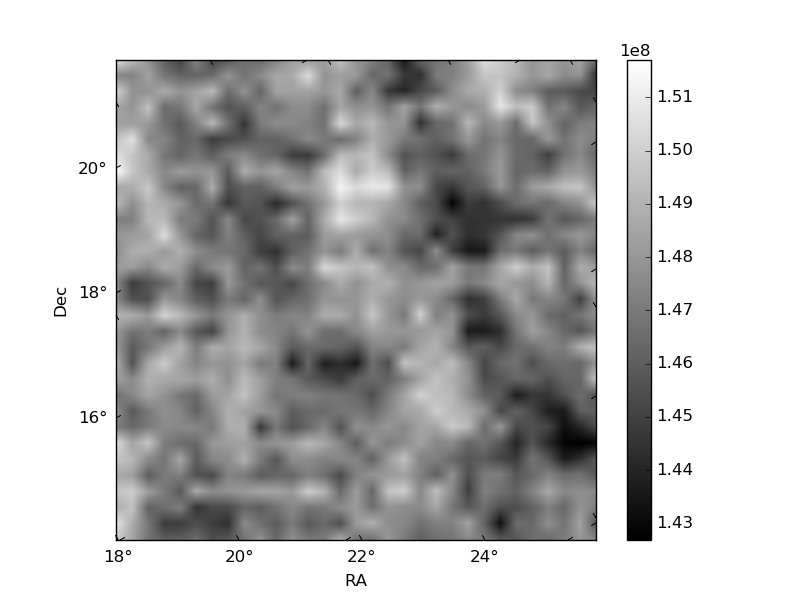
Quadrant B |
|---|---|---|---|
| Quadrant D | 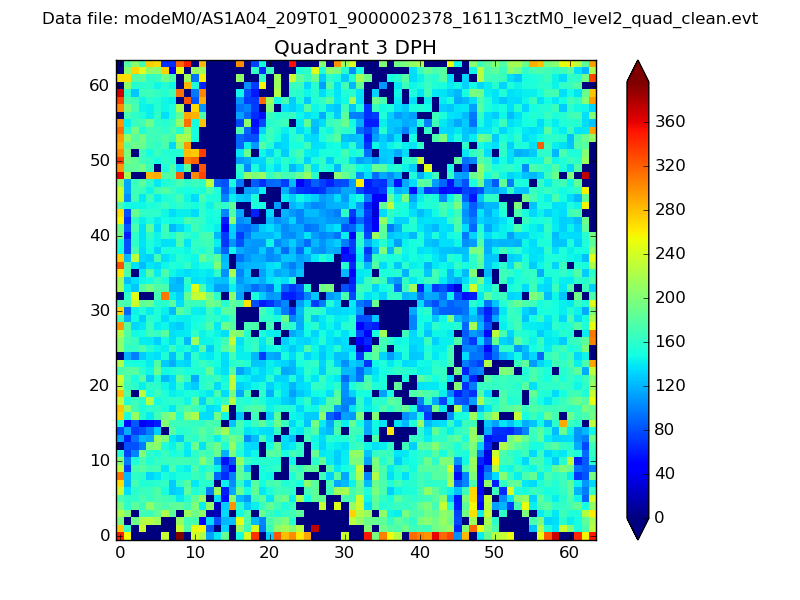 |
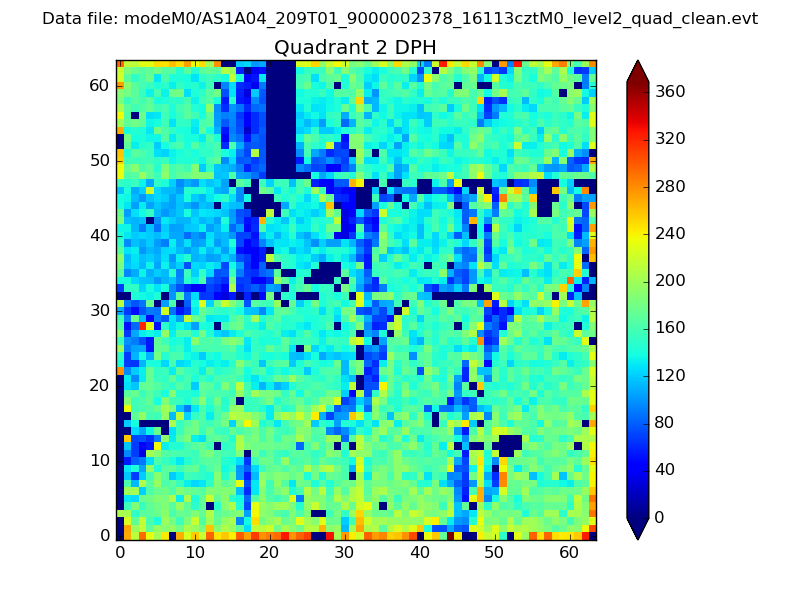 |
Quadrant C |
| Plot type | Count rate plots | Images |
|---|---|---|
| Comparison with Poisson distribution Blue bars denote a histogram of data divided into 1 sec bins. Red curve is a Poisson curve with rate = median count rate of data. |
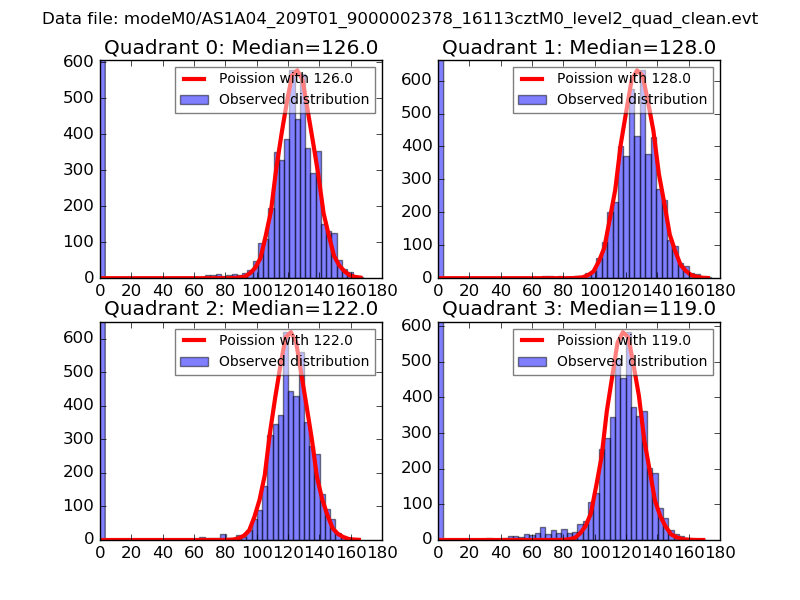 |
 |
| Quadrant-wise count rates Data is divided into 100 sec bins |
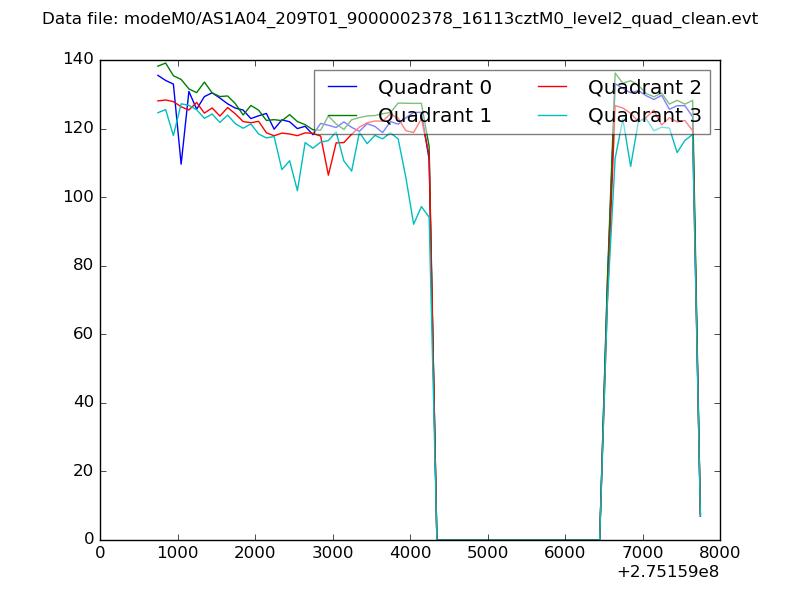 |
|
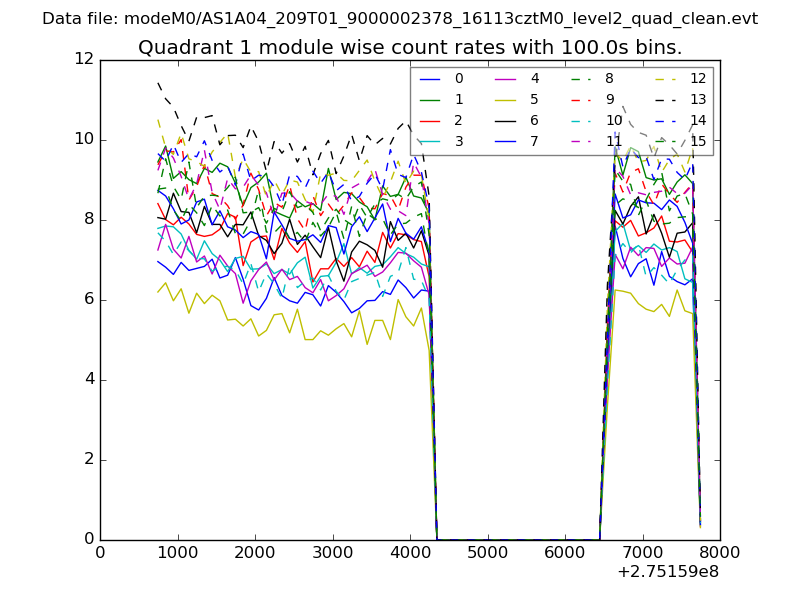
| Module-wise count rates for Quadrant A Data is divided into 100 sec bins |
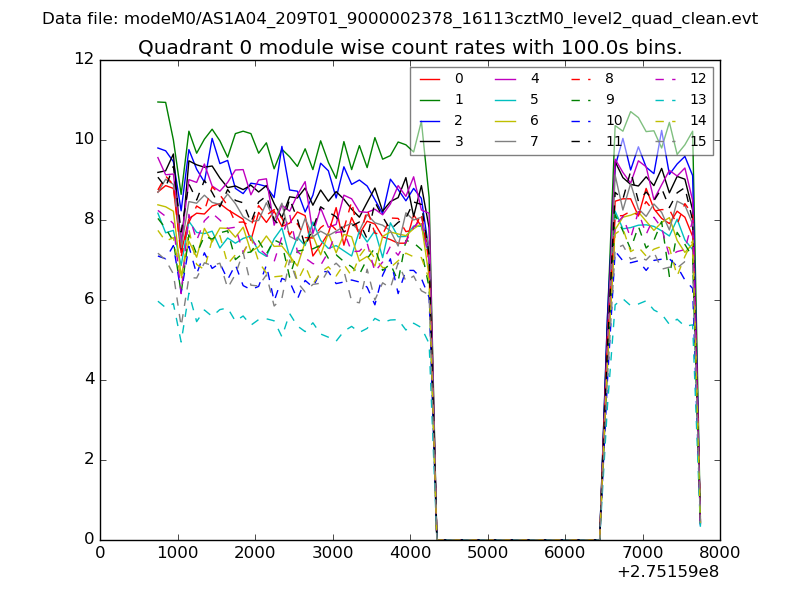 |
 |
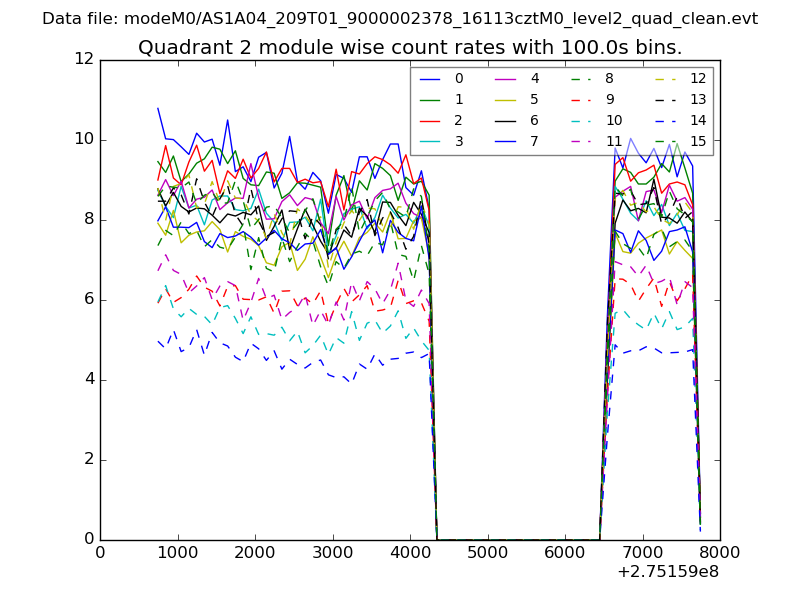
| Module-wise count rates for Quadrant B Data is divided into 100 sec bins |
 |
 |
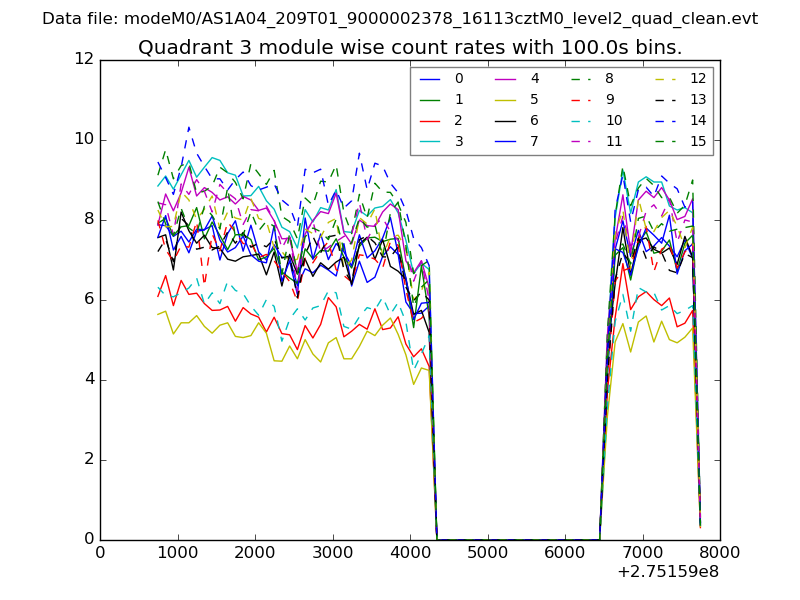
| Module-wise count rates for Quadrant C Data is divided into 100 sec bins |
 |
 |
| Module-wise count rates for Quadrant D Data is divided into 100 sec bins |
 |
 |
| Parameter | Plot |
|---|---|
| CZT HV Monitor | 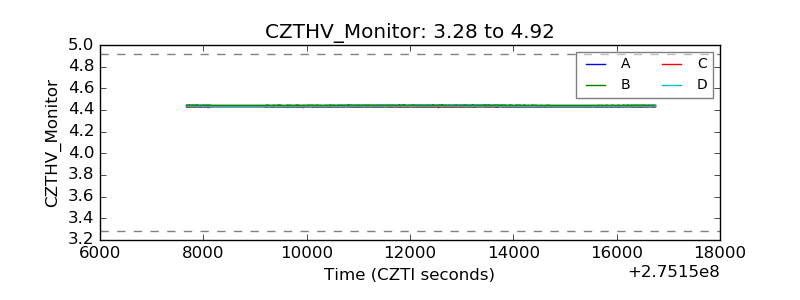 |
| D_VDD | 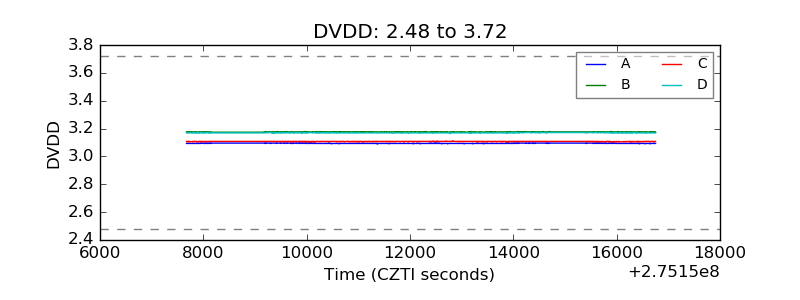 |
| Temperature 1 | 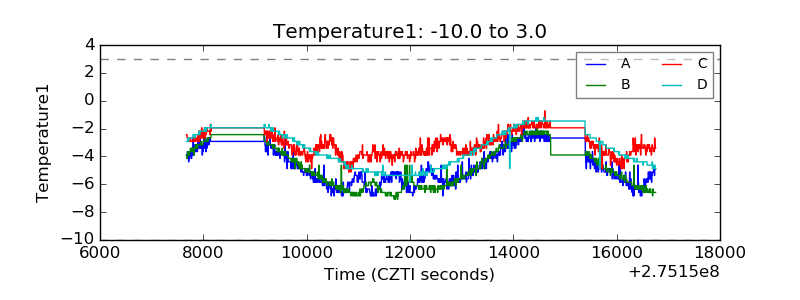 |
| Veto HV Monitor | 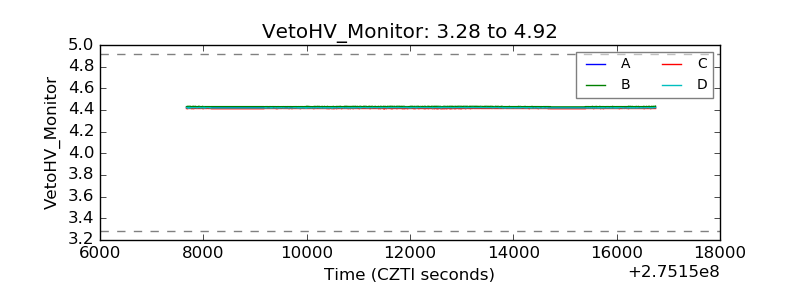 |
| Veto LLD | 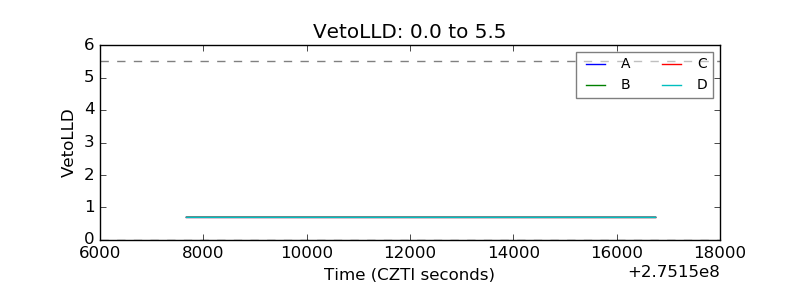 |
| Alpha Counter | 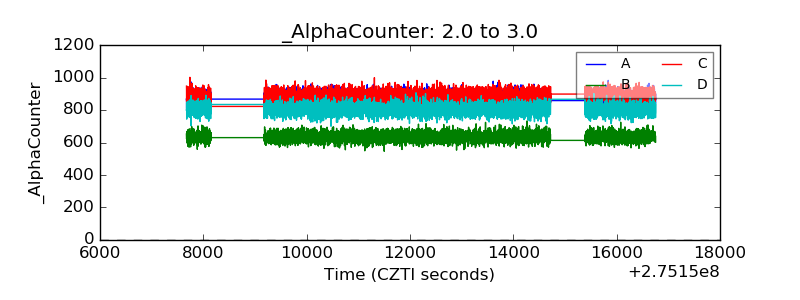 |
| _CPM_Rate | 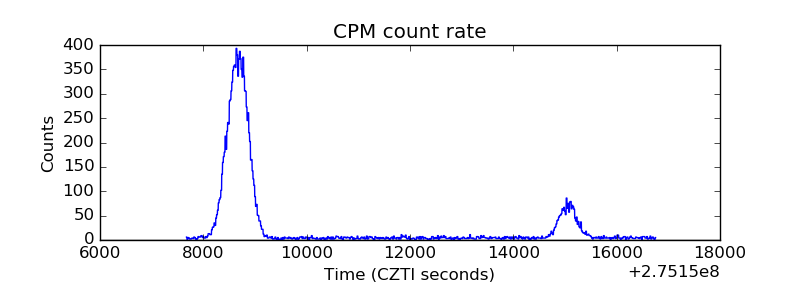 |
| CZT Counter | 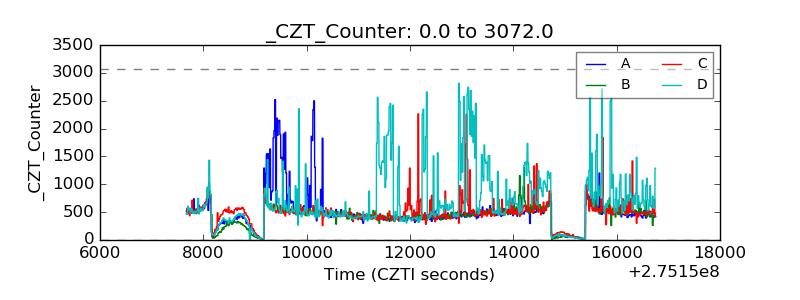 |
| +2.5 Volts monitor | 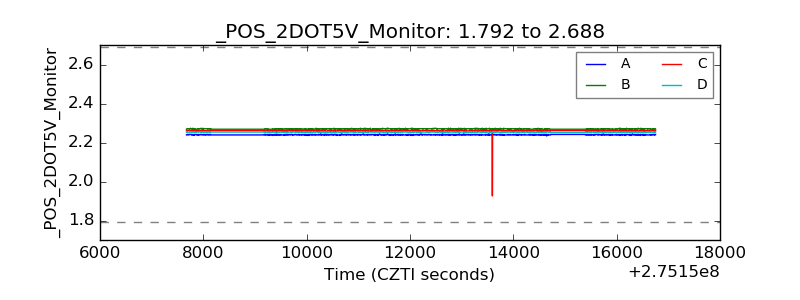 |
| +5 Volts monitor |  |
| _ROLL_ROT | 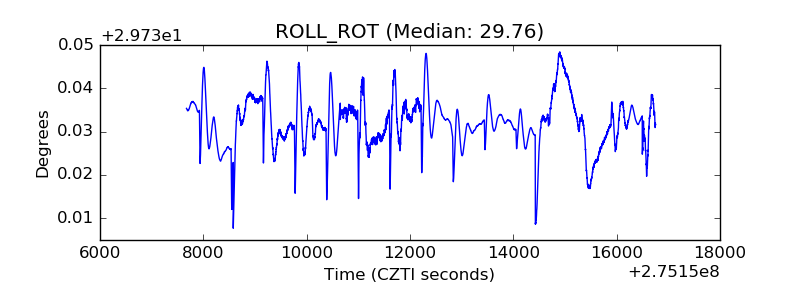 |
| _Roll_DEC | 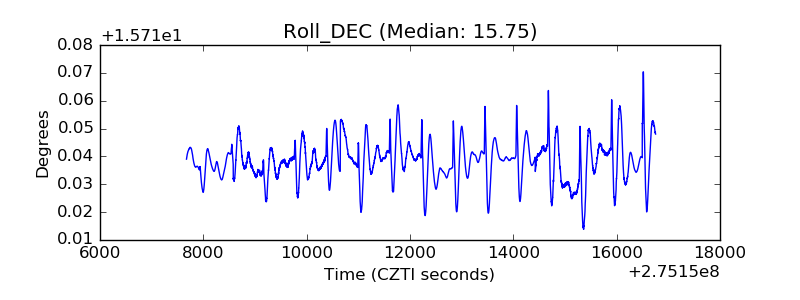 |
| _Roll_RA | 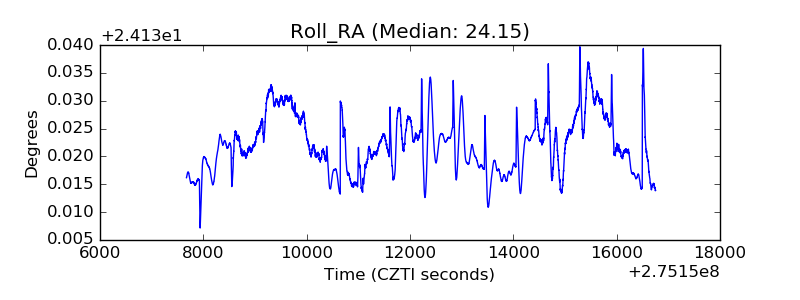 |
| Veto Counter | 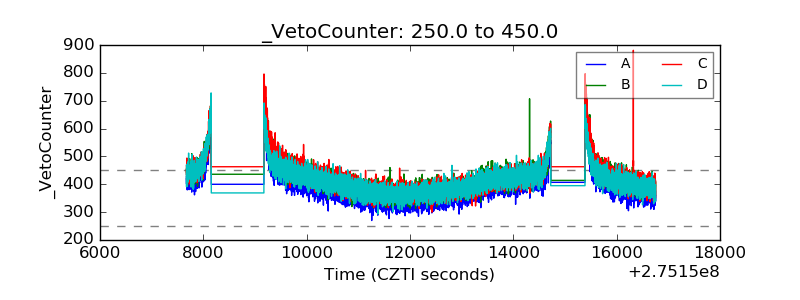 |