| Param | Original file | Final file |
|---|---|---|
| Filename | modeM0/AS1A04_209T01_9000002378_16114cztM0_level2.evt | modeM0/AS1A04_209T01_9000002378_16114cztM0_level2_quad_clean.evt |
| Size (bytes) | 173,787,840 | 39,332,160 |
| Size | 165.7 MB | 37.5 MB |
| Events in quadrant A | 1,069,479 | 263,249 |
| Events in quadrant B | 1,087,079 | 266,667 |
| Events in quadrant C | 1,138,385 | 252,921 |
| Events in quadrant D | 1,812,237 | 244,521 |
| Mode M0 | |||
|---|---|---|---|
| Quadrant | BADHDUFLAG | Total packets | Discarded packets |
| A | 0 | 4769 | 0 |
| B | 0 | 4770 | 0 |
| C | 0 | 4883 | 0 |
| D | 0 | 6918 | 0 |
| Mode SS | |||
|---|---|---|---|
| Quadrant | BADHDUFLAG | Total packets | Discarded packets |
| A | 0 | 46 | 0 |
| B | 0 | 46 | 0 |
| C | 0 | 46 | 0 |
| D | 0 | 46 | 0 |
| Quadrant | Total seconds | Saturated seconds | Saturation percentage |
|---|---|---|---|
| A | 2260 | 11 | 0.486726% |
| B | 2260 | 3 | 0.132743% |
| C | 2260 | 12 | 0.530973% |
| D | 2260 | 123 | 5.442478% |
Noise dominated data is calculated using 1-second bins in cleaned event files. If a bin has >2000 counts, and if more than 50% of those come from <1% of pixels, then it is considered to be noise-dominated and hence unusable.
| Quadrant | # 1 sec bins | Bins with >0 counts | Bins with >2000 counts | High rate bins dominated by noise | Noise dominated (total time) | Noise dominated (detector-on time) | Marked lightcurve |
|---|---|---|---|---|---|---|---|
| A | 2261 | 2261 | 3 | 3 | 0.13% | 0.13% |  |
| B | 2261 | 2261 | 0 | 0 | 0.00% | 0.00% |  |
| C | 2261 | 2261 | 3 | 3 | 0.13% | 0.13% |  |
| D | 2261 | 2261 | 116 | 116 | 5.13% | 5.13% |  |
Top three noisy pixels from each quadrant. If the there are fewer than three noisy pixels in the level2.evt file, extra rows are filled as -1
| Pixel properties | Quadrant properties | ||||||
|---|---|---|---|---|---|---|---|
| Quadrant | DetID | PixID | Counts | Sigma | Mean | Median | Sigma |
| A | 15 | 174 | 36389 | 649.1 | 266 | 260 | 55.7 |
| A | 9 | 143 | 10016 | 175.28 | 266 | 260 | 55.7 |
| A | 0 | 226 | 2303 | 36.7 | 266 | 260 | 55.7 |
| B | 0 | 189 | 20430 | 378.2 | 268 | 261 | 53.3 |
| B | 4 | 216 | 7481 | 135.39 | 268 | 261 | 53.3 |
| B | 12 | 111 | 6264 | 112.57 | 268 | 261 | 53.3 |
| C | 9 | 236 | 70860 | 1123.82 | 260 | 263 | 62.8 |
| C | 14 | 238 | 38774 | 613.05 | 260 | 263 | 62.8 |
| C | 3 | 233 | 10518 | 163.25 | 260 | 263 | 62.8 |
| D | 1 | 52 | 700087 | 10880.01 | 256 | 248 | 64.3 |
| D | 15 | 0 | 98798 | 1532.1 | 256 | 248 | 64.3 |
| D | 5 | 222 | 41156 | 635.97 | 256 | 248 | 64.3 |
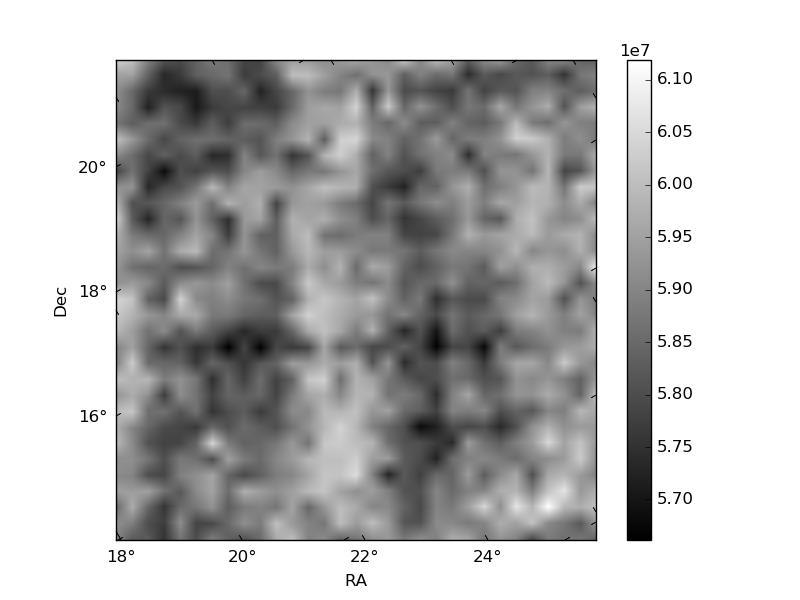
Histogram calculated using DETX and DETY for each event in the final _common_clean file
| Quadrant A |  |
 |
Quadrant B |
|---|---|---|---|
| Quadrant D | 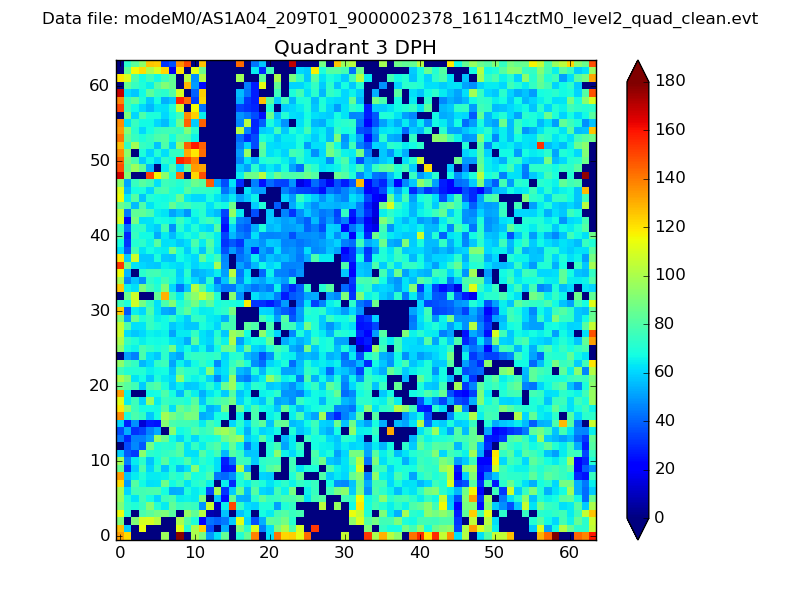 |
 |
Quadrant C |
| Plot type | Count rate plots | Images |
|---|---|---|
| Comparison with Poisson distribution Blue bars denote a histogram of data divided into 1 sec bins. Red curve is a Poisson curve with rate = median count rate of data. |
 |
 |
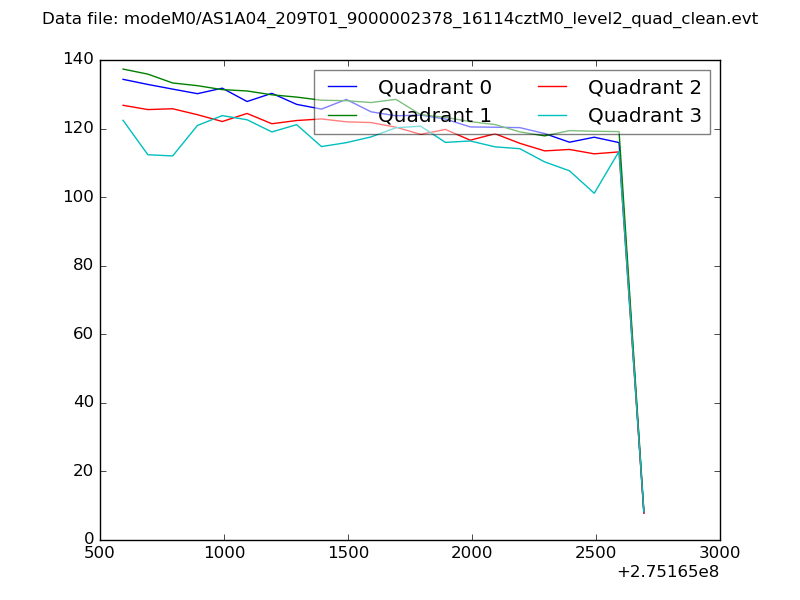
| Quadrant-wise count rates Data is divided into 100 sec bins |
 |
|
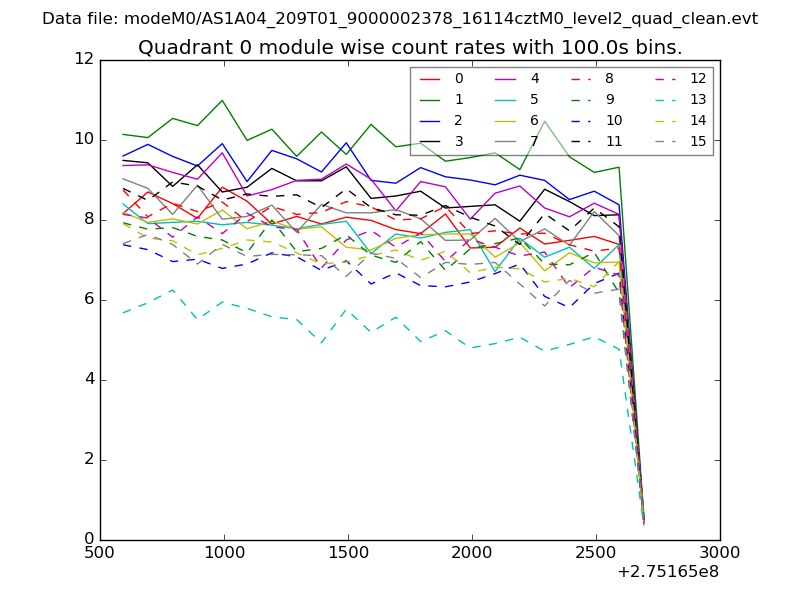
| Module-wise count rates for Quadrant A Data is divided into 100 sec bins |
 |
 |
| Module-wise count rates for Quadrant B Data is divided into 100 sec bins |
 |
 |
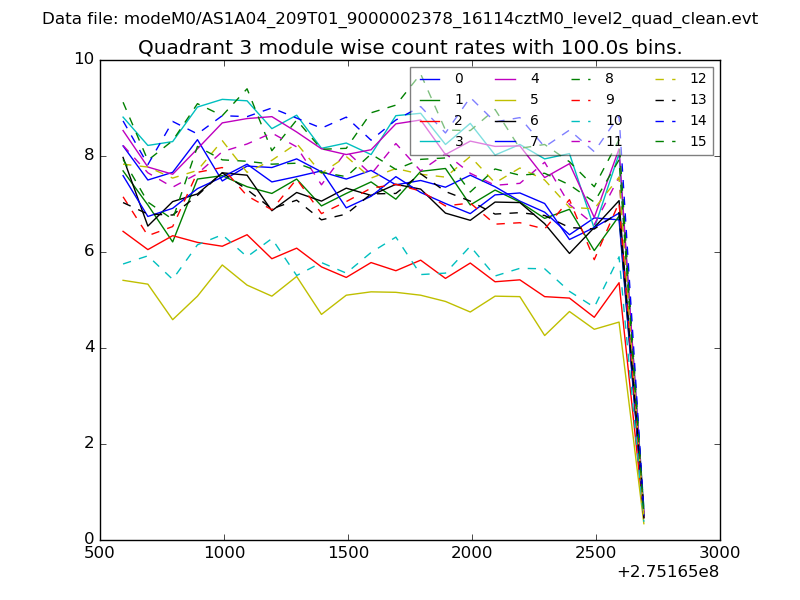
| Module-wise count rates for Quadrant C Data is divided into 100 sec bins |
 |
 |
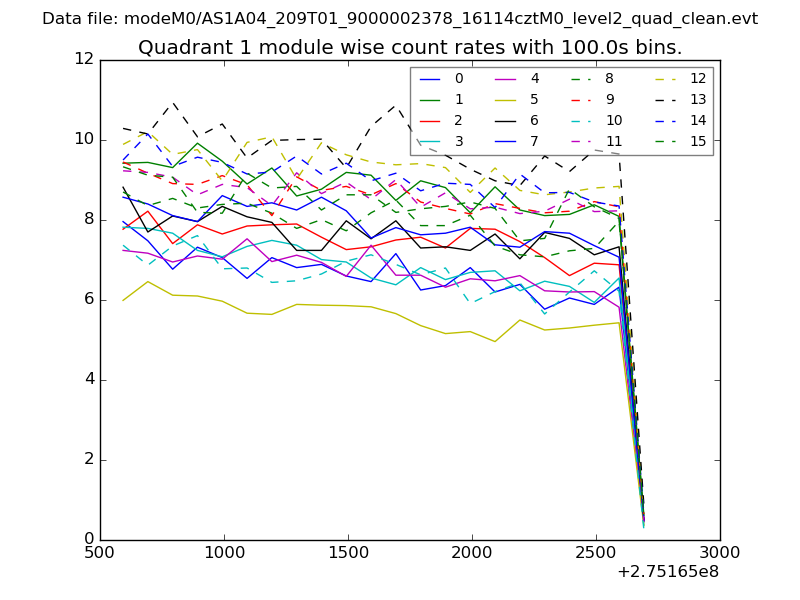
| Module-wise count rates for Quadrant D Data is divided into 100 sec bins |
 |
 |
| Parameter | Plot |
|---|---|
| CZT HV Monitor |  |
| D_VDD | 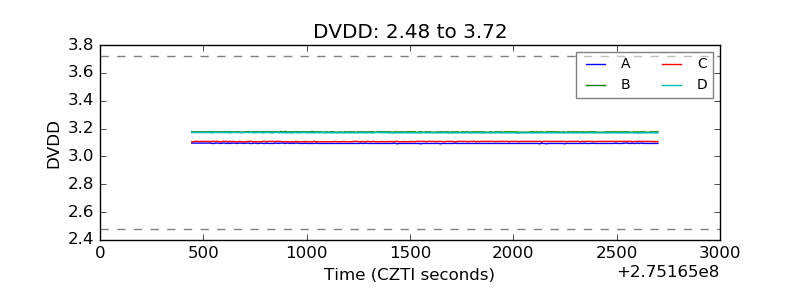 |
| Temperature 1 | 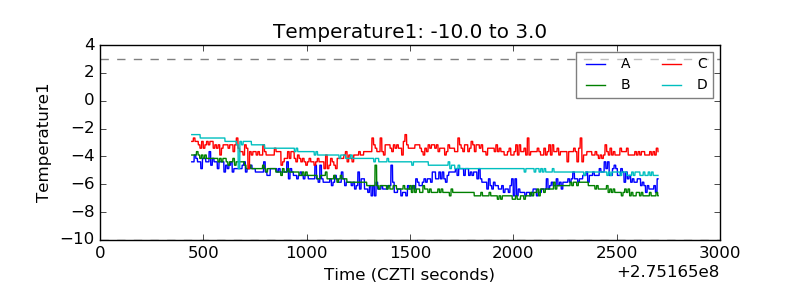 |
| Veto HV Monitor | 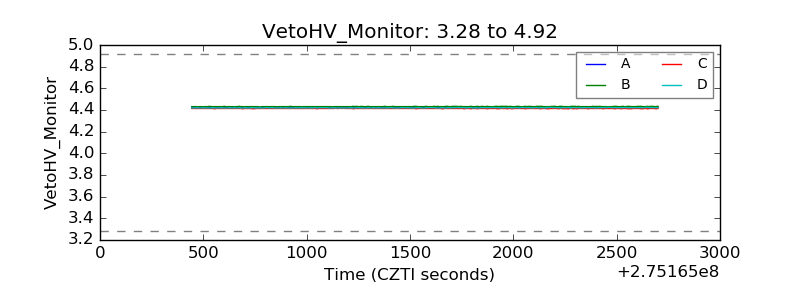 |
| Veto LLD | 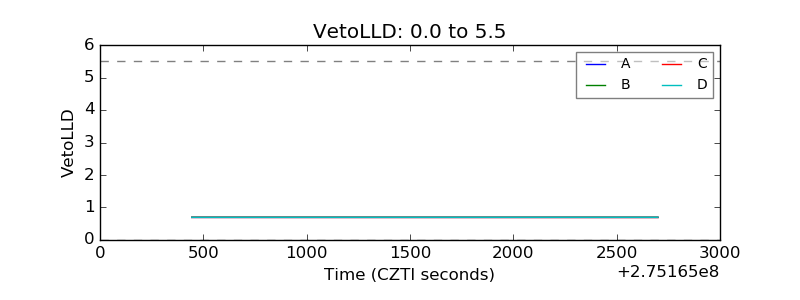 |
| Alpha Counter | 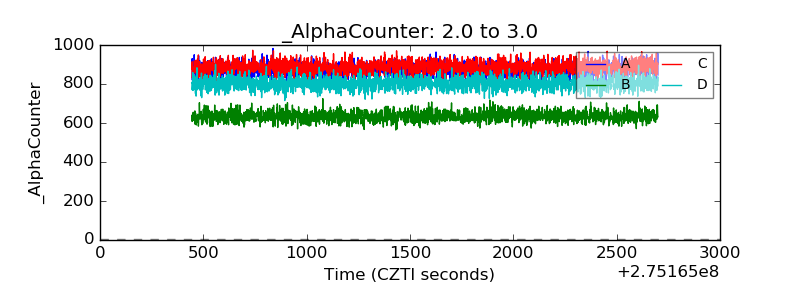 |
| _CPM_Rate | 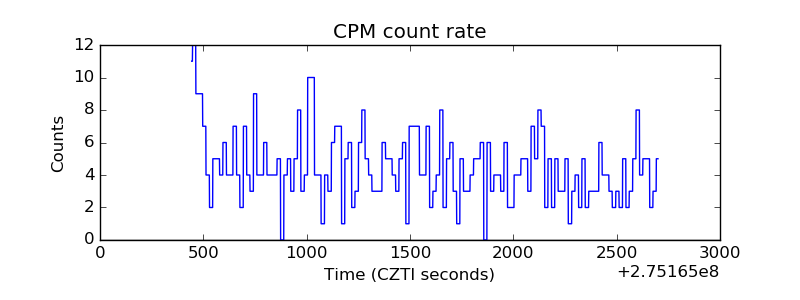 |
| CZT Counter | 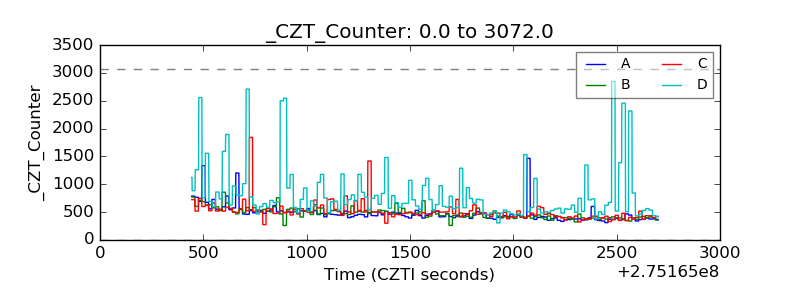 |
| +2.5 Volts monitor |  |
| +5 Volts monitor | 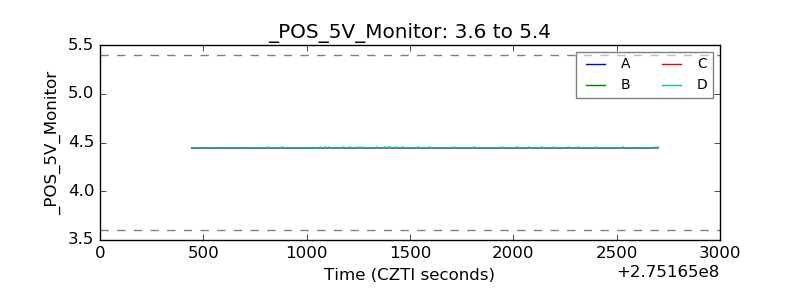 |
| _ROLL_ROT | 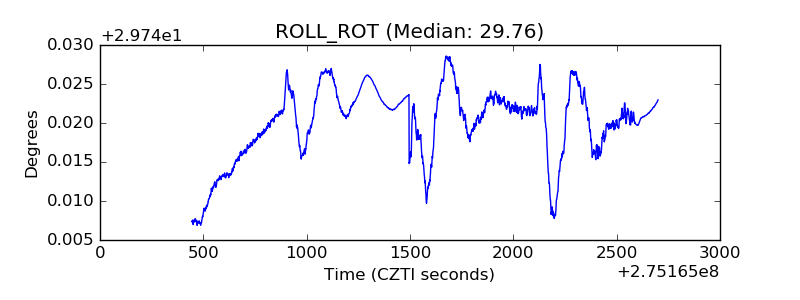 |
| _Roll_DEC | 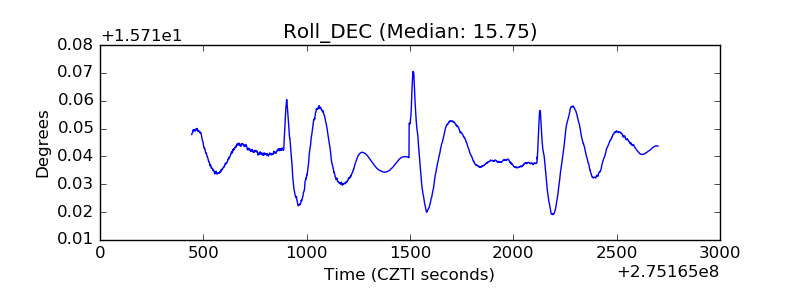 |
| _Roll_RA | 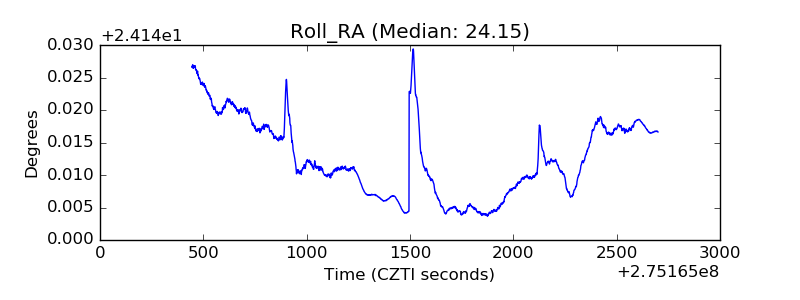 |
| Veto Counter | 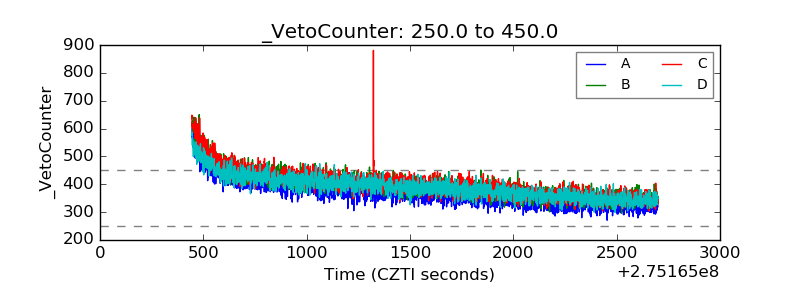 |