| Param | Original file | Final file |
|---|---|---|
| Filename | modeM0/AS1T02_094T01_9000002380cztM0_level2.fits | modeM0/AS1T02_094T01_9000002380cztM0_level2_quad_clean.evt |
| Size (bytes) | 705,614,400 | 652,884,480 |
| Size | 672.9 MB | 622.6 MB |
| Events in quadrant A | 4,364,254 | 3,947,851 |
| Events in quadrant B | 4,152,826 | 3,879,057 |
| Events in quadrant C | 4,203,018 | 3,663,765 |
| Events in quadrant D | 3,612,636 | 3,246,559 |
| Mode M0 | |||
|---|---|---|---|
| Quadrant | BADHDUFLAG | Total packets | Discarded packets |
| A | 0 | 165829 | 0 |
| B | 0 | 170767 | 0 |
| C | 0 | 155721 | 0 |
| D | 0 | 208559 | 0 |
| Mode SS | |||
|---|---|---|---|
| Quadrant | BADHDUFLAG | Total packets | Discarded packets |
| A | 0 | 1498 | 0 |
| B | 0 | 1498 | 0 |
| C | 0 | 1498 | 0 |
| D | 0 | 1498 | 0 |
| Mode M9 | |||
|---|---|---|---|
| Quadrant | BADHDUFLAG | Total packets | Discarded packets |
| A | 0 | 120 | 0 |
| B | 0 | 120 | 0 |
| C | 0 | 120 | 0 |
| D | 0 | 120 | 0 |
| Quadrant | Total seconds | Saturated seconds | Saturation percentage |
|---|---|---|---|
| A | 73422 | 1183 | 1.611234% |
| B | 73422 | 1274 | 1.735175% |
| C | 73422 | 1165 | 1.586718% |
| D | 73422 | 4574 | 6.229740% |
Noise dominated data is calculated using 1-second bins in cleaned event files. If a bin has >2000 counts, and if more than 50% of those come from <1% of pixels, then it is considered to be noise-dominated and hence unusable.
| Quadrant | # 1 sec bins | Bins with >0 counts | Bins with >2000 counts | High rate bins dominated by noise | Noise dominated (total time) | Noise dominated (detector-on time) | Marked lightcurve |
|---|---|---|---|---|---|---|---|
| A | 85561 | 73404 | 0 | 0 | 0.00% | 0.00% | 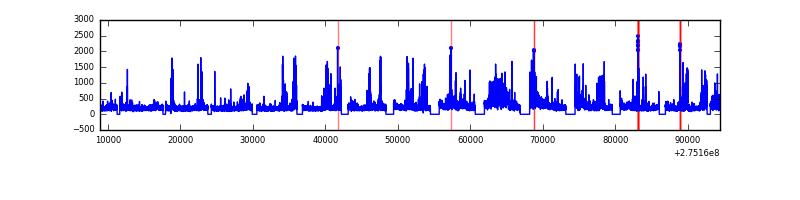 |
| B | 85561 | 73405 | 0 | 0 | 0.00% | 0.00% | 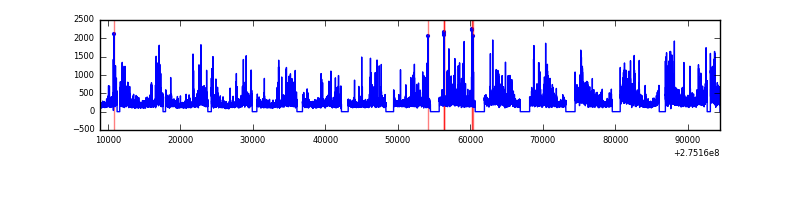 |
| C | 85561 | 73405 | 0 | 0 | 0.00% | 0.00% |  |
| D | 85561 | 73353 | 0 | 0 | 0.00% | 0.00% |  |
Top three noisy pixels from each quadrant. If the there are fewer than three noisy pixels in the level2.evt file, extra rows are filled as -1
| Pixel properties | Quadrant properties | ||||||
|---|---|---|---|---|---|---|---|
| Quadrant | DetID | PixID | Counts | Sigma | Mean | Median | Sigma |
| A | 0 | 29 | 4151 | 10.91 | 1138 | 1068 | 282.7 |
| A | 7 | 110 | 3451 | 8.43 | 1138 | 1068 | 282.7 |
| A | 9 | 19 | 3325 | 7.99 | 1138 | 1068 | 282.7 |
| B | 2 | 9 | 3334 | 10.59 | 1099 | 1050 | 215.6 |
| B | 2 | 8 | 2790 | 8.07 | 1099 | 1050 | 215.6 |
| B | 3 | 17 | 2770 | 7.98 | 1099 | 1050 | 215.6 |
| C | 1 | 80 | 3233 | 7.75 | 1110 | 1035 | 283.5 |
| C | 1 | 81 | 3143 | 7.44 | 1110 | 1035 | 283.5 |
| C | 12 | 241 | 3011 | 6.97 | 1110 | 1035 | 283.5 |
| D | 3 | 14 | 2639 | 6.15 | 1033 | 938 | 276.4 |
| D | 10 | 189 | 2589 | 5.97 | 1033 | 938 | 276.4 |
| D | 6 | 231 | 2555 | 5.85 | 1033 | 938 | 276.4 |
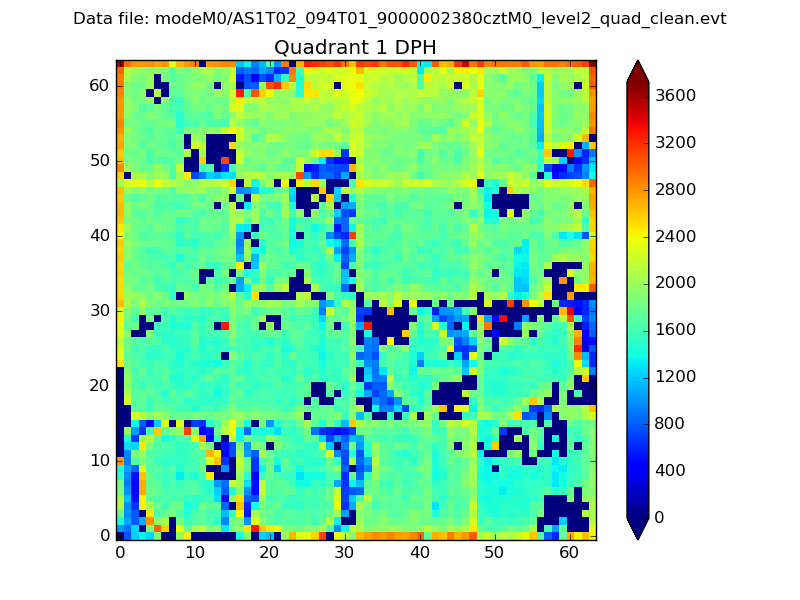
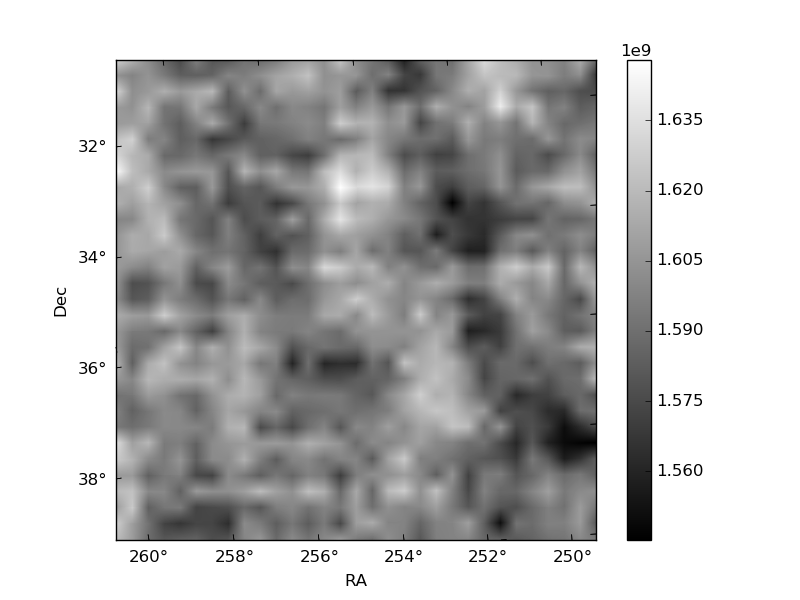
Histogram calculated using DETX and DETY for each event in the final _common_clean file
| Quadrant A |  |
 |
Quadrant B |
|---|---|---|---|
| Quadrant D | 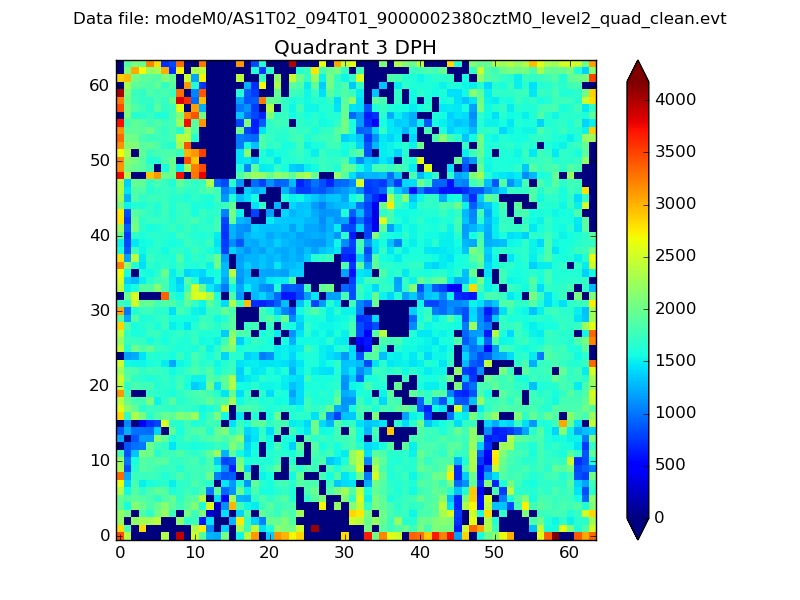 |
 |
Quadrant C |
| Plot type | Count rate plots | Images |
|---|---|---|
| Comparison with Poisson distribution Blue bars denote a histogram of data divided into 1 sec bins. Red curve is a Poisson curve with rate = median count rate of data. |
 |
 |
| Quadrant-wise count rates Data is divided into 100 sec bins |
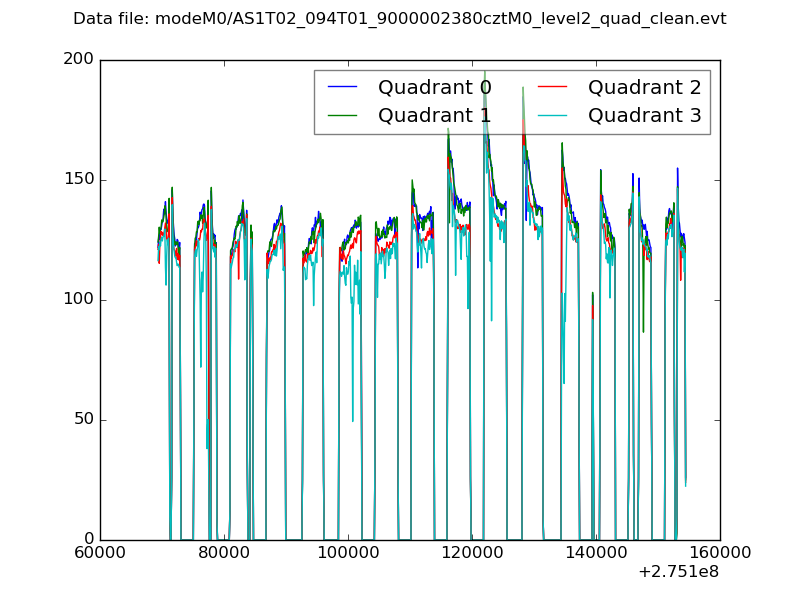 |
|
| Module-wise count rates for Quadrant A Data is divided into 100 sec bins |
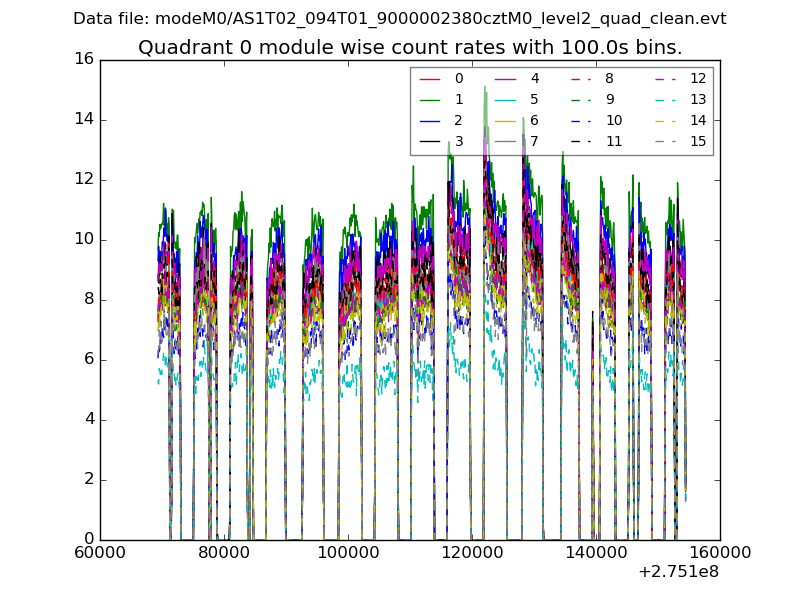 |
 |
| Module-wise count rates for Quadrant B Data is divided into 100 sec bins |
 |
 |
| Module-wise count rates for Quadrant C Data is divided into 100 sec bins |
 |
 |
| Module-wise count rates for Quadrant D Data is divided into 100 sec bins |
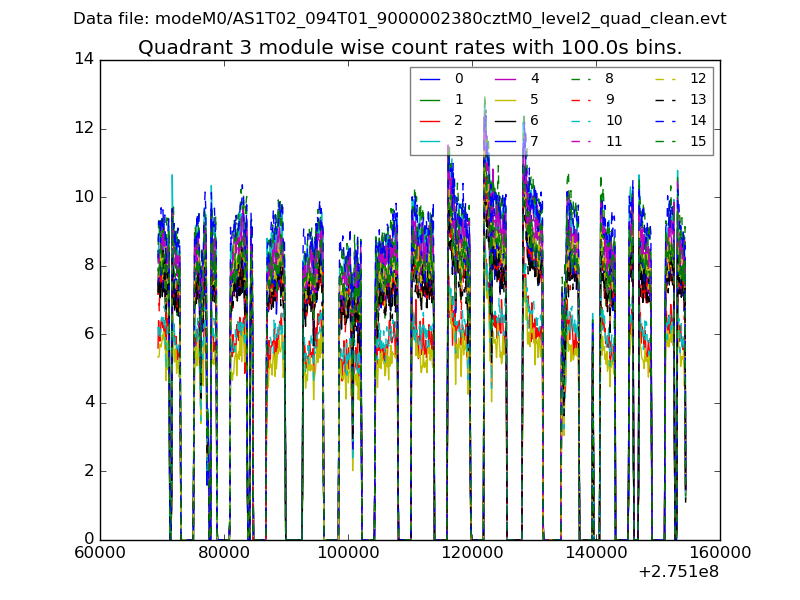 |
 |
| Parameter | Plot |
|---|---|
| CZT HV Monitor |  |
| D_VDD | 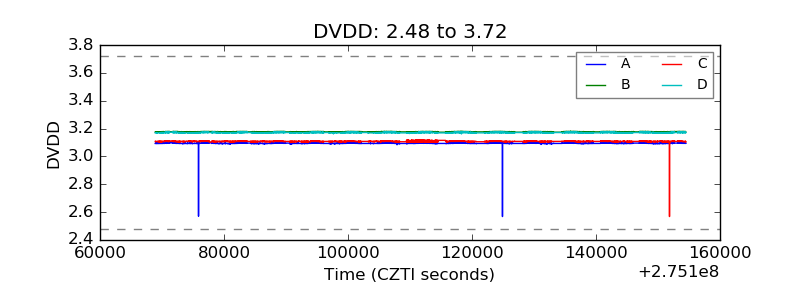 |
| Temperature 1 |  |
| Veto HV Monitor |  |
| Veto LLD |  |
| Alpha Counter | 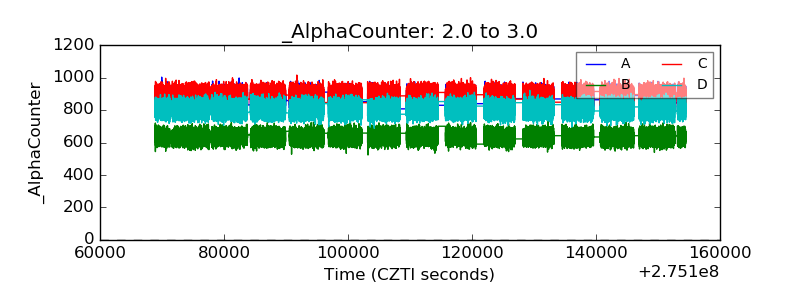 |
| _CPM_Rate | 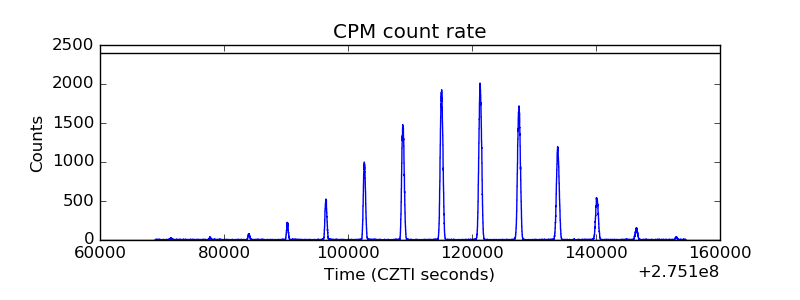 |
| CZT Counter |  |
| +2.5 Volts monitor |  |
| +5 Volts monitor | 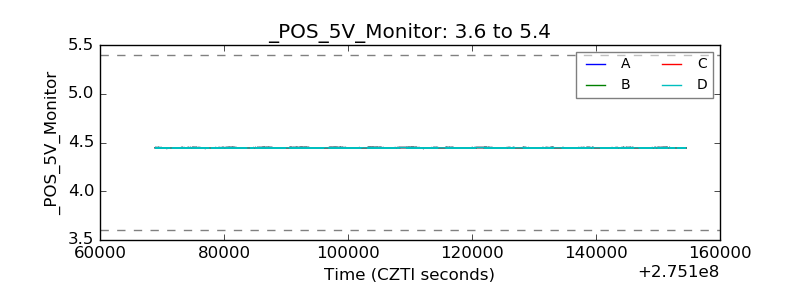 |
| _ROLL_ROT | 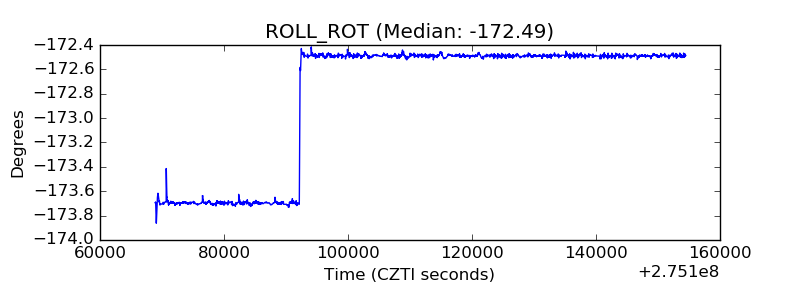 |
| _Roll_DEC |  |
| _Roll_RA |  |
| Veto Counter |  |