| Param | Original file | Final file |
|---|---|---|
| Filename | modeM0/AS1T02_094T01_9000002380_16114cztM0_level2.evt | modeM0/AS1T02_094T01_9000002380_16114cztM0_level2_quad_clean.evt |
| Size (bytes) | 310,415,040 | 64,033,920 |
| Size | 296.0 MB | 61.1 MB |
| Events in quadrant A | 1,879,312 | 429,405 |
| Events in quadrant B | 2,188,098 | 428,134 |
| Events in quadrant C | 1,931,968 | 410,774 |
| Events in quadrant D | 3,140,503 | 400,094 |
| Mode M0 | |||
|---|---|---|---|
| Quadrant | BADHDUFLAG | Total packets | Discarded packets |
| A | 0 | 7982 | 2 |
| B | 0 | 8900 | 1 |
| C | 0 | 8109 | 1 |
| D | 0 | 11887 | 1 |
| Mode SS | |||
|---|---|---|---|
| Quadrant | BADHDUFLAG | Total packets | Discarded packets |
| A | 0 | 78 | 0 |
| B | 0 | 78 | 0 |
| C | 0 | 78 | 0 |
| D | 0 | 78 | 0 |
| Mode M9 | |||
|---|---|---|---|
| Quadrant | BADHDUFLAG | Total packets | Discarded packets |
| A | 0 | 4 | 0 |
| B | 0 | 4 | 0 |
| C | 0 | 4 | 0 |
| D | 0 | 4 | 0 |
| Quadrant | Total seconds | Saturated seconds | Saturation percentage |
|---|---|---|---|
| A | 3831 | 18 | 0.469851% |
| B | 3831 | 60 | 1.566171% |
| C | 3831 | 55 | 1.435656% |
| D | 3831 | 218 | 5.690420% |
Noise dominated data is calculated using 1-second bins in cleaned event files. If a bin has >2000 counts, and if more than 50% of those come from <1% of pixels, then it is considered to be noise-dominated and hence unusable.
| Quadrant | # 1 sec bins | Bins with >0 counts | Bins with >2000 counts | High rate bins dominated by noise | Noise dominated (total time) | Noise dominated (detector-on time) | Marked lightcurve |
|---|---|---|---|---|---|---|---|
| A | 4207 | 3833 | 1 | 1 | 0.02% | 0.03% | 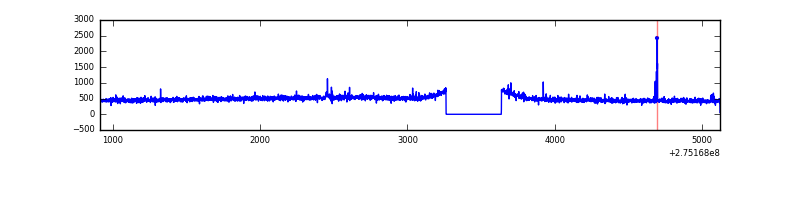 |
| B | 4207 | 3833 | 7 | 7 | 0.17% | 0.18% | 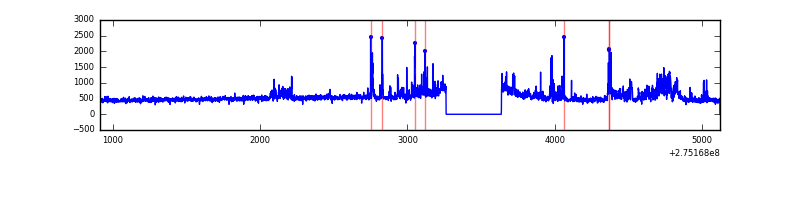 |
| C | 4207 | 3833 | 2 | 2 | 0.05% | 0.05% | 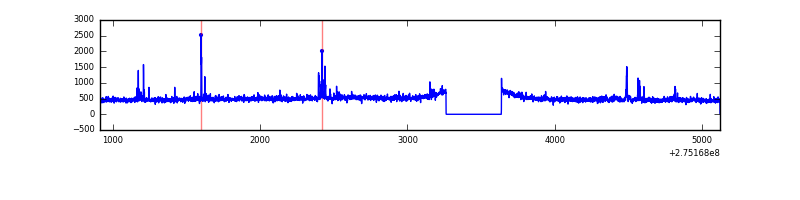 |
| D | 4207 | 3833 | 177 | 177 | 4.21% | 4.62% | 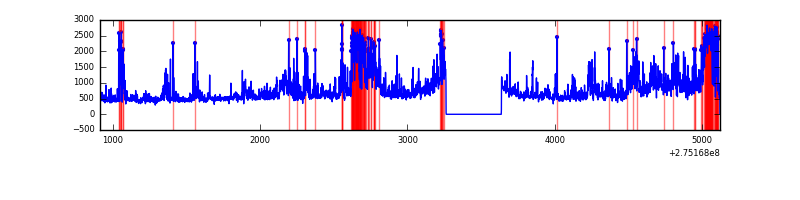 |
Top three noisy pixels from each quadrant. If the there are fewer than three noisy pixels in the level2.evt file, extra rows are filled as -1
| Pixel properties | Quadrant properties | ||||||
|---|---|---|---|---|---|---|---|
| Quadrant | DetID | PixID | Counts | Sigma | Mean | Median | Sigma |
| A | 15 | 174 | 17806 | 173.94 | 481 | 470 | 99.7 |
| A | 0 | 226 | 4368 | 39.11 | 481 | 470 | 99.7 |
| A | 3 | 1 | 4251 | 37.94 | 481 | 470 | 99.7 |
| B | 0 | 189 | 144139 | 1537.33 | 477 | 465 | 93.5 |
| B | 7 | 220 | 74153 | 788.47 | 477 | 465 | 93.5 |
| B | 0 | 197 | 24371 | 255.8 | 477 | 465 | 93.5 |
| C | 14 | 238 | 72475 | 663.88 | 457 | 459 | 108.5 |
| C | 9 | 236 | 50043 | 457.09 | 457 | 459 | 108.5 |
| C | 0 | 207 | 16103 | 144.21 | 457 | 459 | 108.5 |
| D | 1 | 52 | 1104005 | 9698.22 | 461 | 446 | 113.8 |
| D | 5 | 222 | 155277 | 1360.67 | 461 | 446 | 113.8 |
| D | 7 | 38 | 87737 | 767.12 | 461 | 446 | 113.8 |
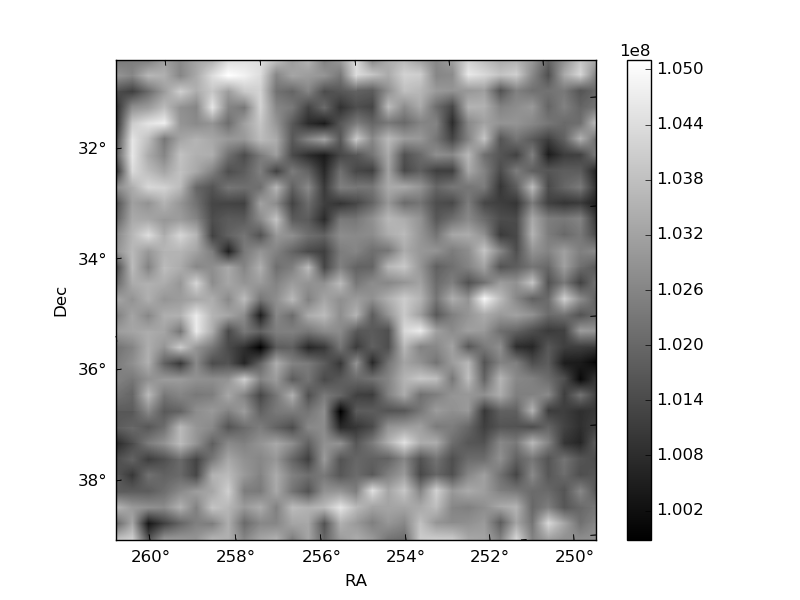
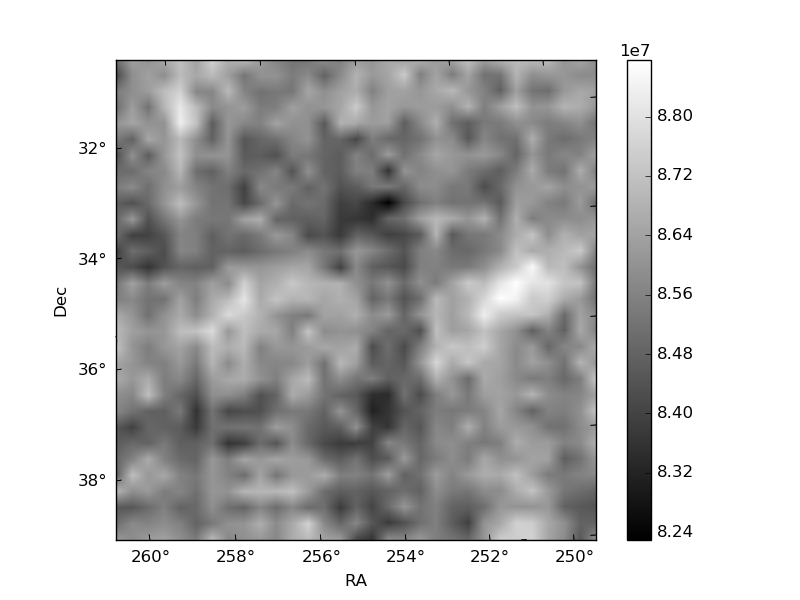
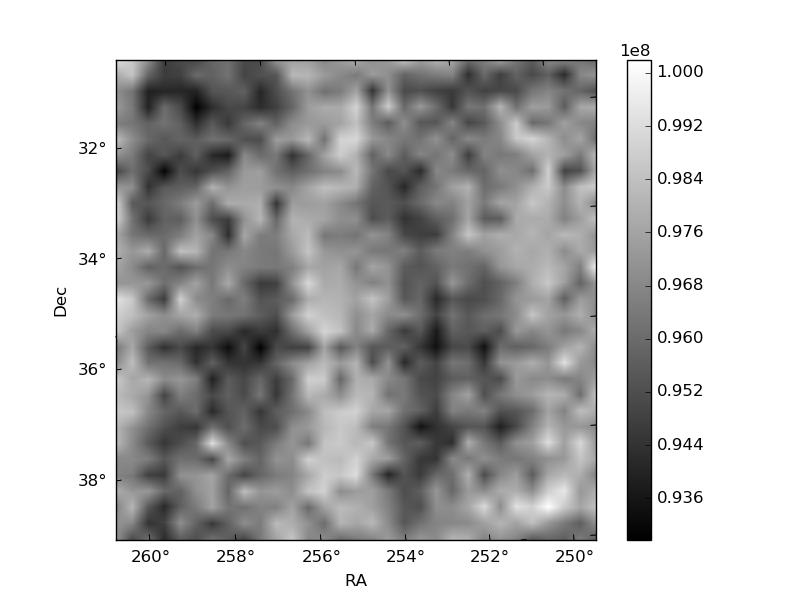
Histogram calculated using DETX and DETY for each event in the final _common_clean file
| Quadrant A |  |
 |
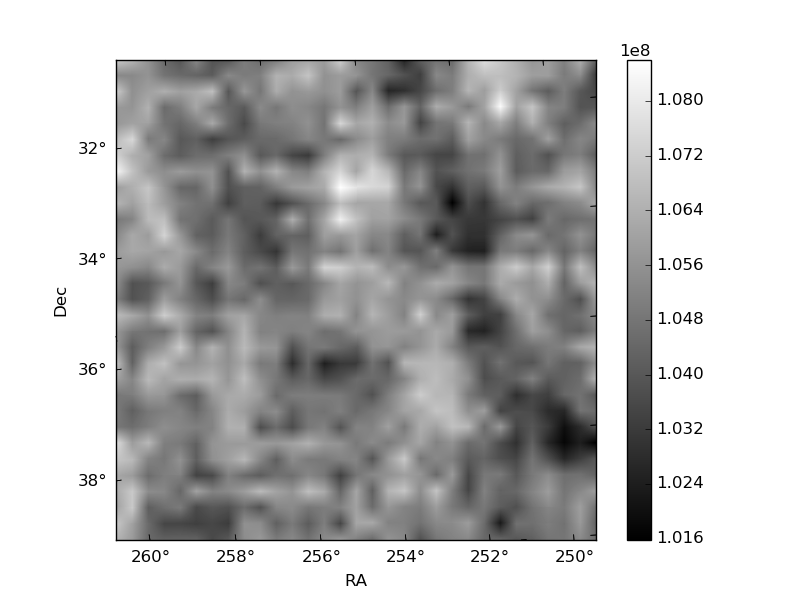
Quadrant B |
|---|---|---|---|
| Quadrant D |  |
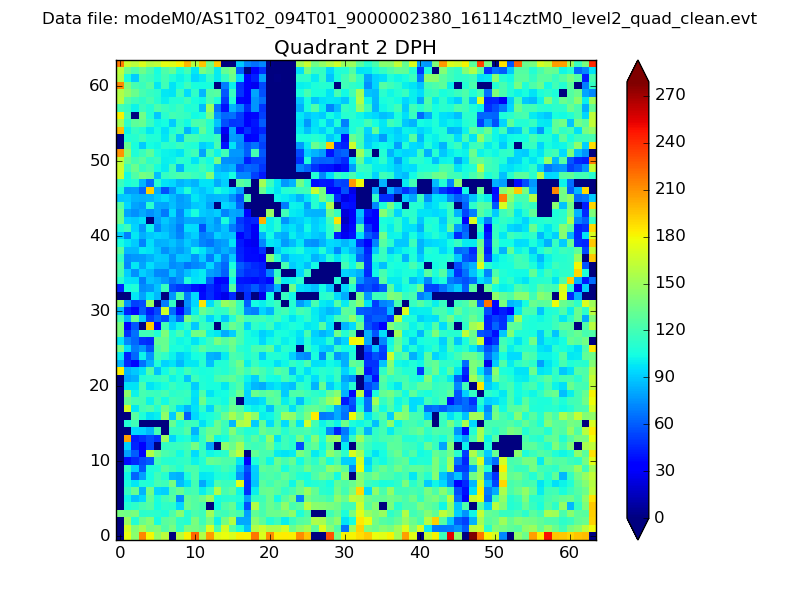 |
Quadrant C |
| Plot type | Count rate plots | Images |
|---|---|---|
| Comparison with Poisson distribution Blue bars denote a histogram of data divided into 1 sec bins. Red curve is a Poisson curve with rate = median count rate of data. |
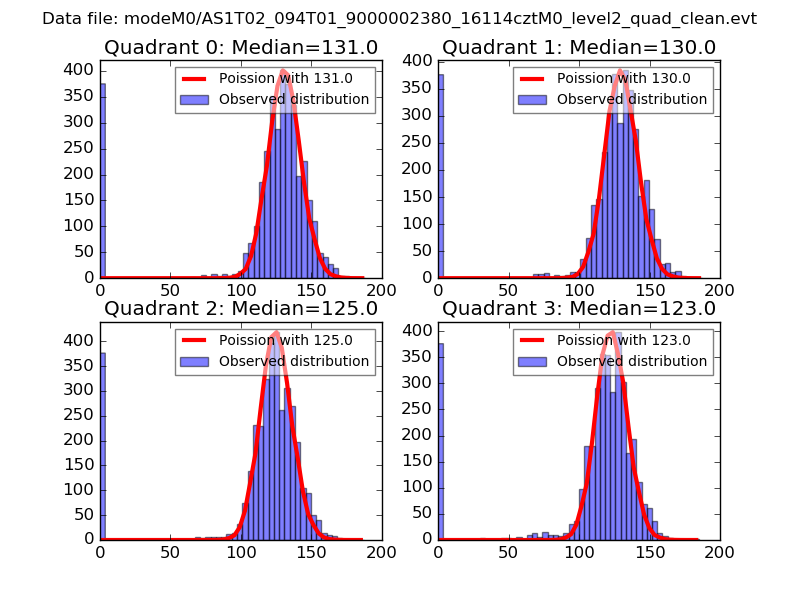 |
 |
| Quadrant-wise count rates Data is divided into 100 sec bins |
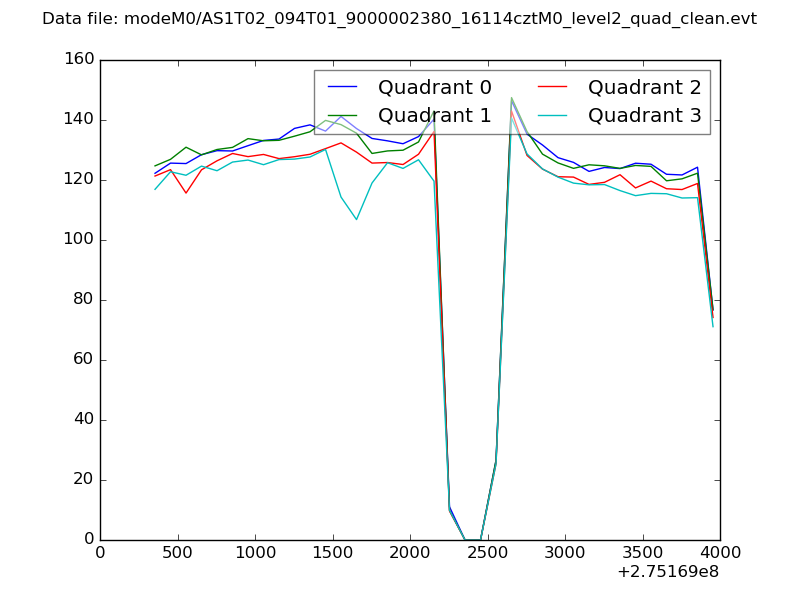 |
|
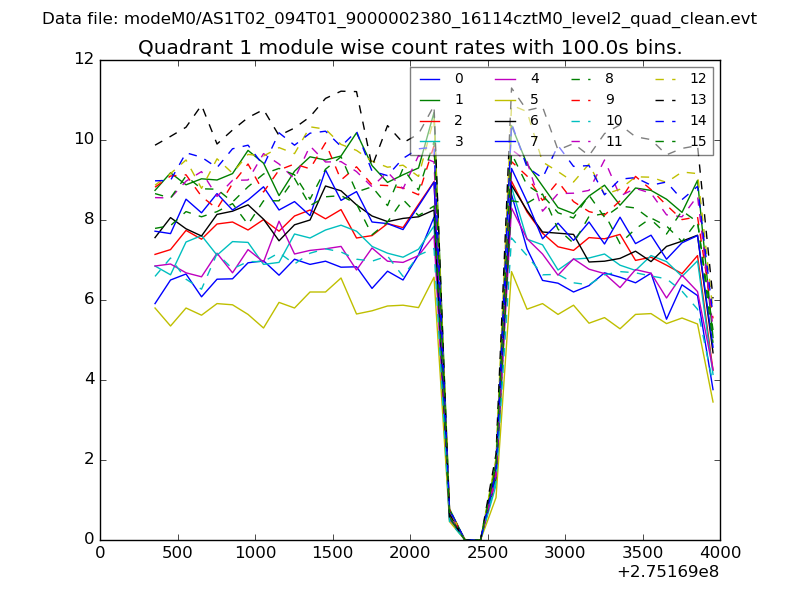
| Module-wise count rates for Quadrant A Data is divided into 100 sec bins |
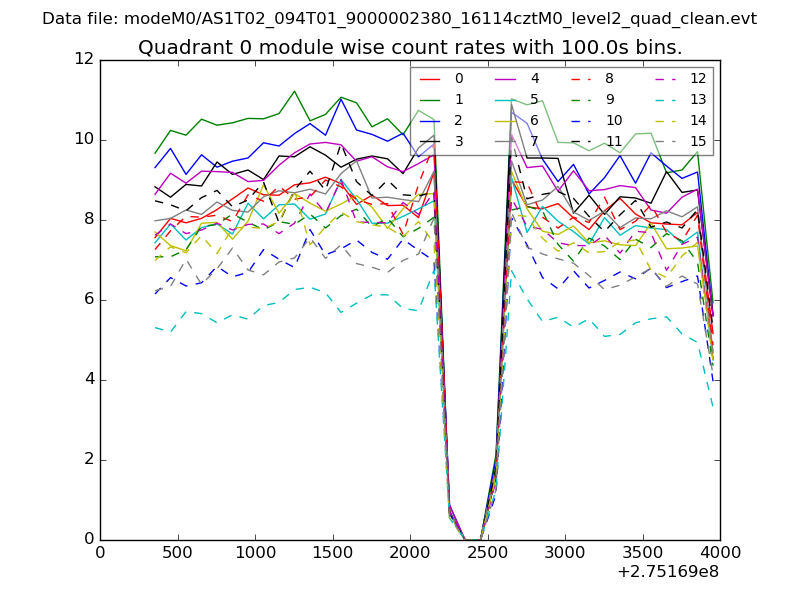 |
 |
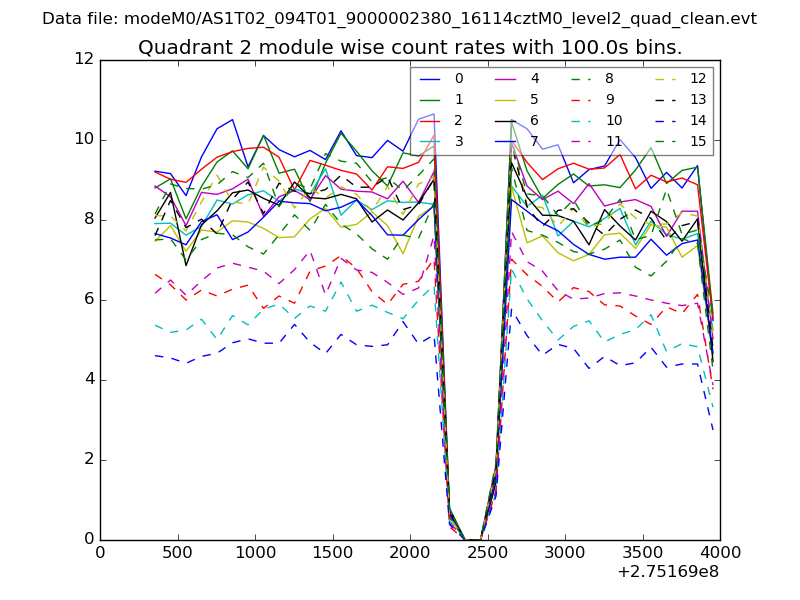
| Module-wise count rates for Quadrant B Data is divided into 100 sec bins |
 |
 |
| Module-wise count rates for Quadrant C Data is divided into 100 sec bins |
 |
 |
| Module-wise count rates for Quadrant D Data is divided into 100 sec bins |
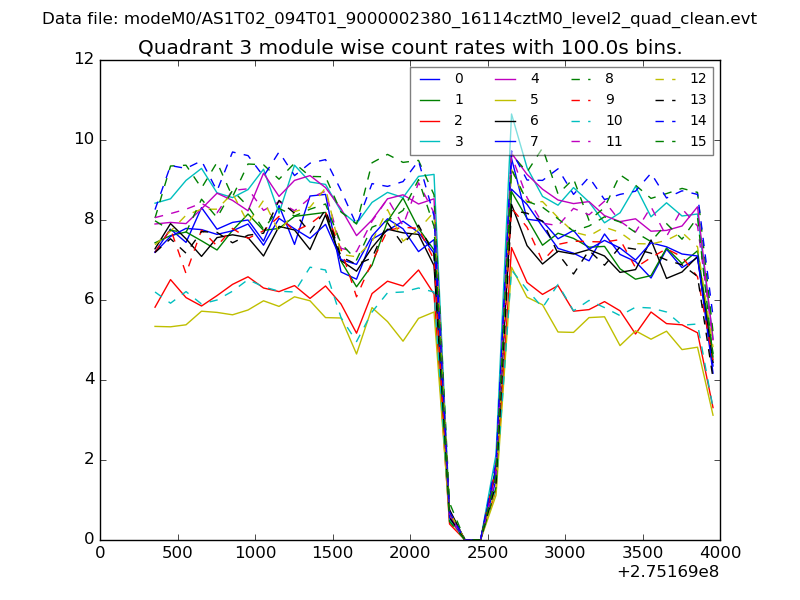 |
 |
| Parameter | Plot |
|---|---|
| CZT HV Monitor |  |
| D_VDD | 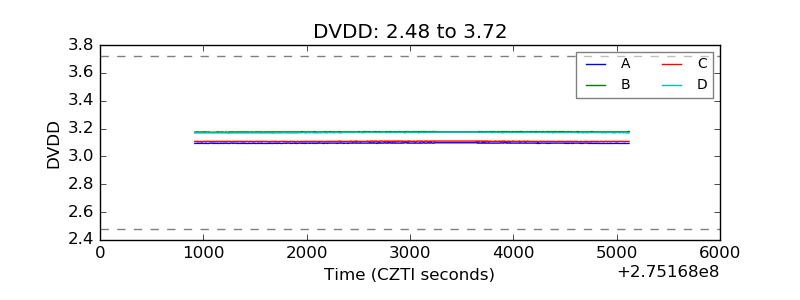 |
| Temperature 1 | 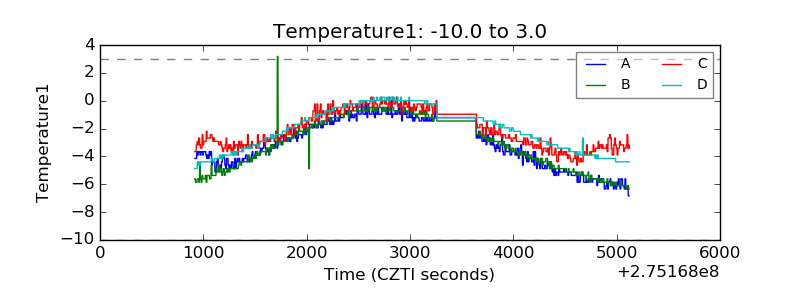 |
| Veto HV Monitor | 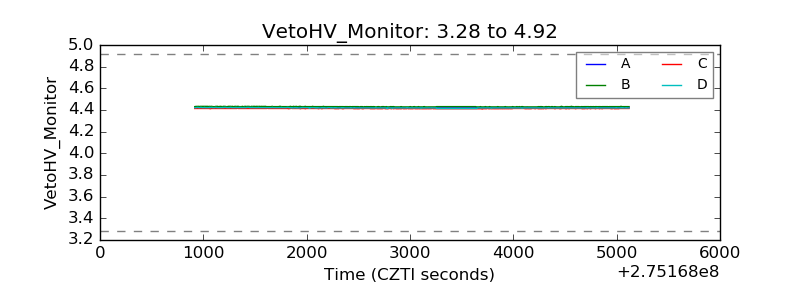 |
| Veto LLD | 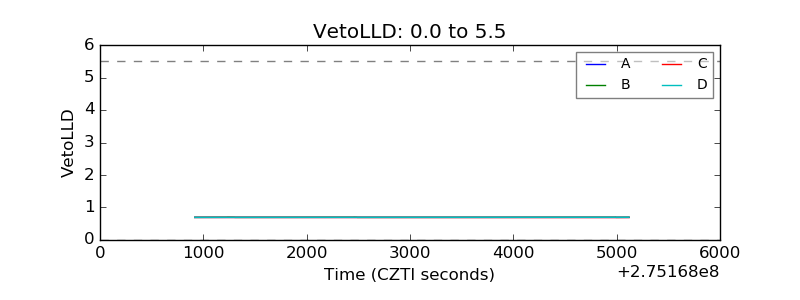 |
| Alpha Counter | 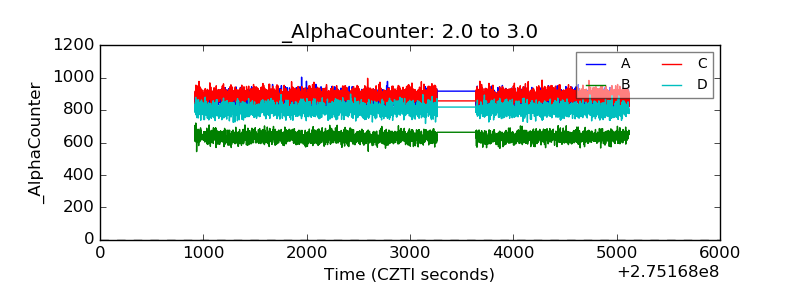 |
| _CPM_Rate | 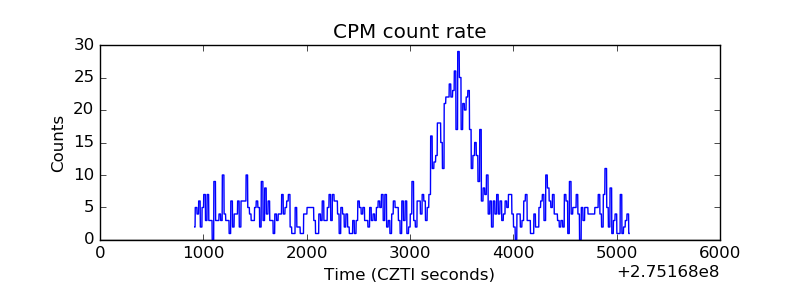 |
| CZT Counter |  |
| +2.5 Volts monitor |  |
| +5 Volts monitor | 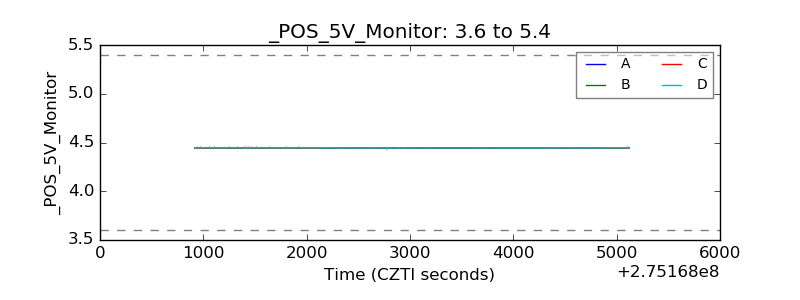 |
| _ROLL_ROT | 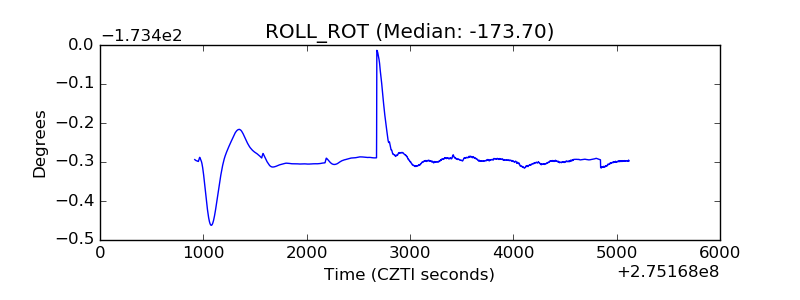 |
| _Roll_DEC | 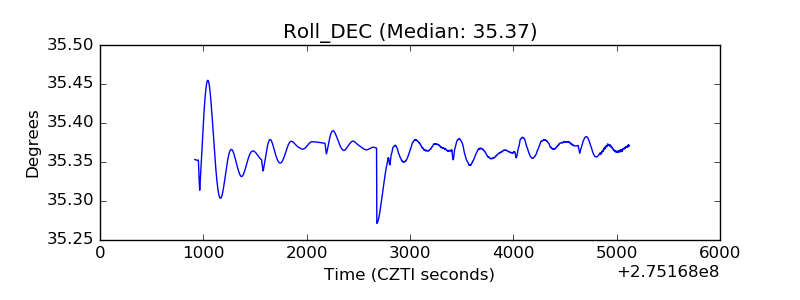 |
| _Roll_RA |  |
| Veto Counter | 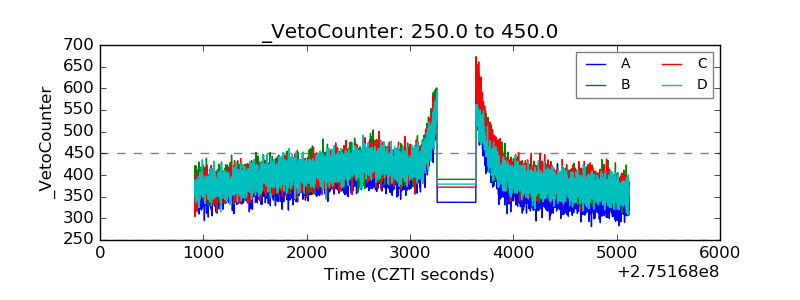 |