| Param | Original file | Final file |
|---|---|---|
| Filename | modeM0/AS1T02_094T01_9000002380_16115cztM0_level2.evt | modeM0/AS1T02_094T01_9000002380_16115cztM0_level2_quad_clean.evt |
| Size (bytes) | 615,427,200 | 97,744,320 |
| Size | 586.9 MB | 93.2 MB |
| Events in quadrant A | 3,720,798 | 632,941 |
| Events in quadrant B | 4,173,061 | 631,083 |
| Events in quadrant C | 3,749,469 | 609,524 |
| Events in quadrant D | 6,472,820 | 550,394 |
| Mode M0 | |||
|---|---|---|---|
| Quadrant | BADHDUFLAG | Total packets | Discarded packets |
| A | 0 | 16319 | 3 |
| B | 0 | 17480 | 2 |
| C | 0 | 16122 | 2 |
| D | 0 | 24541 | 2 |
| Mode SS | |||
|---|---|---|---|
| Quadrant | BADHDUFLAG | Total packets | Discarded packets |
| A | 0 | 158 | 0 |
| B | 0 | 158 | 0 |
| C | 0 | 158 | 0 |
| D | 0 | 158 | 0 |
| Mode M9 | |||
|---|---|---|---|
| Quadrant | BADHDUFLAG | Total packets | Discarded packets |
| A | 0 | 7 | 0 |
| B | 0 | 7 | 0 |
| C | 0 | 7 | 0 |
| D | 0 | 7 | 0 |
| Quadrant | Total seconds | Saturated seconds | Saturation percentage |
|---|---|---|---|
| A | 7702 | 77 | 0.999740% |
| B | 7702 | 135 | 1.752791% |
| C | 7702 | 107 | 1.389250% |
| D | 7702 | 846 | 10.984160% |
Noise dominated data is calculated using 1-second bins in cleaned event files. If a bin has >2000 counts, and if more than 50% of those come from <1% of pixels, then it is considered to be noise-dominated and hence unusable.
| Quadrant | # 1 sec bins | Bins with >0 counts | Bins with >2000 counts | High rate bins dominated by noise | Noise dominated (total time) | Noise dominated (detector-on time) | Marked lightcurve |
|---|---|---|---|---|---|---|---|
| A | 8438 | 7704 | 20 | 20 | 0.24% | 0.26% | 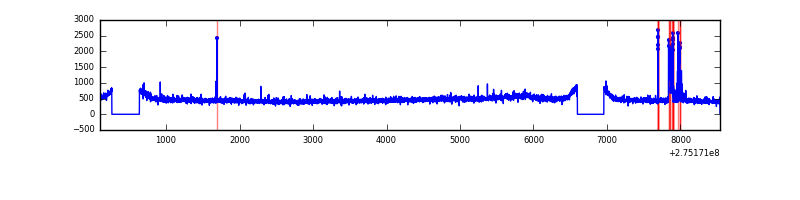 |
| B | 8438 | 7704 | 14 | 14 | 0.17% | 0.18% | 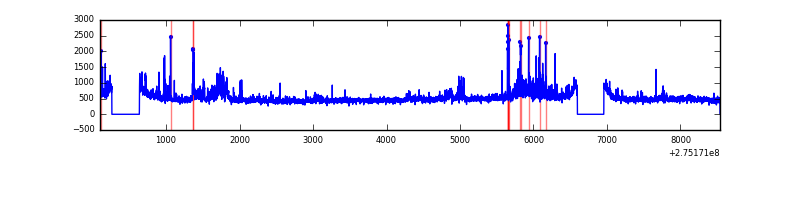 |
| C | 8438 | 7704 | 4 | 4 | 0.05% | 0.05% | 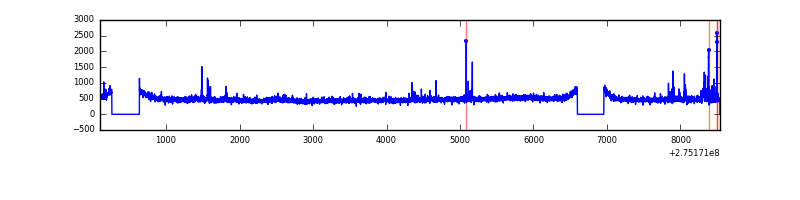 |
| D | 8438 | 7704 | 765 | 765 | 9.07% | 9.93% | 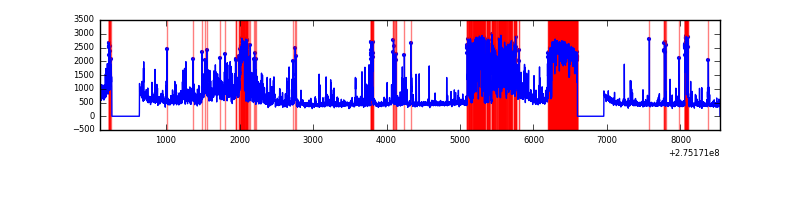 |
Top three noisy pixels from each quadrant. If the there are fewer than three noisy pixels in the level2.evt file, extra rows are filled as -1
| Pixel properties | Quadrant properties | ||||||
|---|---|---|---|---|---|---|---|
| Quadrant | DetID | PixID | Counts | Sigma | Mean | Median | Sigma |
| A | 15 | 174 | 136352 | 721.58 | 924 | 906 | 187.7 |
| A | 8 | 247 | 25642 | 131.78 | 924 | 906 | 187.7 |
| A | 0 | 226 | 8164 | 38.67 | 924 | 906 | 187.7 |
| B | 0 | 189 | 276993 | 1566.34 | 923 | 900 | 176.3 |
| B | 7 | 220 | 141538 | 797.87 | 923 | 900 | 176.3 |
| B | 0 | 229 | 44074 | 244.94 | 923 | 900 | 176.3 |
| C | 14 | 238 | 136748 | 647.54 | 890 | 894 | 209.8 |
| C | 9 | 236 | 98156 | 463.59 | 890 | 894 | 209.8 |
| C | 3 | 233 | 30151 | 139.45 | 890 | 894 | 209.8 |
| D | 1 | 52 | 1675199 | 8007.28 | 853 | 828 | 209.1 |
| D | 7 | 38 | 1002546 | 4790.48 | 853 | 828 | 209.1 |
| D | 5 | 222 | 375835 | 1793.38 | 853 | 828 | 209.1 |
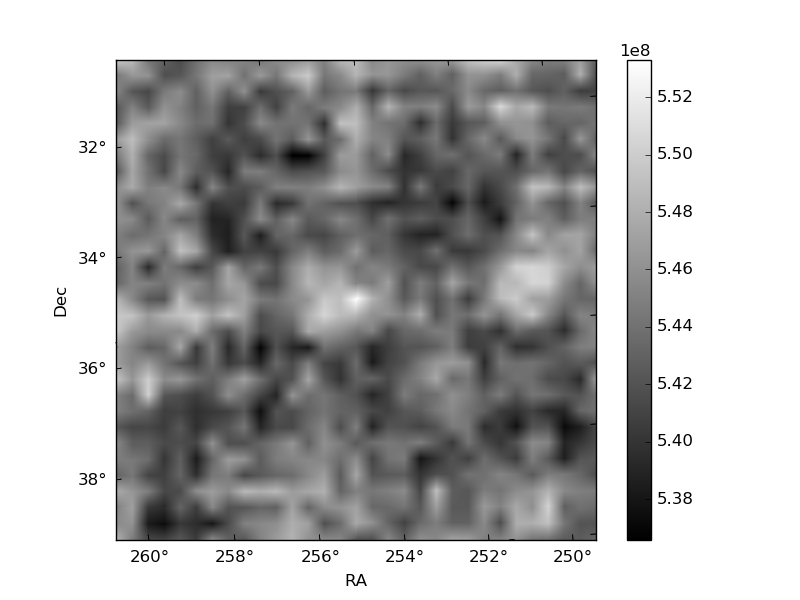
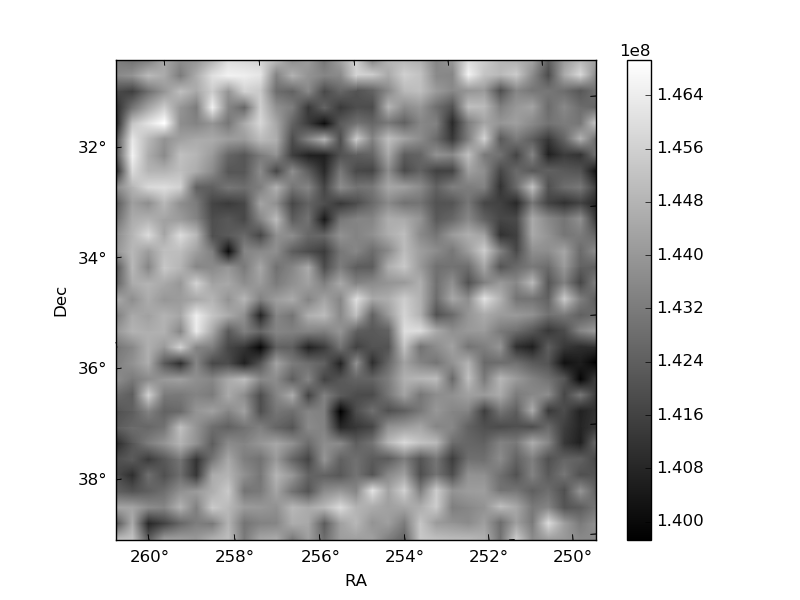
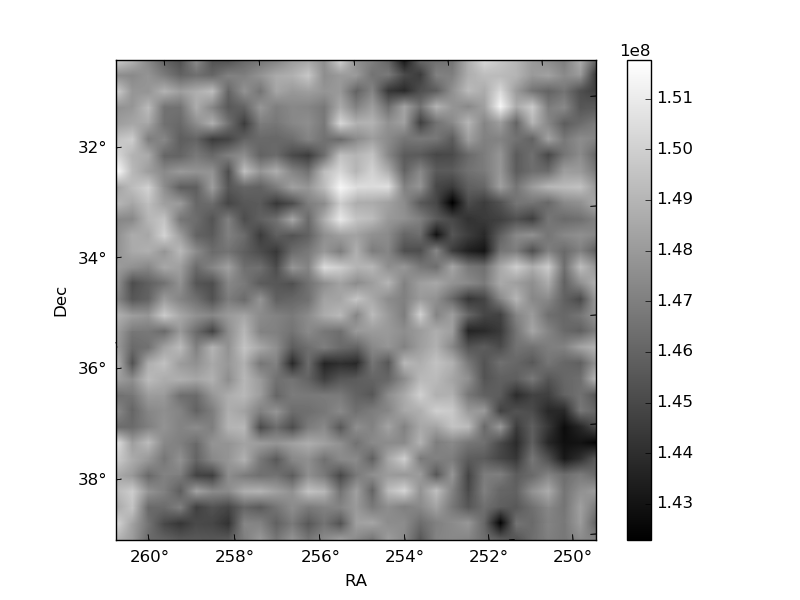
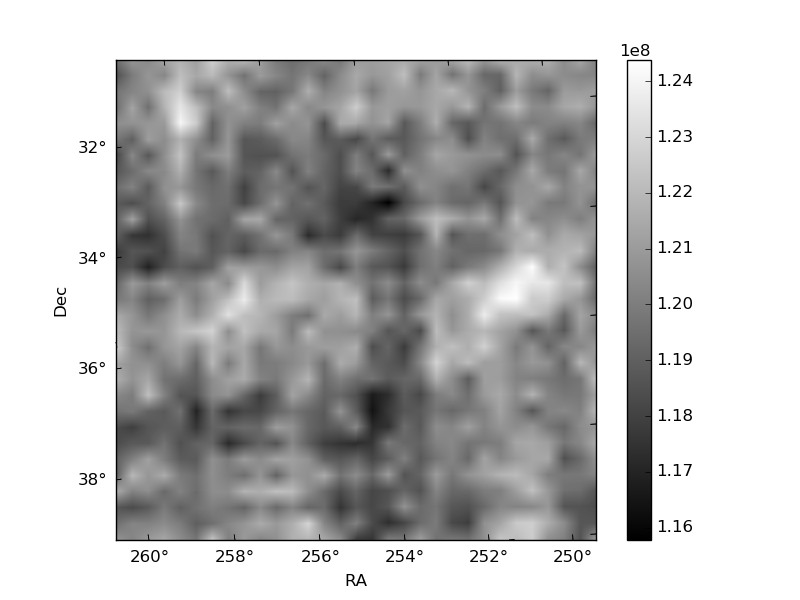
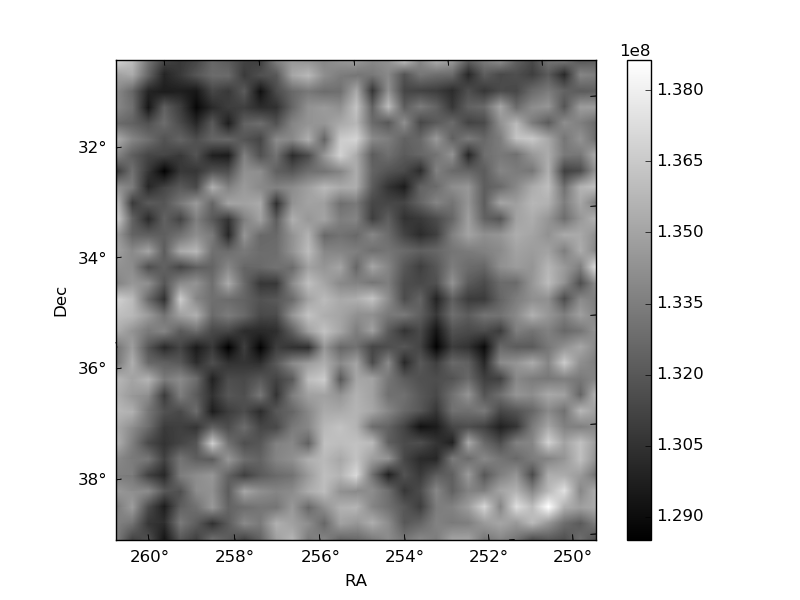
Histogram calculated using DETX and DETY for each event in the final _common_clean file
| Quadrant A | 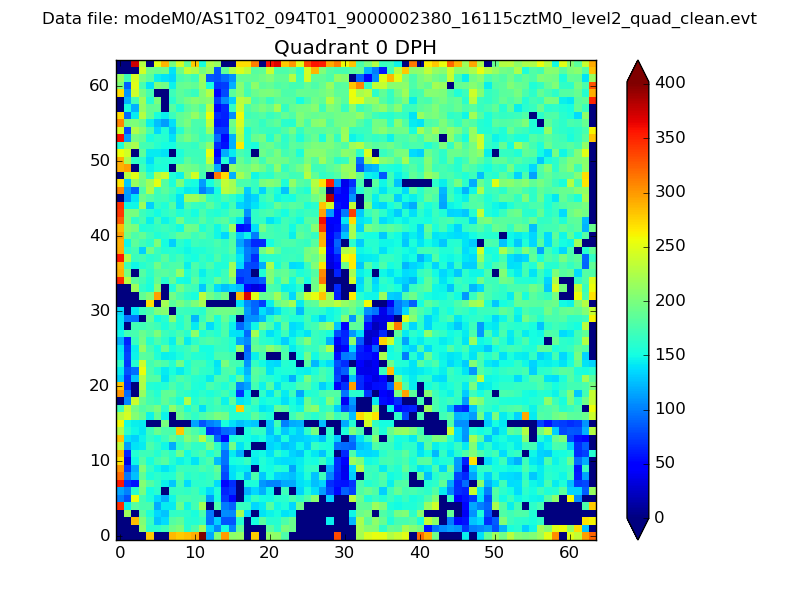 |
 |
Quadrant B |
|---|---|---|---|
| Quadrant D | 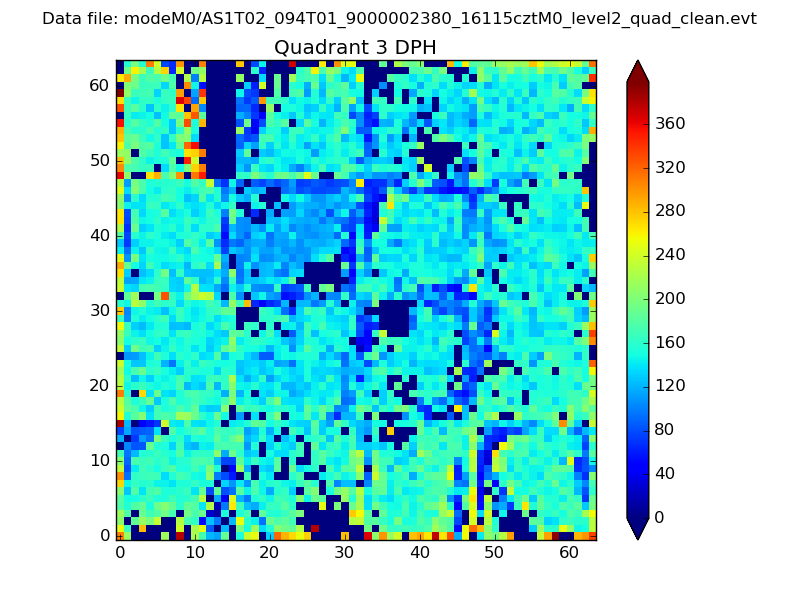 |
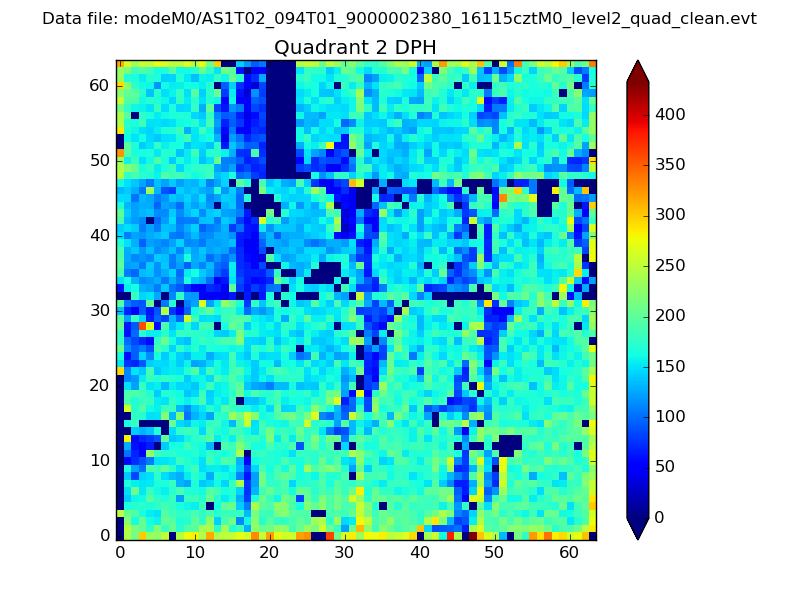 |
Quadrant C |
| Plot type | Count rate plots | Images |
|---|---|---|
| Comparison with Poisson distribution Blue bars denote a histogram of data divided into 1 sec bins. Red curve is a Poisson curve with rate = median count rate of data. |
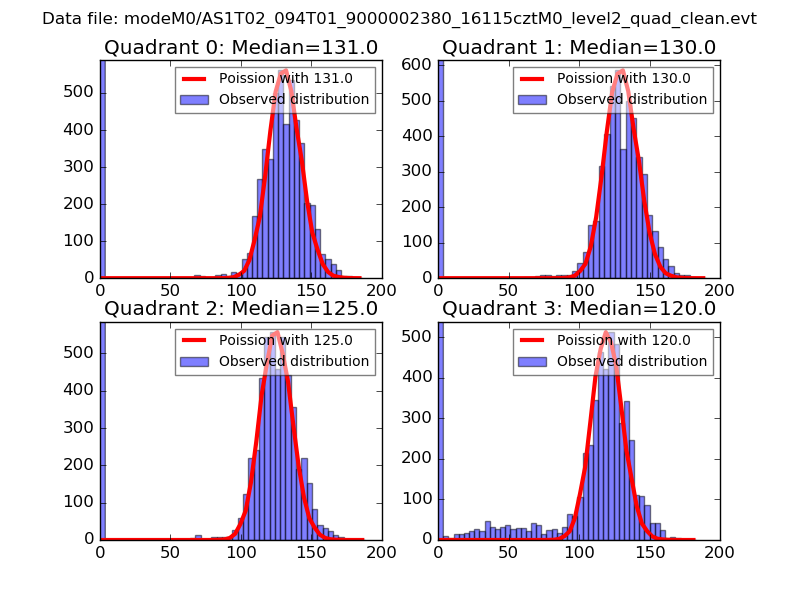 |
 |
| Quadrant-wise count rates Data is divided into 100 sec bins |
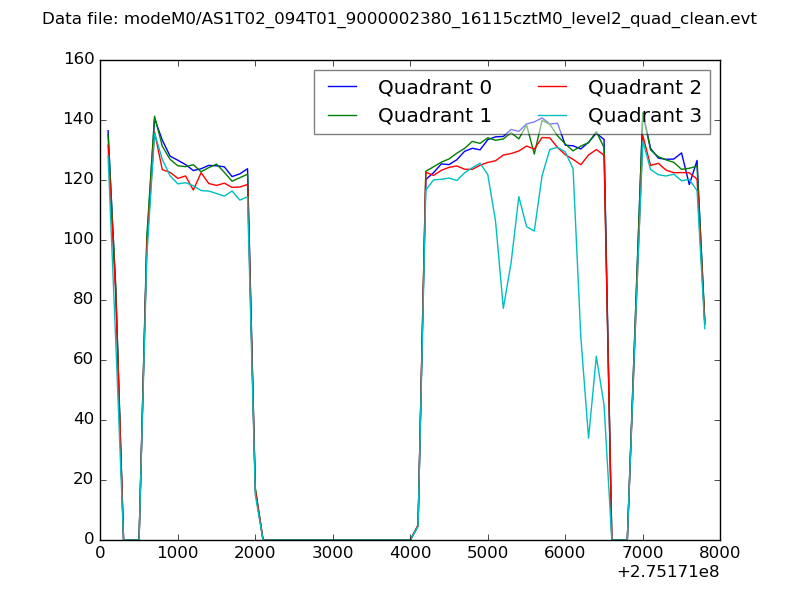 |
|
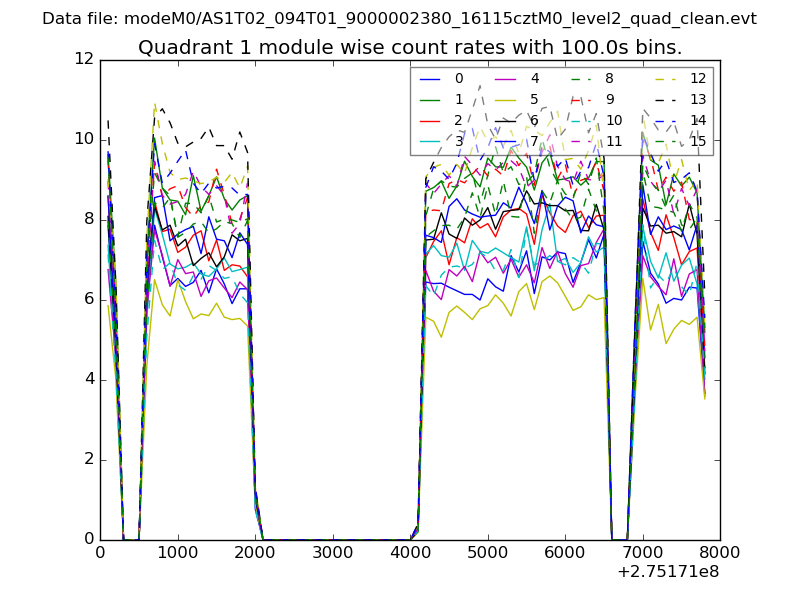
| Module-wise count rates for Quadrant A Data is divided into 100 sec bins |
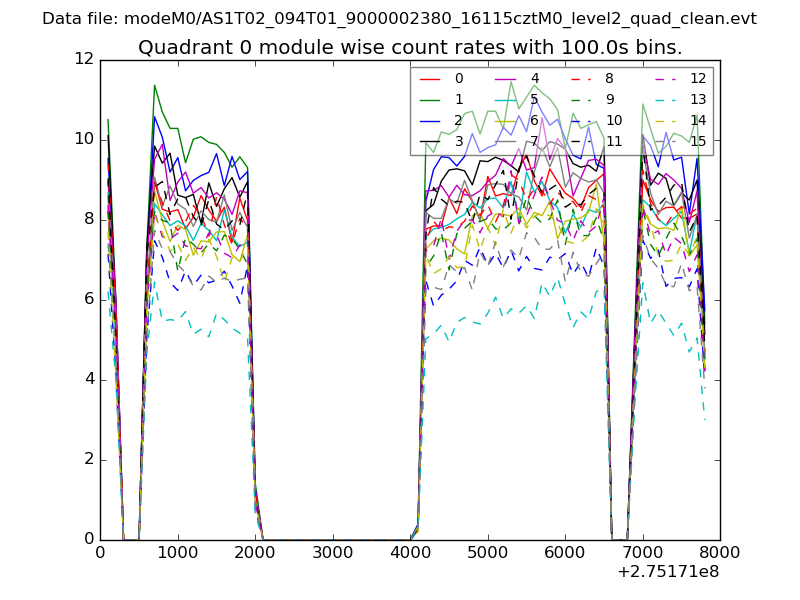 |
 |
| Module-wise count rates for Quadrant B Data is divided into 100 sec bins |
 |
 |
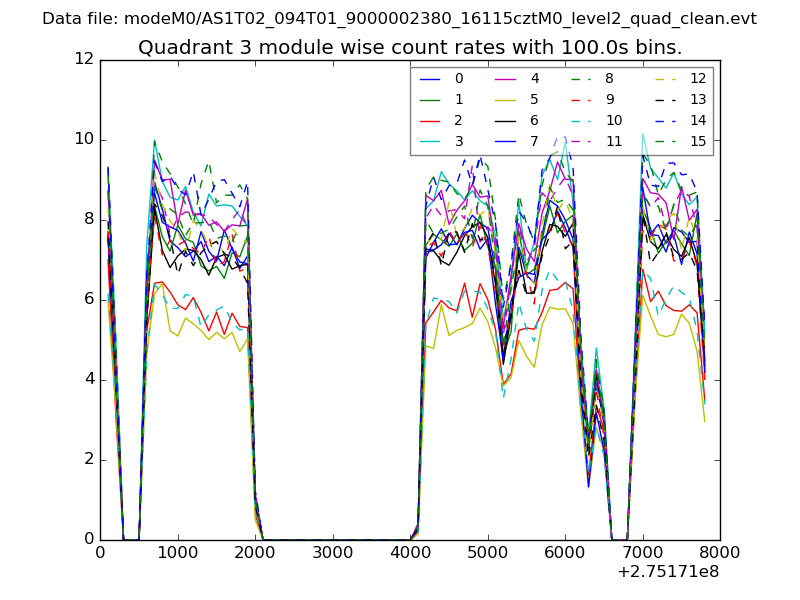
| Module-wise count rates for Quadrant C Data is divided into 100 sec bins |
 |
 |
| Module-wise count rates for Quadrant D Data is divided into 100 sec bins |
 |
 |
| Parameter | Plot |
|---|---|
| CZT HV Monitor | 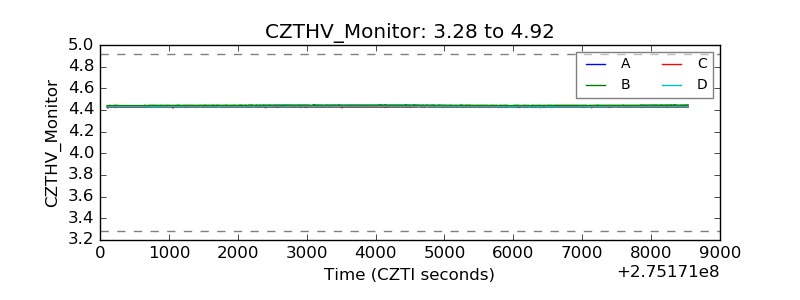 |
| D_VDD | 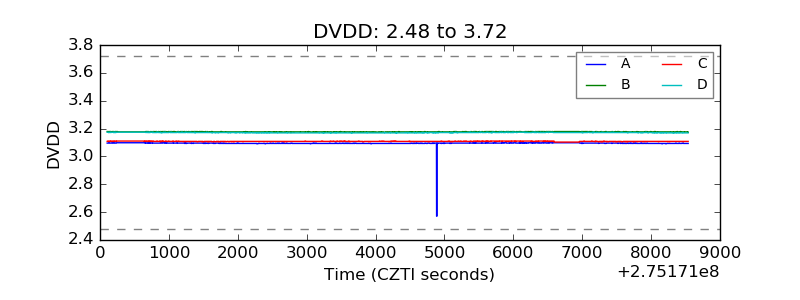 |
| Temperature 1 | 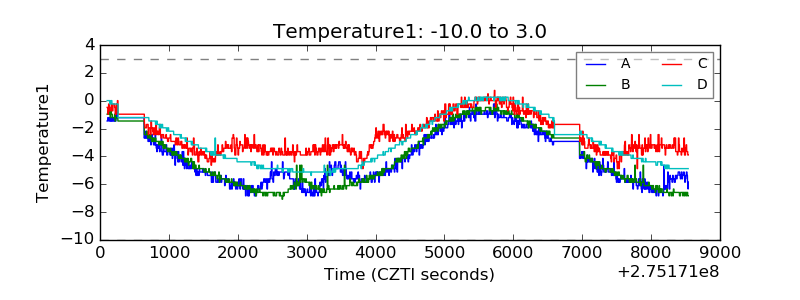 |
| Veto HV Monitor | 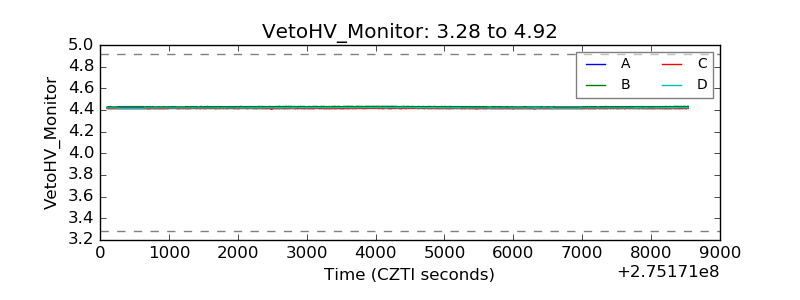 |
| Veto LLD |  |
| Alpha Counter | 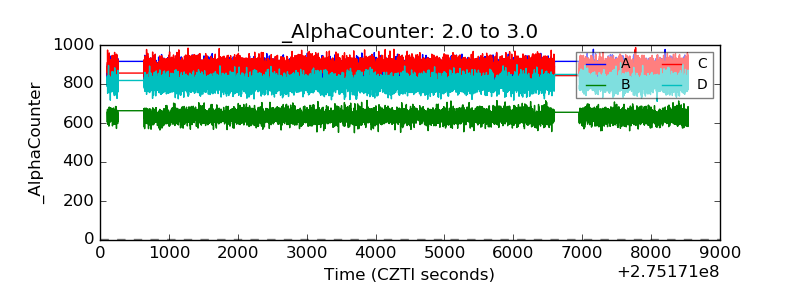 |
| _CPM_Rate | 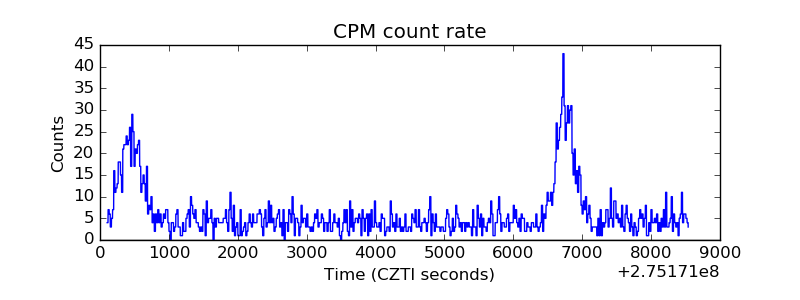 |
| CZT Counter | 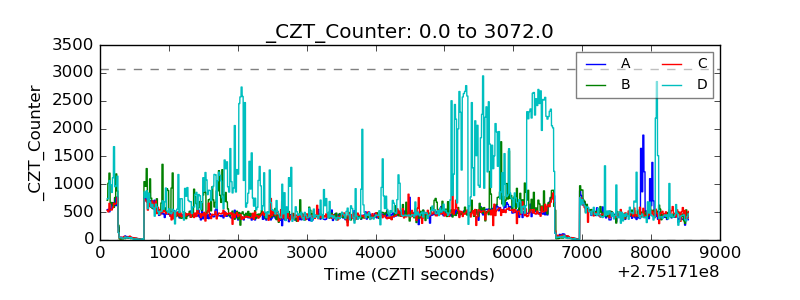 |
| +2.5 Volts monitor |  |
| +5 Volts monitor | 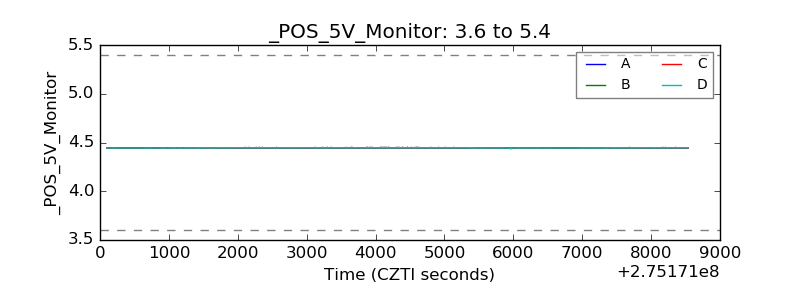 |
| _ROLL_ROT | 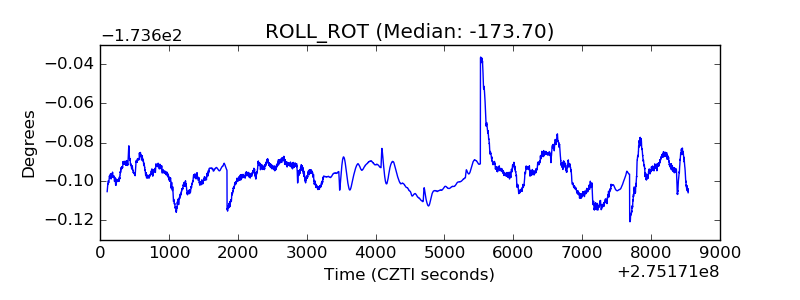 |
| _Roll_DEC | 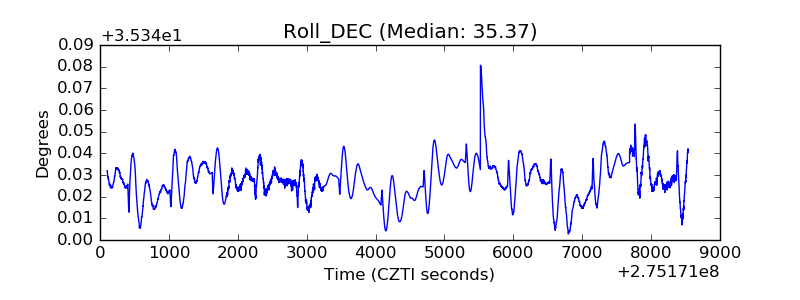 |
| _Roll_RA |  |
| Veto Counter | 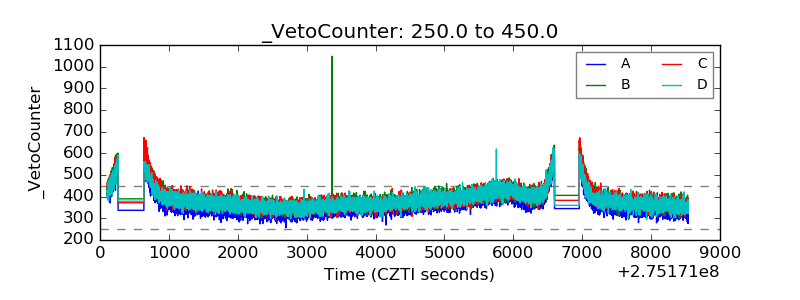 |