| Param | Original file | Final file |
|---|---|---|
| Filename | modeM0/AS1T02_094T01_9000002380_16118cztM0_level2.evt | modeM0/AS1T02_094T01_9000002380_16118cztM0_level2_quad_clean.evt |
| Size (bytes) | 1,368,858,240 | 220,101,120 |
| Size | 1.3 GB | 209.9 MB |
| Events in quadrant A | 9,195,340 | 1,387,746 |
| Events in quadrant B | 9,534,985 | 1,382,377 |
| Events in quadrant C | 9,505,207 | 1,332,588 |
| Events in quadrant D | 11,958,247 | 1,275,948 |
| Mode M0 | |||
|---|---|---|---|
| Quadrant | BADHDUFLAG | Total packets | Discarded packets |
| A | 0 | 39672 | 5 |
| B | 0 | 40270 | 4 |
| C | 0 | 40137 | 4 |
| D | 0 | 48262 | 4 |
| Mode SS | |||
|---|---|---|---|
| Quadrant | BADHDUFLAG | Total packets | Discarded packets |
| A | 0 | 384 | 0 |
| B | 0 | 384 | 0 |
| C | 0 | 384 | 0 |
| D | 0 | 384 | 0 |
| Mode M9 | |||
|---|---|---|---|
| Quadrant | BADHDUFLAG | Total packets | Discarded packets |
| A | 0 | 22 | 0 |
| B | 0 | 22 | 0 |
| C | 0 | 22 | 0 |
| D | 0 | 22 | 0 |
| Quadrant | Total seconds | Saturated seconds | Saturation percentage |
|---|---|---|---|
| A | 18671 | 263 | 1.408602% |
| B | 18671 | 260 | 1.392534% |
| C | 18671 | 377 | 2.019174% |
| D | 18671 | 846 | 4.531091% |
Noise dominated data is calculated using 1-second bins in cleaned event files. If a bin has >2000 counts, and if more than 50% of those come from <1% of pixels, then it is considered to be noise-dominated and hence unusable.
| Quadrant | # 1 sec bins | Bins with >0 counts | Bins with >2000 counts | High rate bins dominated by noise | Noise dominated (total time) | Noise dominated (detector-on time) | Marked lightcurve |
|---|---|---|---|---|---|---|---|
| A | 20937 | 18672 | 67 | 67 | 0.32% | 0.36% | 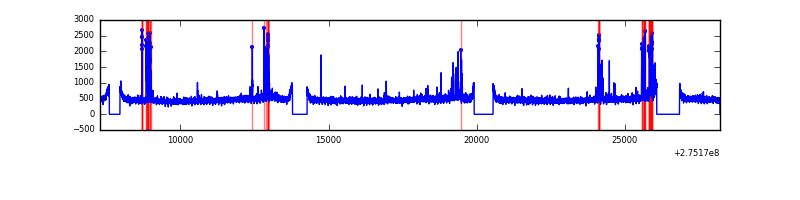 |
| B | 20937 | 18672 | 16 | 16 | 0.08% | 0.09% | 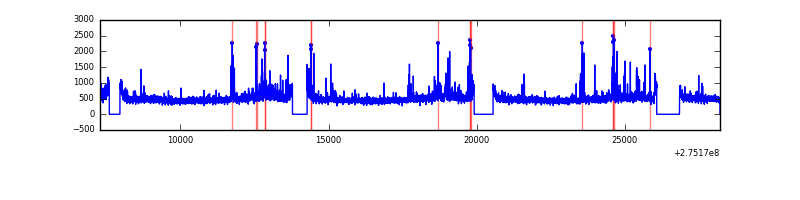 |
| C | 20937 | 18672 | 99 | 99 | 0.47% | 0.53% | 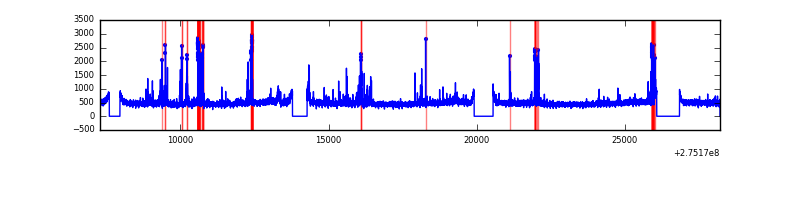 |
| D | 20937 | 18672 | 679 | 679 | 3.24% | 3.64% | 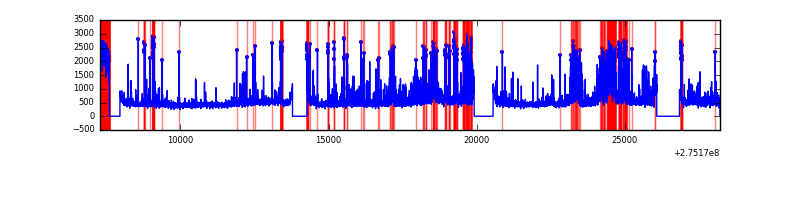 |
Top three noisy pixels from each quadrant. If the there are fewer than three noisy pixels in the level2.evt file, extra rows are filled as -1
| Pixel properties | Quadrant properties | ||||||
|---|---|---|---|---|---|---|---|
| Quadrant | DetID | PixID | Counts | Sigma | Mean | Median | Sigma |
| A | 15 | 174 | 504915 | 1112.91 | 2245 | 2191 | 451.7 |
| A | 9 | 143 | 27915 | 56.95 | 2245 | 2191 | 451.7 |
| A | 8 | 247 | 23485 | 47.14 | 2245 | 2191 | 451.7 |
| B | 0 | 189 | 170859 | 390.65 | 2249 | 2193 | 431.8 |
| B | 7 | 220 | 120455 | 273.91 | 2249 | 2193 | 431.8 |
| B | 4 | 216 | 99273 | 224.85 | 2249 | 2193 | 431.8 |
| C | 9 | 236 | 651230 | 1288.01 | 2153 | 2168 | 503.9 |
| C | 14 | 238 | 328721 | 648.02 | 2153 | 2168 | 503.9 |
| C | 3 | 233 | 94683 | 183.59 | 2153 | 2168 | 503.9 |
| D | 5 | 222 | 1552911 | 2968.12 | 2147 | 2084 | 522.5 |
| D | 1 | 52 | 1175431 | 2245.66 | 2147 | 2084 | 522.5 |
| D | 7 | 38 | 937885 | 1791.02 | 2147 | 2084 | 522.5 |
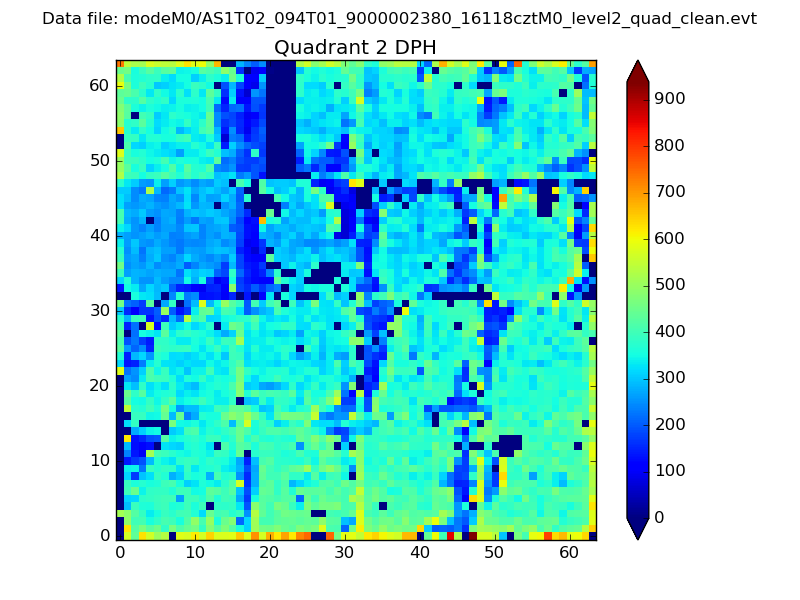
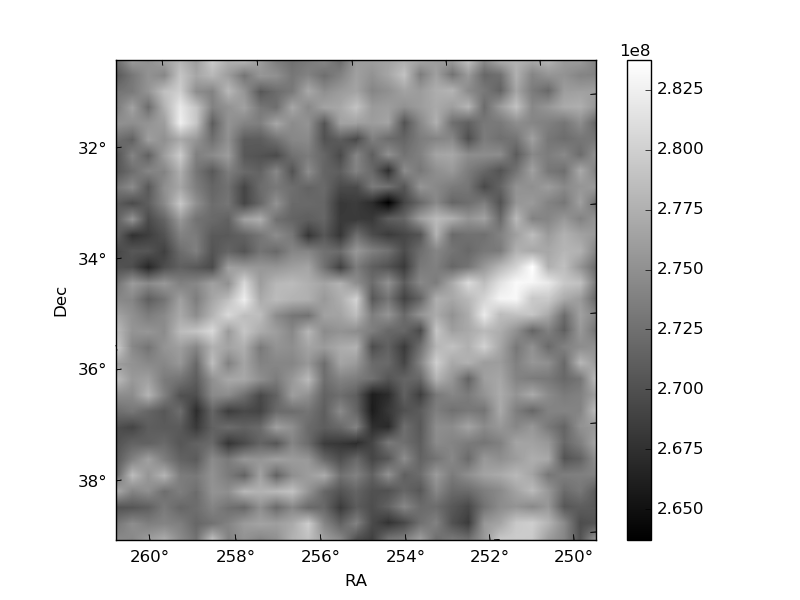
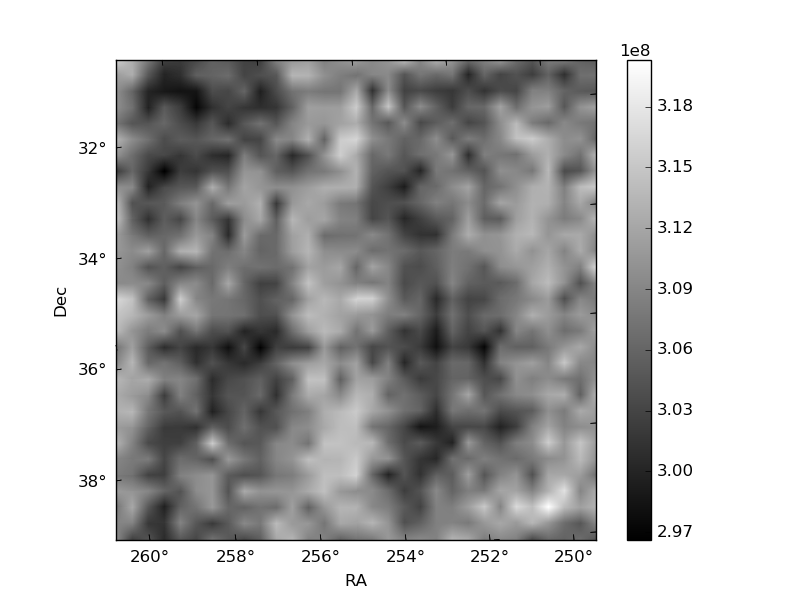
Histogram calculated using DETX and DETY for each event in the final _common_clean file
| Quadrant A | 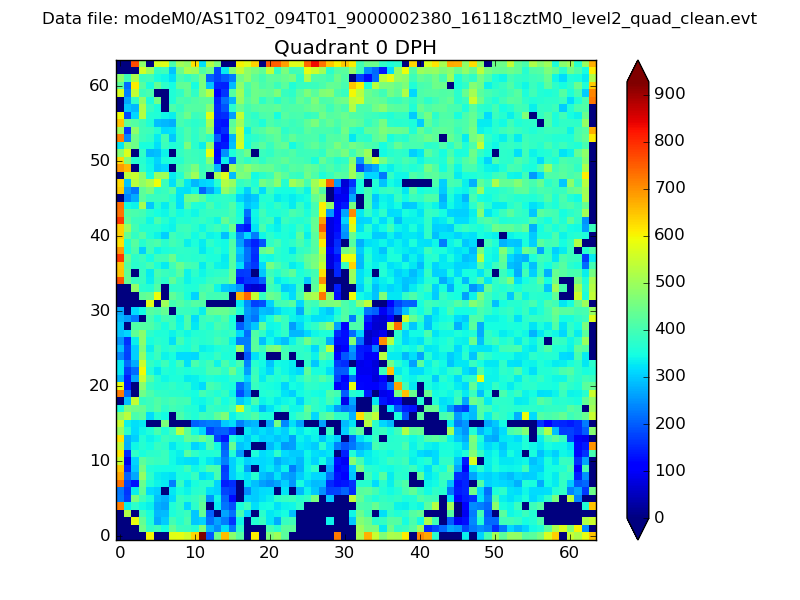 |
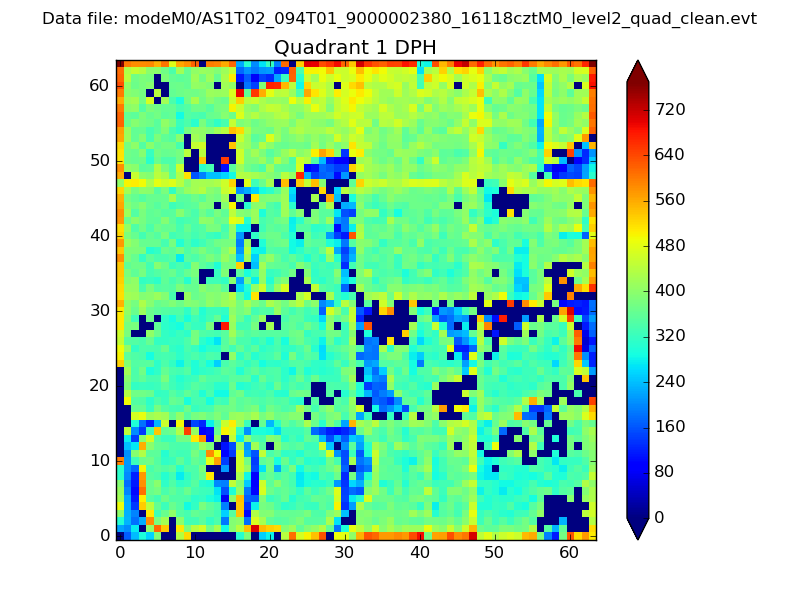 |
Quadrant B |
|---|---|---|---|
| Quadrant D | 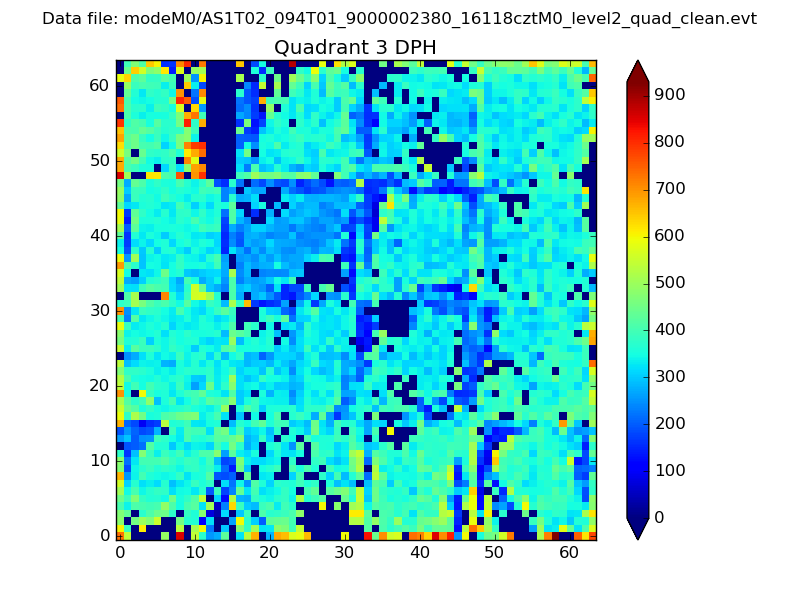 |
 |
Quadrant C |
| Plot type | Count rate plots | Images |
|---|---|---|
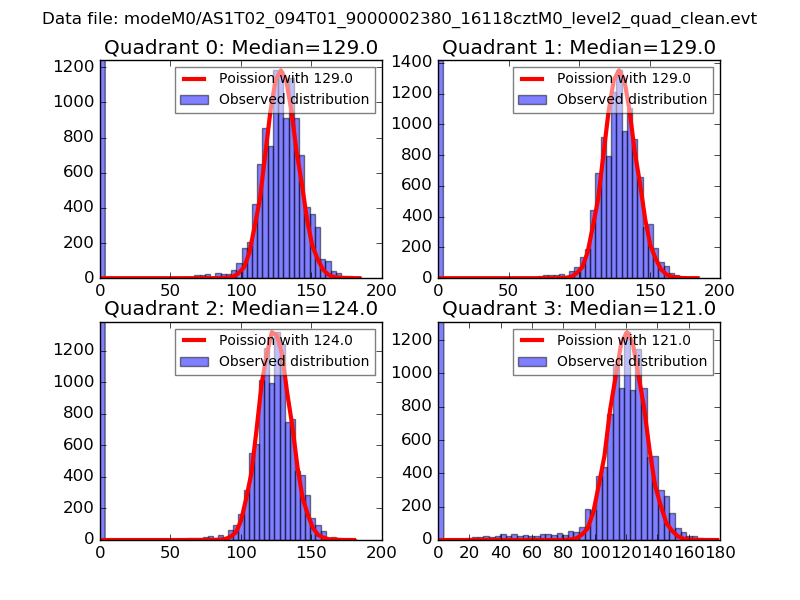
| Comparison with Poisson distribution Blue bars denote a histogram of data divided into 1 sec bins. Red curve is a Poisson curve with rate = median count rate of data. |
 |
 |
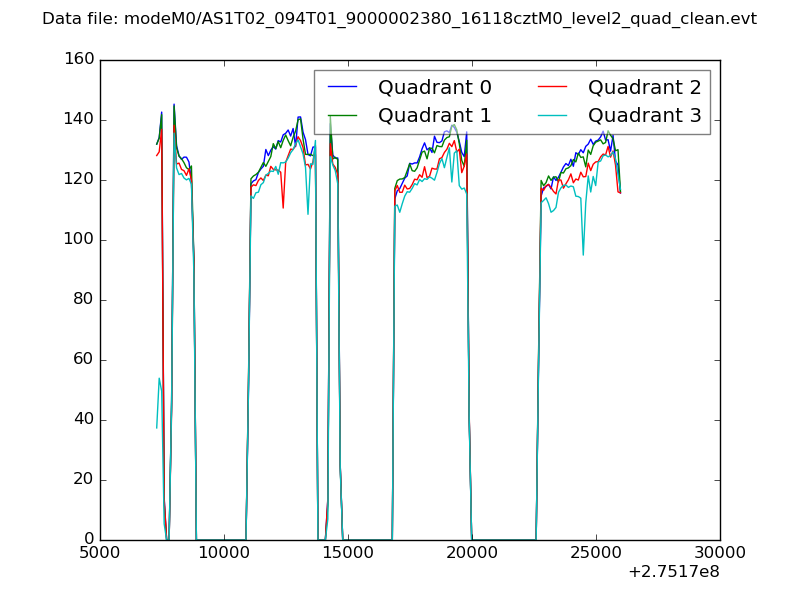
| Quadrant-wise count rates Data is divided into 100 sec bins |
 |
|
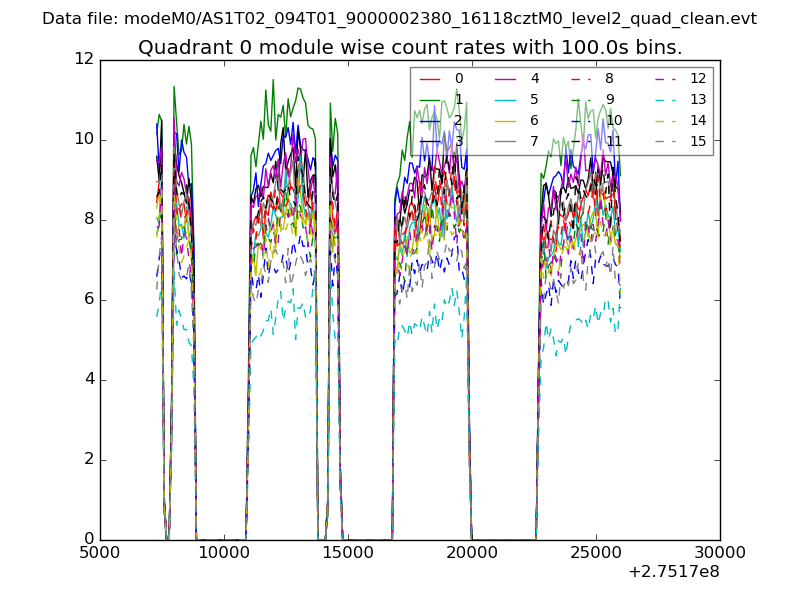
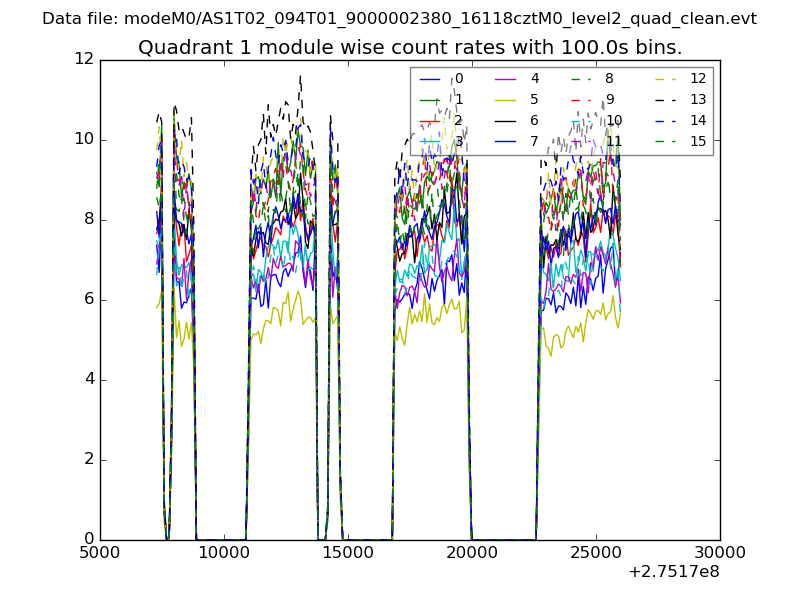
| Module-wise count rates for Quadrant A Data is divided into 100 sec bins |
 |
 |
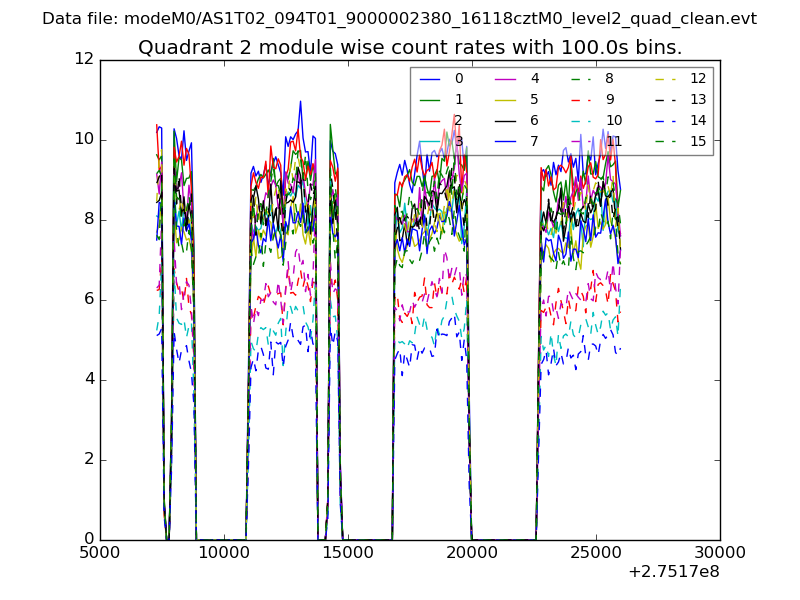
| Module-wise count rates for Quadrant B Data is divided into 100 sec bins |
 |
 |
| Module-wise count rates for Quadrant C Data is divided into 100 sec bins |
 |
 |
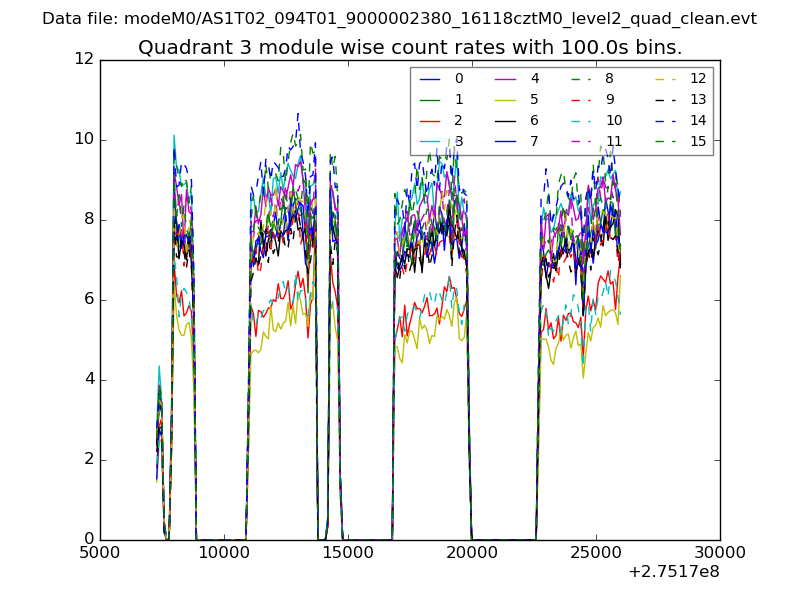
| Module-wise count rates for Quadrant D Data is divided into 100 sec bins |
 |
 |
| Parameter | Plot |
|---|---|
| CZT HV Monitor | 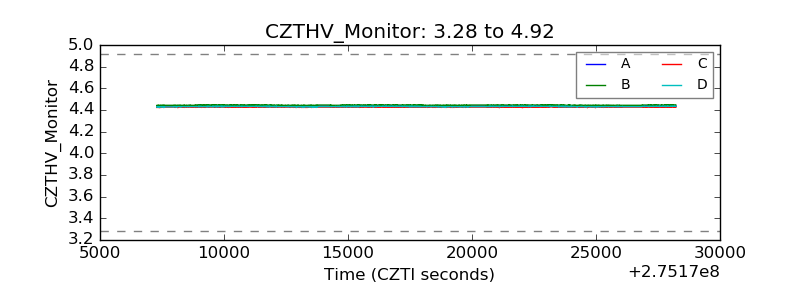 |
| D_VDD | 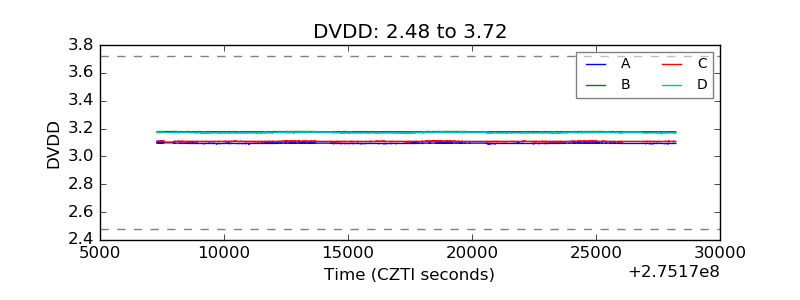 |
| Temperature 1 | 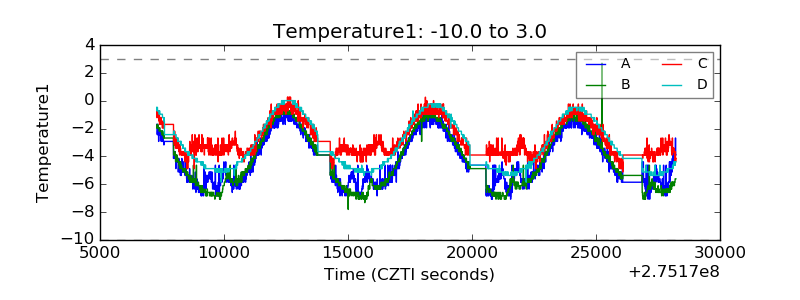 |
| Veto HV Monitor | 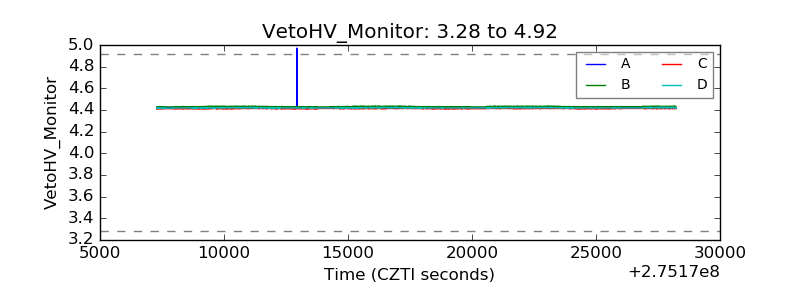 |
| Veto LLD | 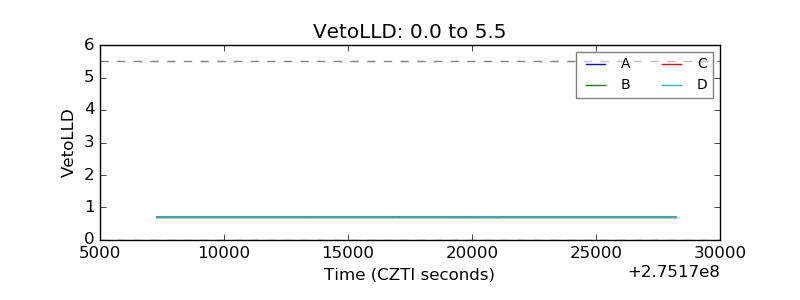 |
| Alpha Counter | 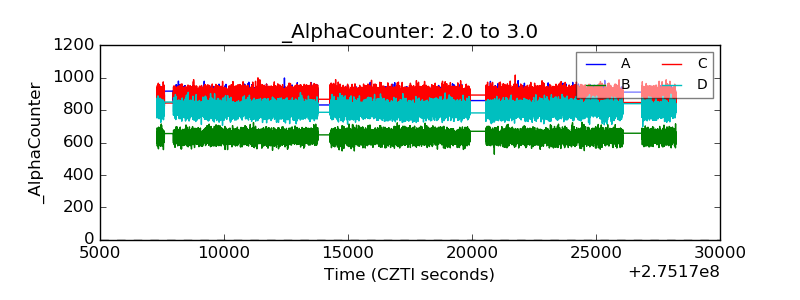 |
| _CPM_Rate | 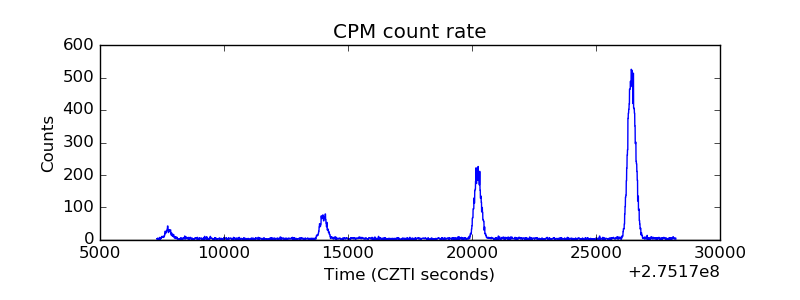 |
| CZT Counter | 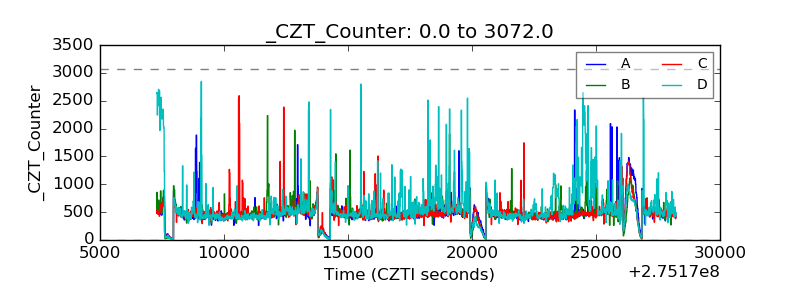 |
| +2.5 Volts monitor |  |
| +5 Volts monitor |  |
| _ROLL_ROT | 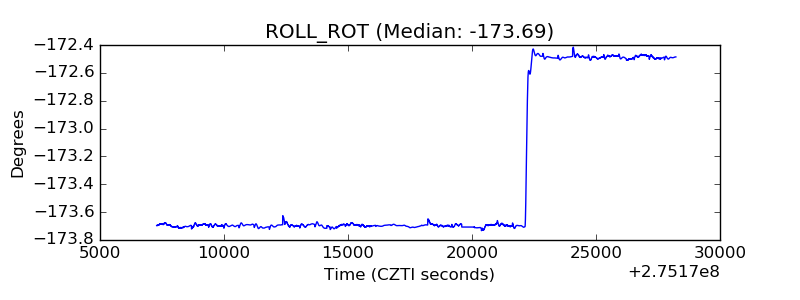 |
| _Roll_DEC | 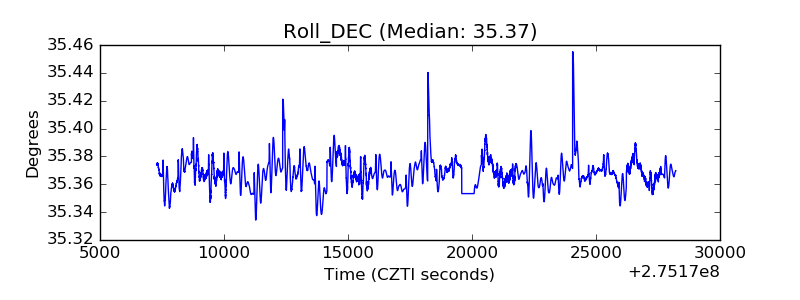 |
| _Roll_RA | 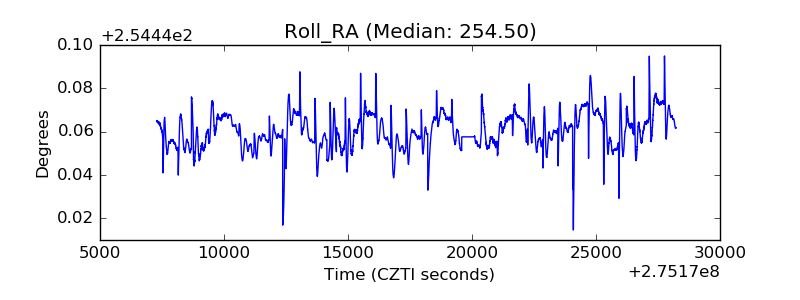 |
| Veto Counter | 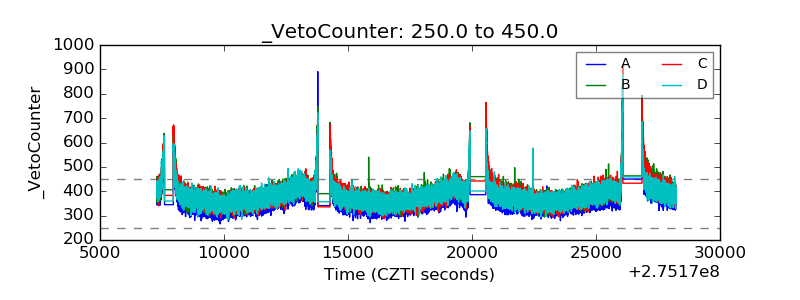 |