| Param | Original file | Final file |
|---|---|---|
| Filename | modeM0/AS1T02_094T01_9000002380_16123cztM0_level2.evt | modeM0/AS1T02_094T01_9000002380_16123cztM0_level2_quad_clean.evt |
| Size (bytes) | 542,404,800 | 110,335,680 |
| Size | 517.3 MB | 105.2 MB |
| Events in quadrant A | 3,822,700 | 760,997 |
| Events in quadrant B | 3,737,161 | 755,321 |
| Events in quadrant C | 3,340,926 | 708,154 |
| Events in quadrant D | 5,100,297 | 678,616 |
| Mode M0 | |||
|---|---|---|---|
| Quadrant | BADHDUFLAG | Total packets | Discarded packets |
| A | 0 | 15565 | 3 |
| B | 0 | 15061 | 2 |
| C | 0 | 13809 | 2 |
| D | 0 | 19378 | 2 |
| Mode SS | |||
|---|---|---|---|
| Quadrant | BADHDUFLAG | Total packets | Discarded packets |
| A | 0 | 128 | 0 |
| B | 0 | 128 | 0 |
| C | 0 | 128 | 0 |
| D | 0 | 128 | 0 |
| Mode M9 | |||
|---|---|---|---|
| Quadrant | BADHDUFLAG | Total packets | Discarded packets |
| A | 0 | 18 | 0 |
| B | 0 | 18 | 0 |
| C | 0 | 18 | 0 |
| D | 0 | 19 | 0 |
| Quadrant | Total seconds | Saturated seconds | Saturation percentage |
|---|---|---|---|
| A | 6282 | 104 | 1.655524% |
| B | 6282 | 155 | 2.467367% |
| C | 6282 | 111 | 1.766953% |
| D | 6282 | 477 | 7.593123% |
Noise dominated data is calculated using 1-second bins in cleaned event files. If a bin has >2000 counts, and if more than 50% of those come from <1% of pixels, then it is considered to be noise-dominated and hence unusable.
| Quadrant | # 1 sec bins | Bins with >0 counts | Bins with >2000 counts | High rate bins dominated by noise | Noise dominated (total time) | Noise dominated (detector-on time) | Marked lightcurve |
|---|---|---|---|---|---|---|---|
| A | 7553 | 6283 | 31 | 31 | 0.41% | 0.49% | 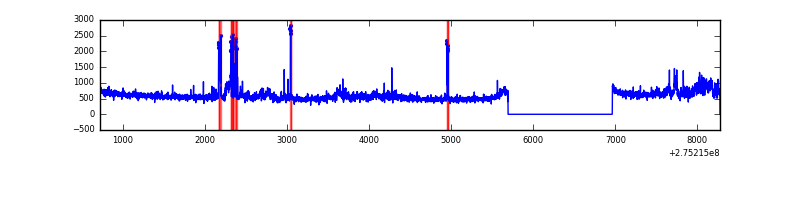 |
| B | 7553 | 6283 | 62 | 62 | 0.82% | 0.99% | 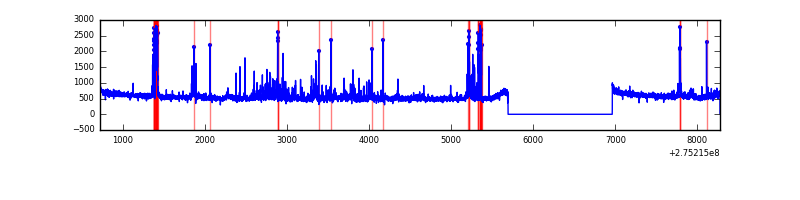 |
| C | 7553 | 6283 | 1 | 1 | 0.01% | 0.02% | 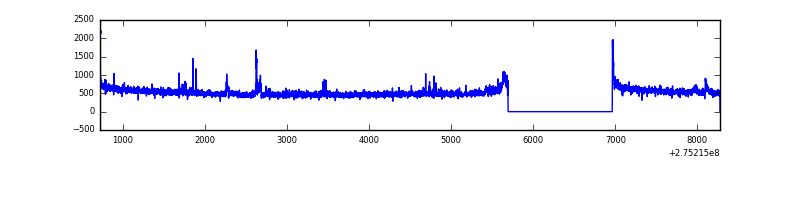 |
| D | 7552 | 6282 | 453 | 453 | 6.00% | 7.21% | 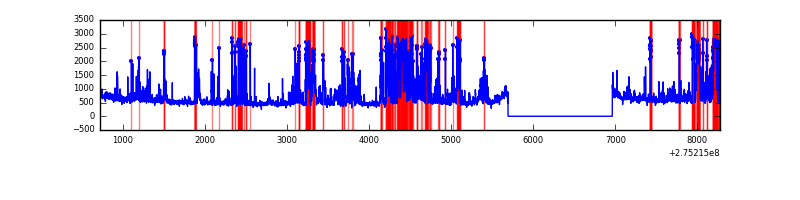 |
Top three noisy pixels from each quadrant. If the there are fewer than three noisy pixels in the level2.evt file, extra rows are filled as -1
| Pixel properties | Quadrant properties | ||||||
|---|---|---|---|---|---|---|---|
| Quadrant | DetID | PixID | Counts | Sigma | Mean | Median | Sigma |
| A | 0 | 253 | 364787 | 2149.26 | 851 | 836 | 169.3 |
| A | 15 | 174 | 169174 | 994.09 | 851 | 836 | 169.3 |
| A | 9 | 143 | 10404 | 56.5 | 851 | 836 | 169.3 |
| B | 15 | 201 | 85253 | 539.75 | 833 | 814 | 156.4 |
| B | 7 | 220 | 80840 | 511.54 | 833 | 814 | 156.4 |
| B | 0 | 244 | 78205 | 494.7 | 833 | 814 | 156.4 |
| C | 3 | 233 | 137998 | 757.77 | 787 | 796 | 181.1 |
| C | 14 | 238 | 124738 | 684.54 | 787 | 796 | 181.1 |
| C | 0 | 207 | 6703 | 32.62 | 787 | 796 | 181.1 |
| D | 1 | 52 | 1500551 | 7702.04 | 795 | 772 | 194.7 |
| D | 7 | 38 | 259706 | 1329.74 | 795 | 772 | 194.7 |
| D | 5 | 222 | 179727 | 919.01 | 795 | 772 | 194.7 |
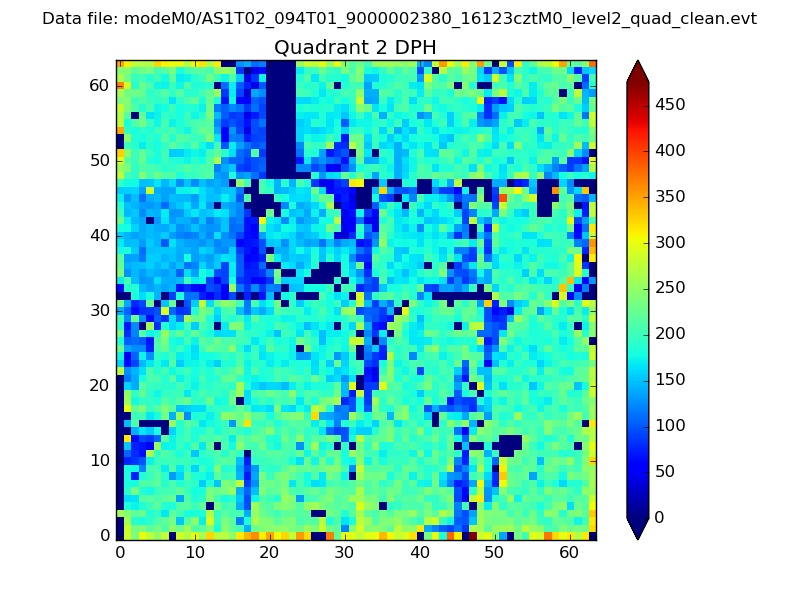
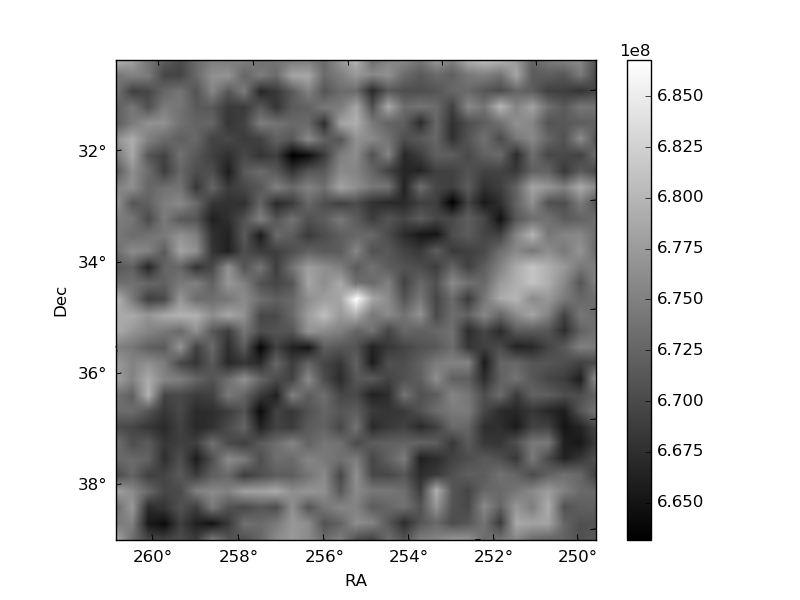
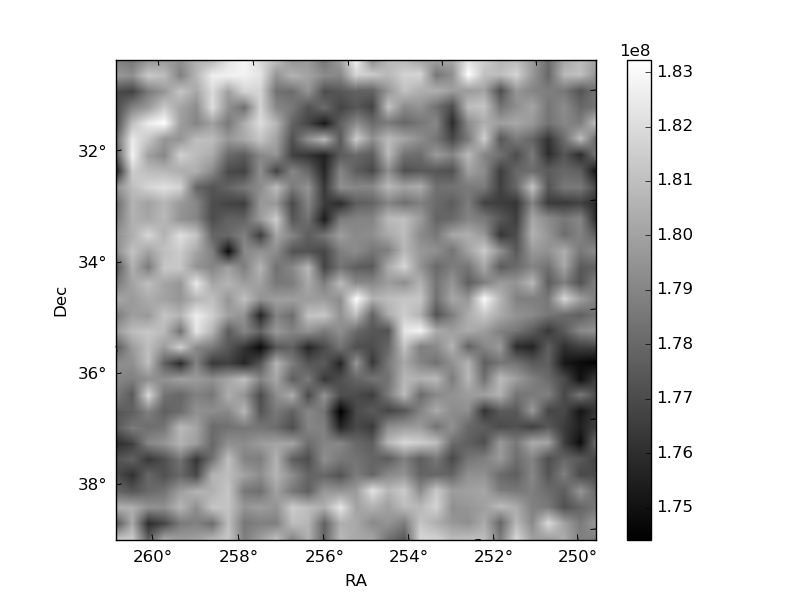
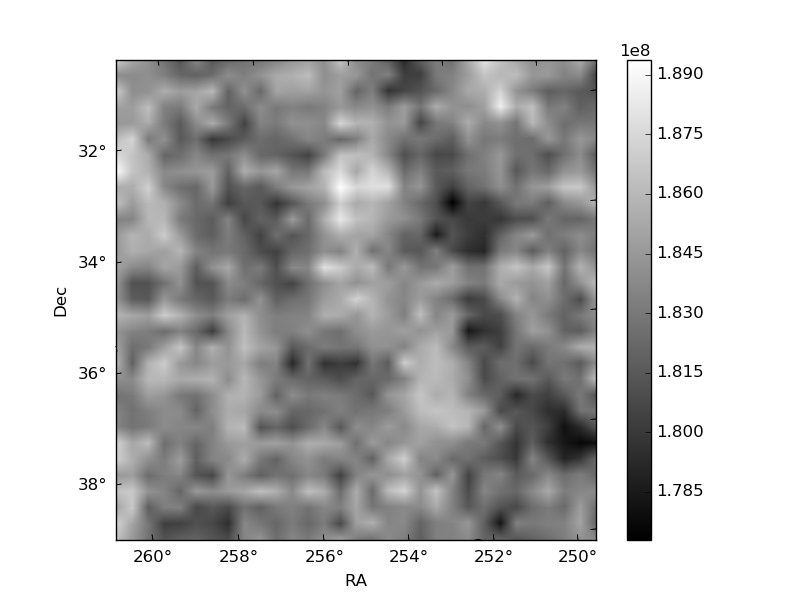
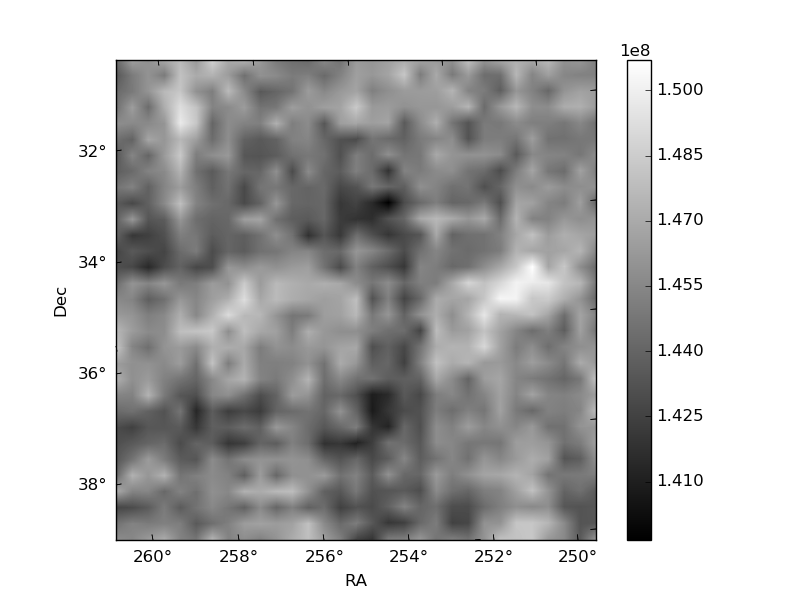
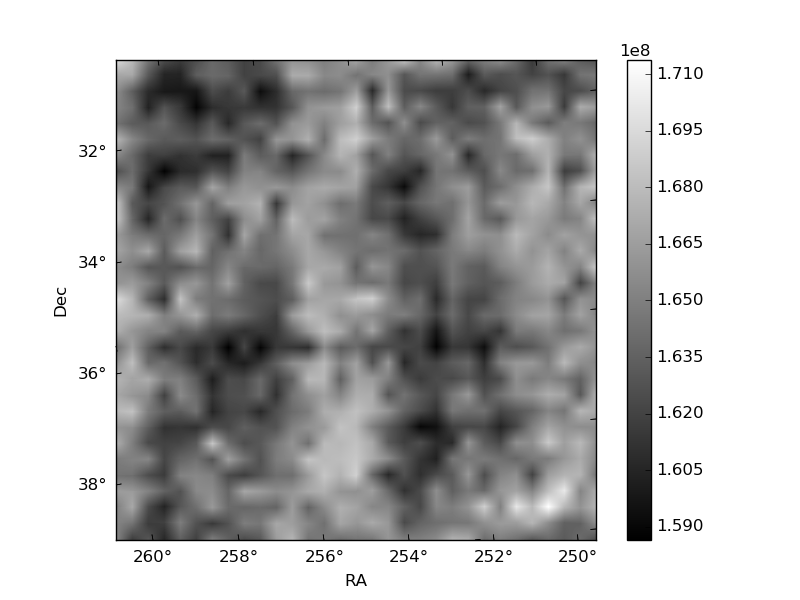
Histogram calculated using DETX and DETY for each event in the final _common_clean file
| Quadrant A | 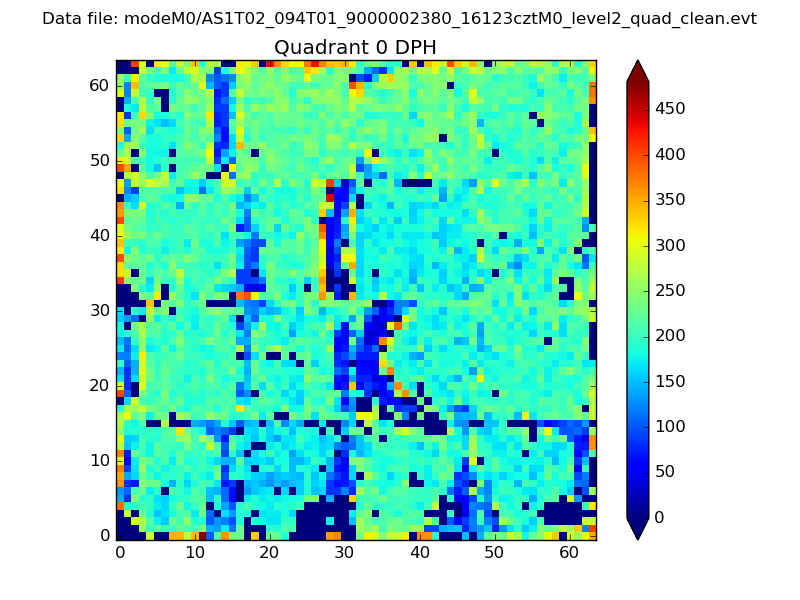 |
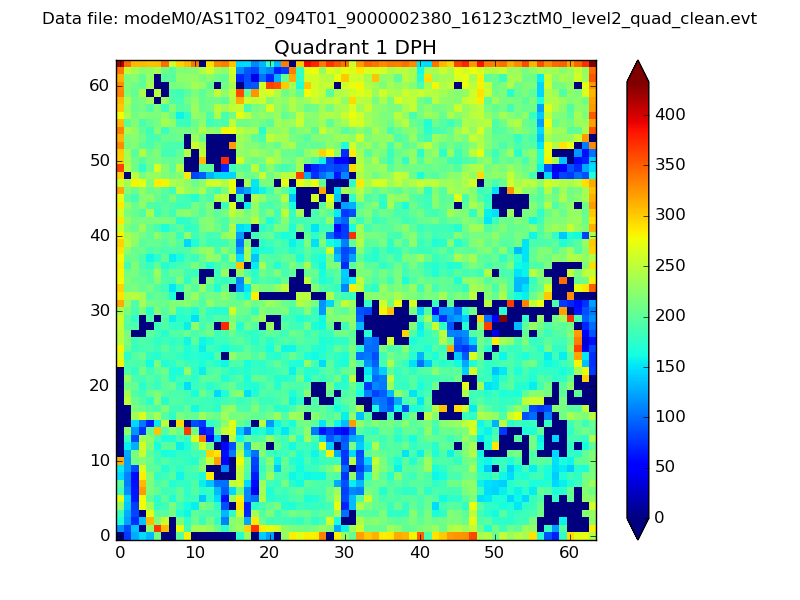 |
Quadrant B |
|---|---|---|---|
| Quadrant D | 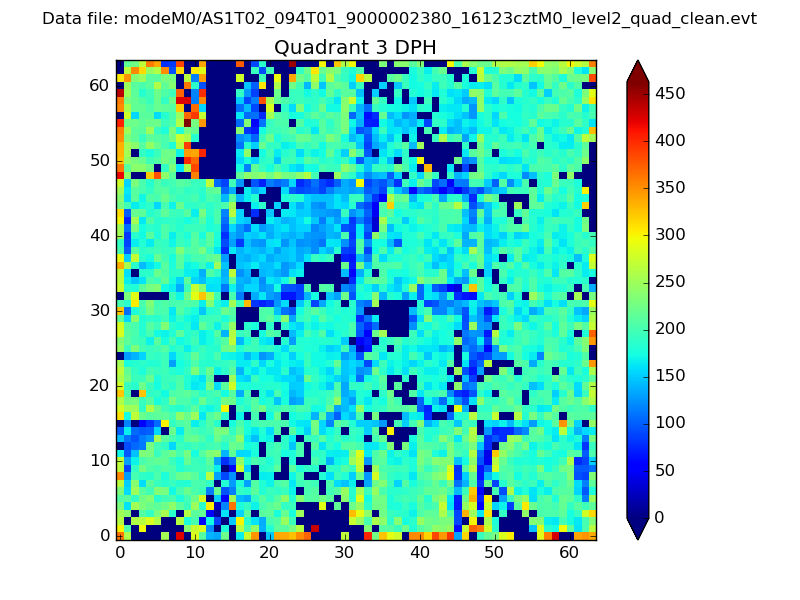 |
 |
Quadrant C |
| Plot type | Count rate plots | Images |
|---|---|---|
| Comparison with Poisson distribution Blue bars denote a histogram of data divided into 1 sec bins. Red curve is a Poisson curve with rate = median count rate of data. |
 |
 |
| Quadrant-wise count rates Data is divided into 100 sec bins |
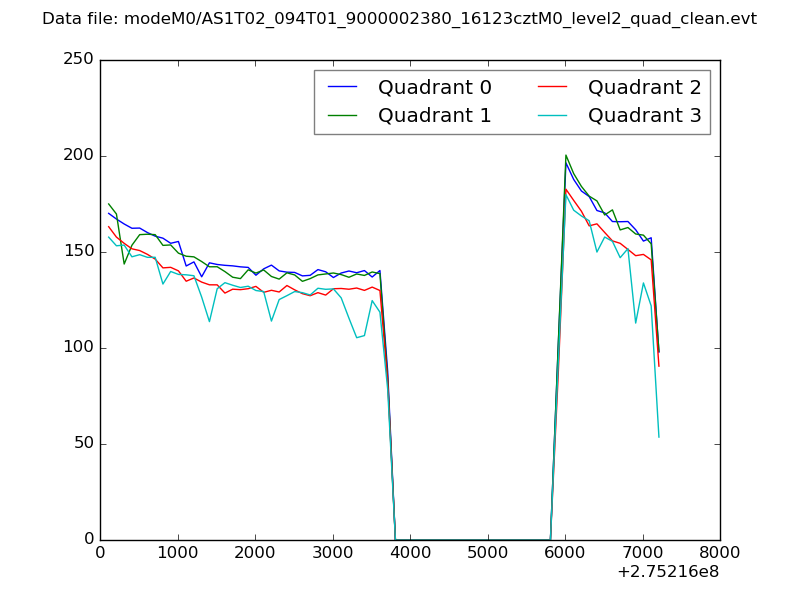 |
|
| Module-wise count rates for Quadrant A Data is divided into 100 sec bins |
 |
 |
| Module-wise count rates for Quadrant B Data is divided into 100 sec bins |
 |
 |
| Module-wise count rates for Quadrant C Data is divided into 100 sec bins |
 |
 |
| Module-wise count rates for Quadrant D Data is divided into 100 sec bins |
 |
 |
| Parameter | Plot |
|---|---|
| CZT HV Monitor |  |
| D_VDD |  |
| Temperature 1 | 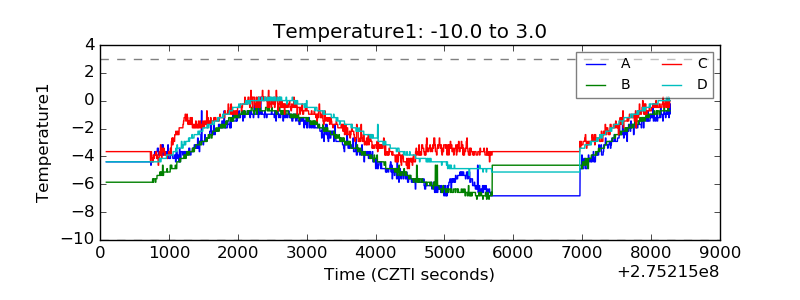 |
| Veto HV Monitor | 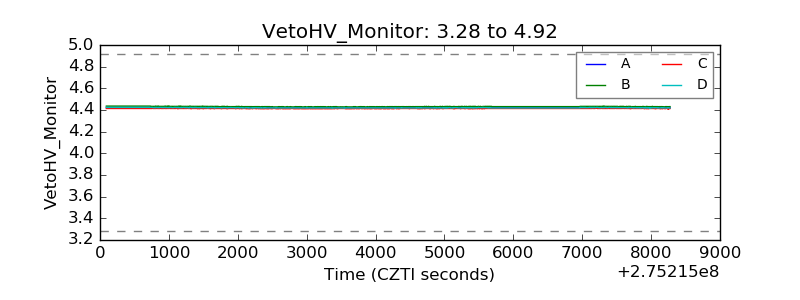 |
| Veto LLD | 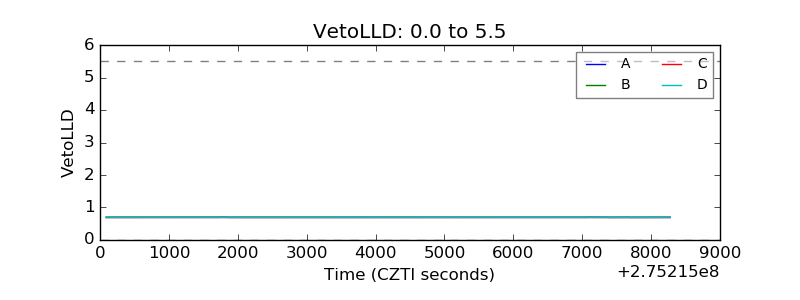 |
| Alpha Counter | 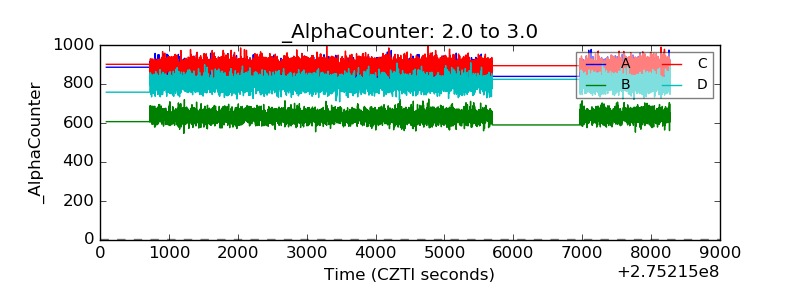 |
| _CPM_Rate | 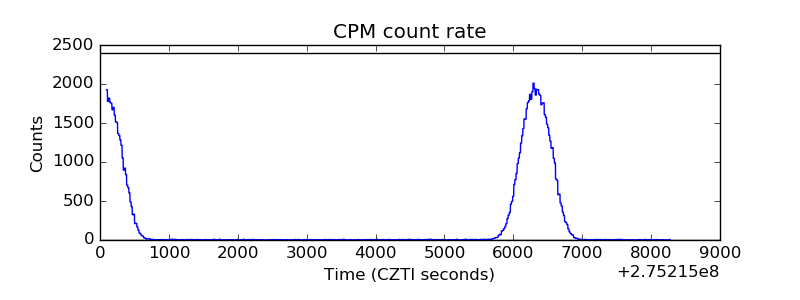 |
| CZT Counter | 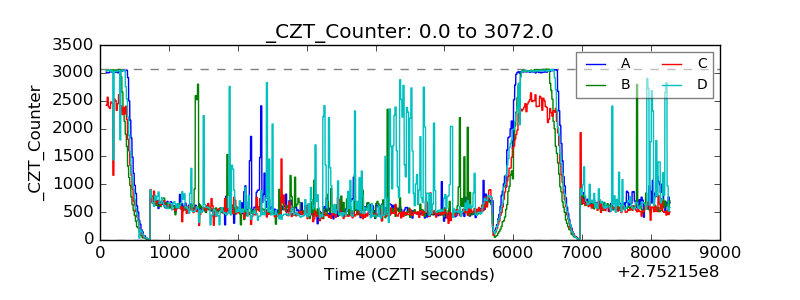 |
| +2.5 Volts monitor |  |
| +5 Volts monitor | 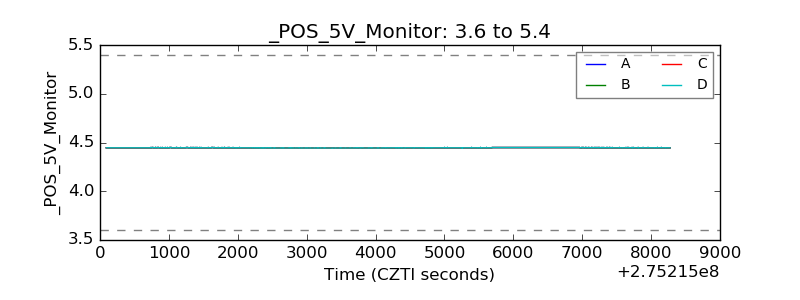 |
| _ROLL_ROT |  |
| _Roll_DEC | 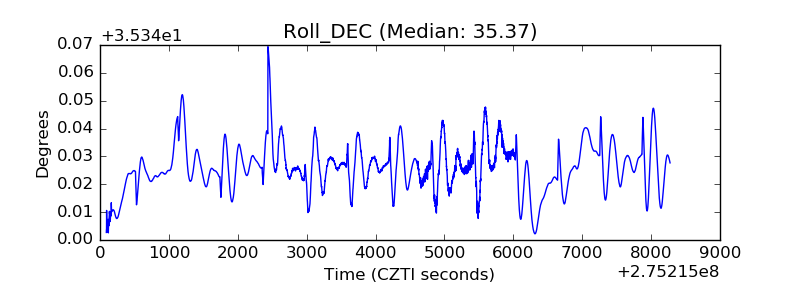 |
| _Roll_RA | 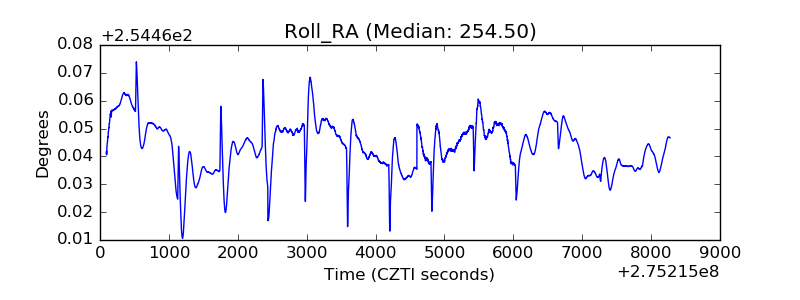 |
| Veto Counter |  |