| Param | Original file | Final file |
|---|---|---|
| Filename | modeM0/AS1T02_094T01_9000002380_16126cztM0_level2.evt | modeM0/AS1T02_094T01_9000002380_16126cztM0_level2_quad_clean.evt |
| Size (bytes) | 530,150,400 | 84,291,840 |
| Size | 505.6 MB | 80.4 MB |
| Events in quadrant A | 3,468,329 | 555,263 |
| Events in quadrant B | 4,058,061 | 547,465 |
| Events in quadrant C | 3,343,770 | 522,275 |
| Events in quadrant D | 4,768,475 | 497,856 |
| Mode M0 | |||
|---|---|---|---|
| Quadrant | BADHDUFLAG | Total packets | Discarded packets |
| A | 0 | 14294 | 2 |
| B | 0 | 16133 | 1 |
| C | 0 | 14029 | 1 |
| D | 0 | 18259 | 1 |
| Mode SS | |||
|---|---|---|---|
| Quadrant | BADHDUFLAG | Total packets | Discarded packets |
| A | 0 | 124 | 0 |
| B | 0 | 124 | 0 |
| C | 0 | 124 | 0 |
| D | 0 | 124 | 0 |
| Mode M9 | |||
|---|---|---|---|
| Quadrant | BADHDUFLAG | Total packets | Discarded packets |
| A | 0 | 11 | 0 |
| B | 0 | 11 | 0 |
| C | 0 | 11 | 0 |
| D | 0 | 11 | 0 |
| Quadrant | Total seconds | Saturated seconds | Saturation percentage |
|---|---|---|---|
| A | 6156 | 107 | 1.738142% |
| B | 6156 | 134 | 2.176738% |
| C | 6156 | 115 | 1.868096% |
| D | 6156 | 537 | 8.723197% |
Noise dominated data is calculated using 1-second bins in cleaned event files. If a bin has >2000 counts, and if more than 50% of those come from <1% of pixels, then it is considered to be noise-dominated and hence unusable.
| Quadrant | # 1 sec bins | Bins with >0 counts | Bins with >2000 counts | High rate bins dominated by noise | Noise dominated (total time) | Noise dominated (detector-on time) | Marked lightcurve |
|---|---|---|---|---|---|---|---|
| A | 7262 | 6157 | 27 | 27 | 0.37% | 0.44% | 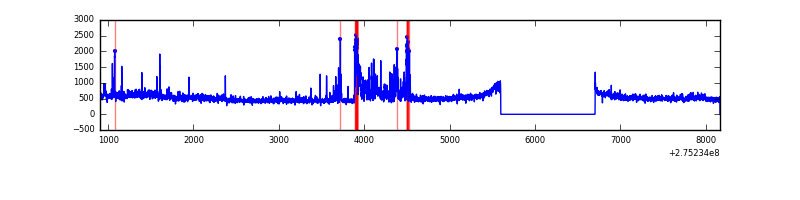 |
| B | 7262 | 6157 | 13 | 13 | 0.18% | 0.21% | 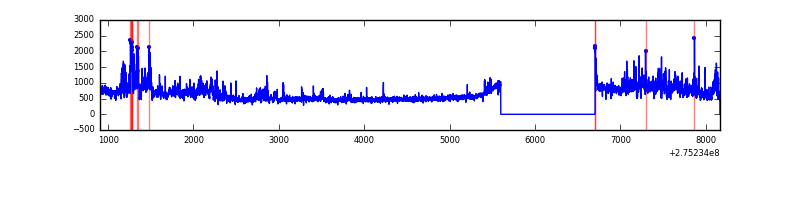 |
| C | 7262 | 6157 | 0 | 0 | 0.00% | 0.00% | 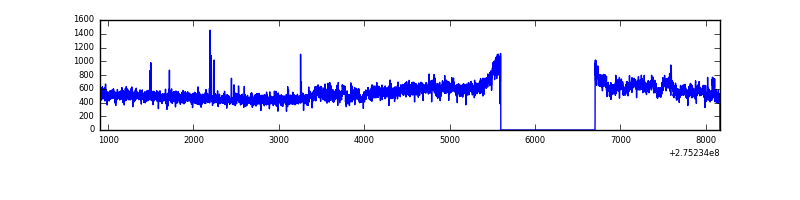 |
| D | 7262 | 6157 | 433 | 433 | 5.96% | 7.03% | 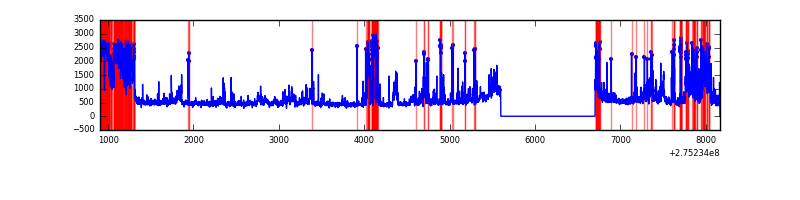 |
Top three noisy pixels from each quadrant. If the there are fewer than three noisy pixels in the level2.evt file, extra rows are filled as -1
| Pixel properties | Quadrant properties | ||||||
|---|---|---|---|---|---|---|---|
| Quadrant | DetID | PixID | Counts | Sigma | Mean | Median | Sigma |
| A | 15 | 174 | 330131 | 2116.44 | 765 | 749 | 155.6 |
| A | 0 | 253 | 135159 | 863.65 | 765 | 749 | 155.6 |
| A | 8 | 247 | 52932 | 335.3 | 765 | 749 | 155.6 |
| B | 5 | 65 | 612697 | 4185.41 | 763 | 745 | 146.2 |
| B | 7 | 220 | 145471 | 989.85 | 763 | 745 | 146.2 |
| B | 0 | 189 | 130333 | 886.31 | 763 | 745 | 146.2 |
| C | 3 | 9 | 324073 | 1880.52 | 732 | 738 | 171.9 |
| C | 14 | 238 | 112439 | 649.65 | 732 | 738 | 171.9 |
| C | 3 | 233 | 22987 | 129.4 | 732 | 738 | 171.9 |
| D | 1 | 52 | 1568172 | 8822.75 | 728 | 708 | 177.7 |
| D | 13 | 112 | 150938 | 845.6 | 728 | 708 | 177.7 |
| D | 7 | 38 | 100678 | 562.7 | 728 | 708 | 177.7 |
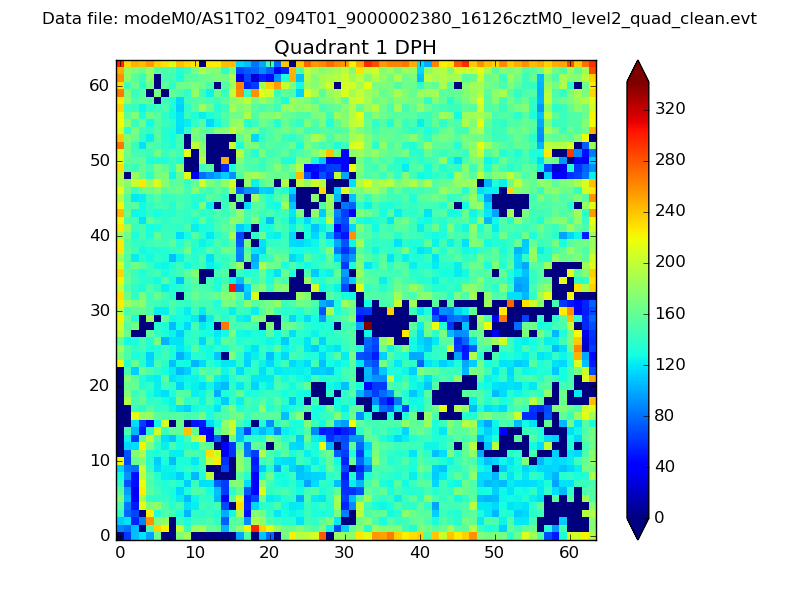
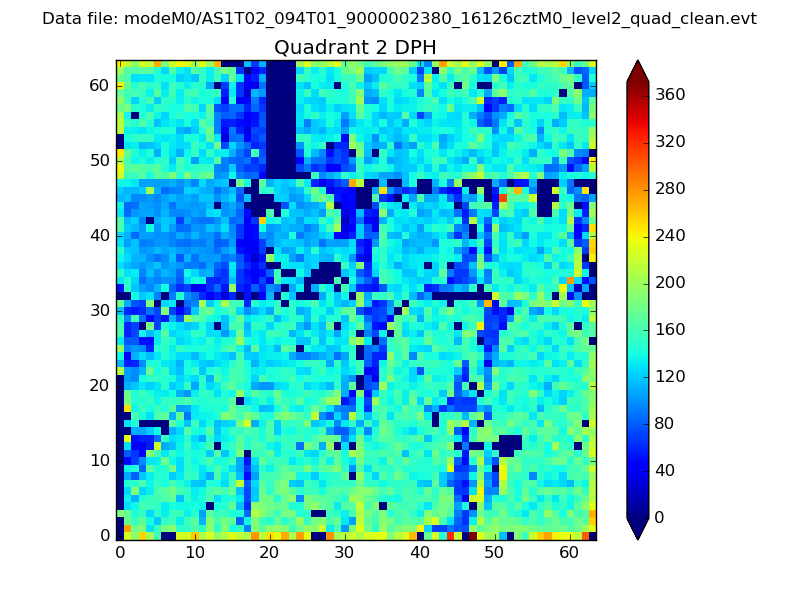
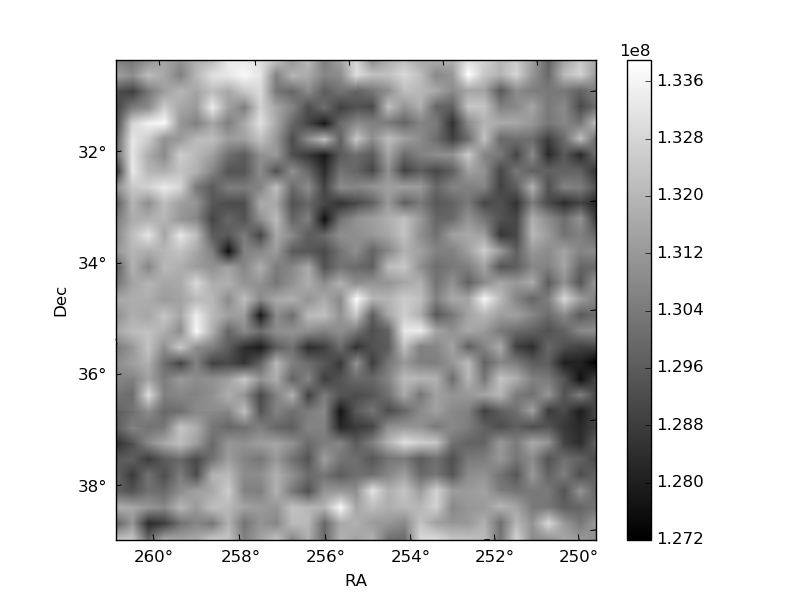
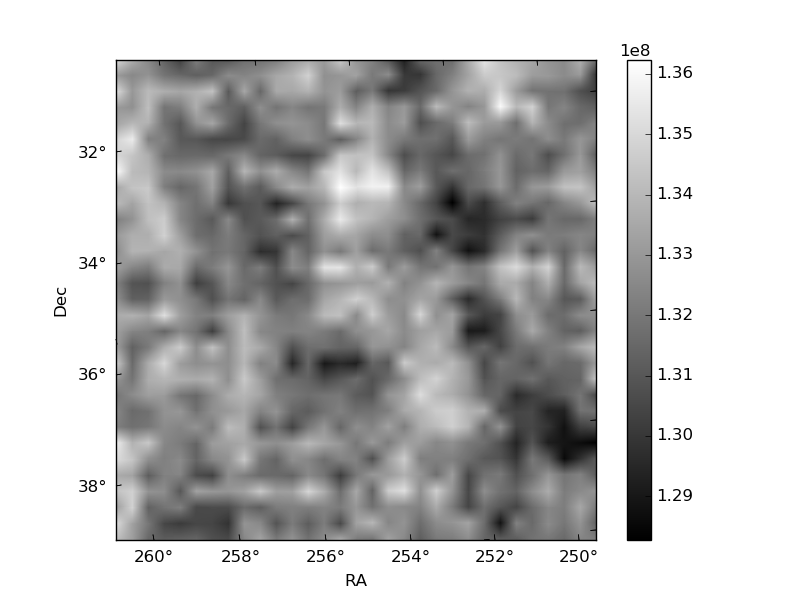
Histogram calculated using DETX and DETY for each event in the final _common_clean file
| Quadrant A |  |
 |
Quadrant B |
|---|---|---|---|
| Quadrant D |  |
 |
Quadrant C |
| Plot type | Count rate plots | Images |
|---|---|---|
| Comparison with Poisson distribution Blue bars denote a histogram of data divided into 1 sec bins. Red curve is a Poisson curve with rate = median count rate of data. |
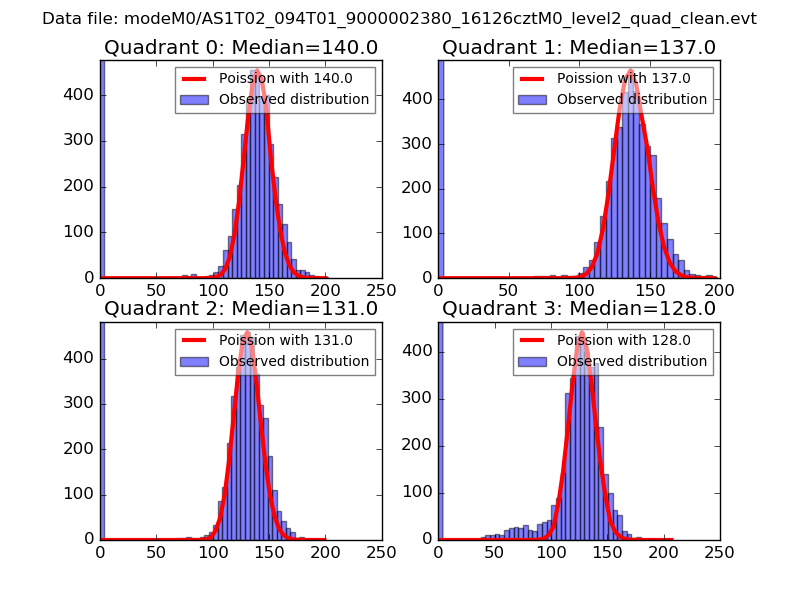 |
 |
| Quadrant-wise count rates Data is divided into 100 sec bins |
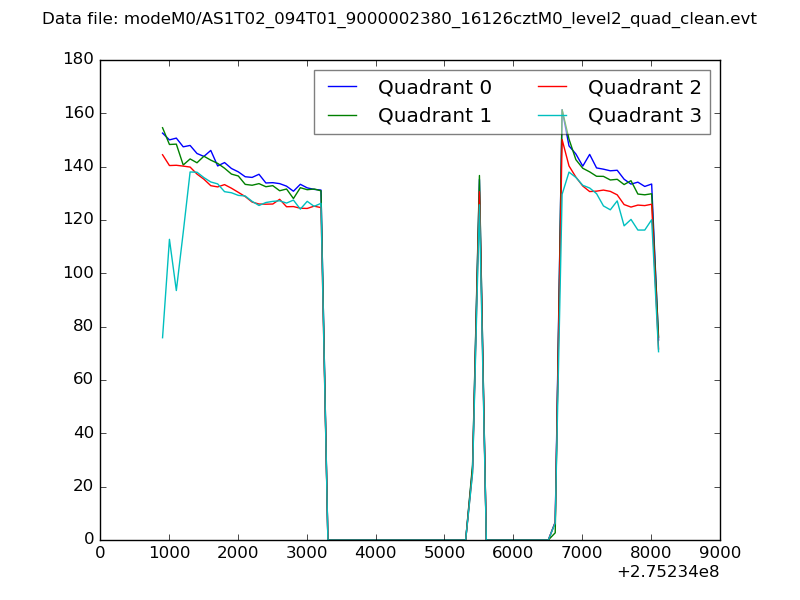 |
|
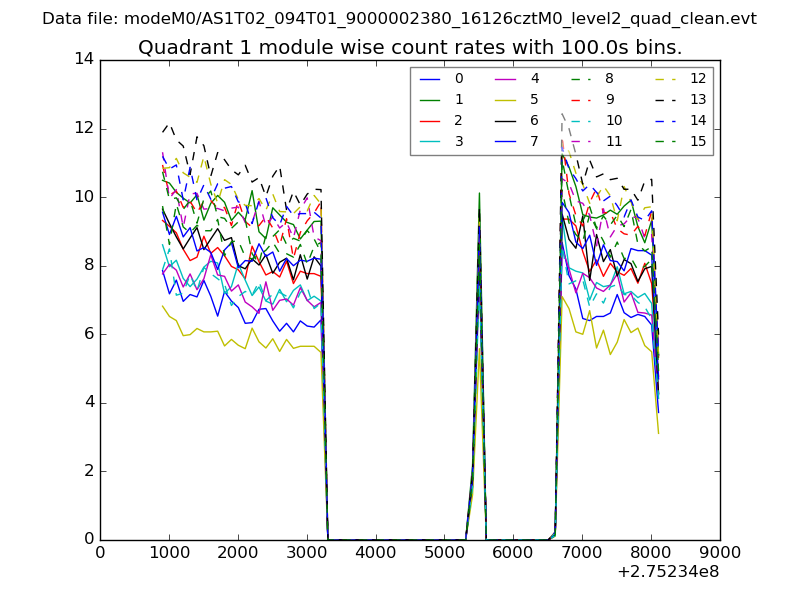
| Module-wise count rates for Quadrant A Data is divided into 100 sec bins |
 |
 |
| Module-wise count rates for Quadrant B Data is divided into 100 sec bins |
 |
 |
| Module-wise count rates for Quadrant C Data is divided into 100 sec bins |
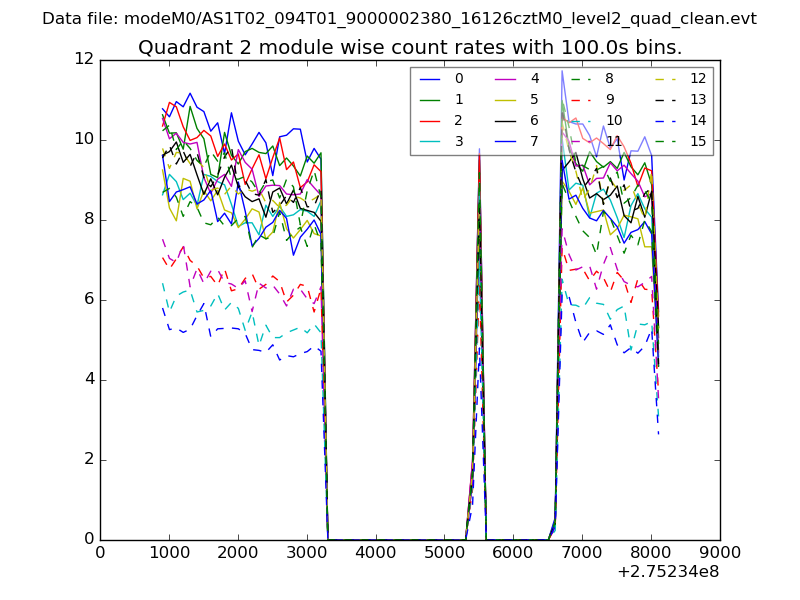 |
 |
| Module-wise count rates for Quadrant D Data is divided into 100 sec bins |
 |
 |
| Parameter | Plot |
|---|---|
| CZT HV Monitor |  |
| D_VDD | 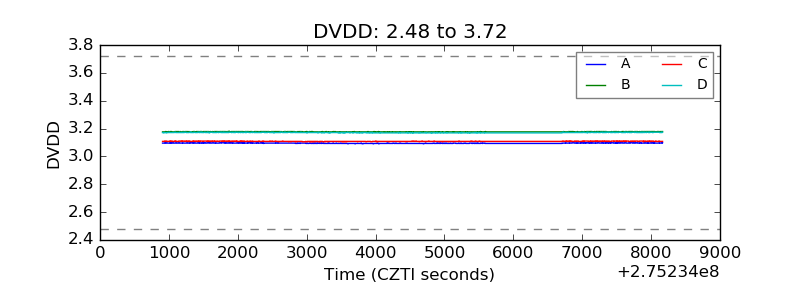 |
| Temperature 1 | 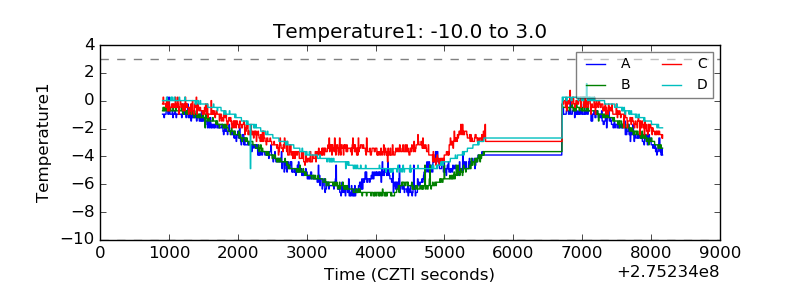 |
| Veto HV Monitor | 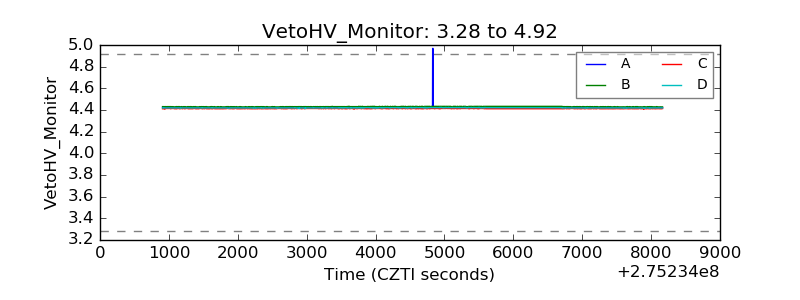 |
| Veto LLD |  |
| Alpha Counter | 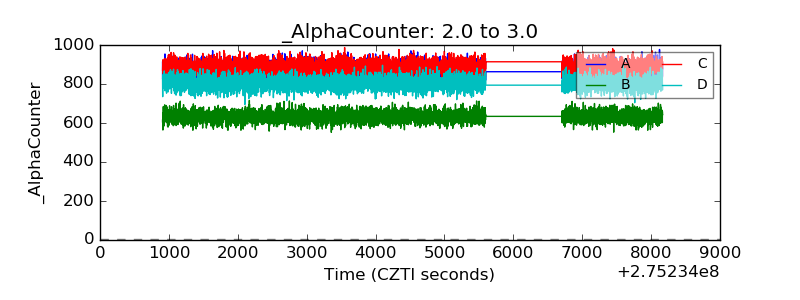 |
| _CPM_Rate | 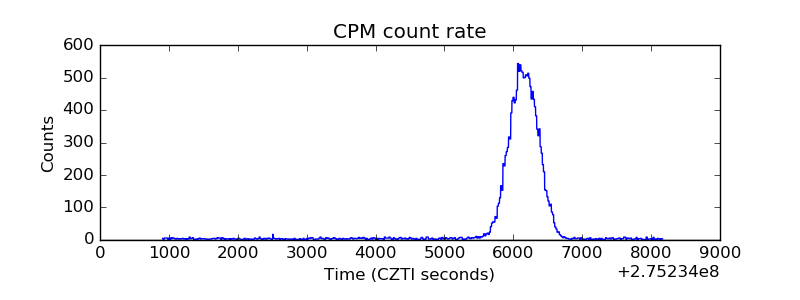 |
| CZT Counter | 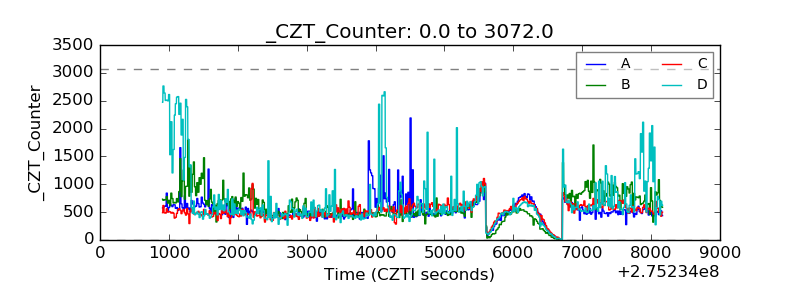 |
| +2.5 Volts monitor |  |
| +5 Volts monitor |  |
| _ROLL_ROT | 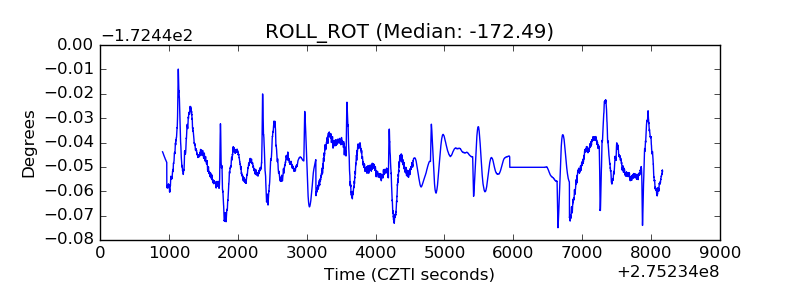 |
| _Roll_DEC | 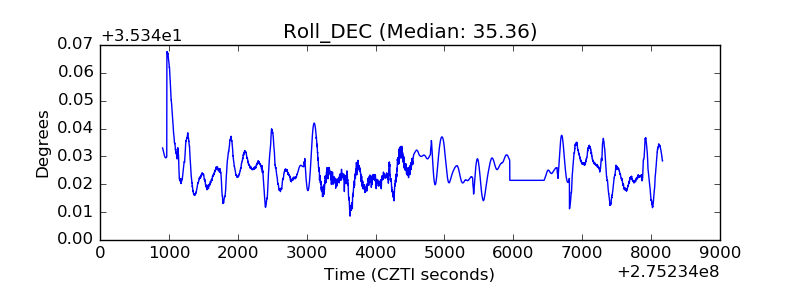 |
| _Roll_RA | 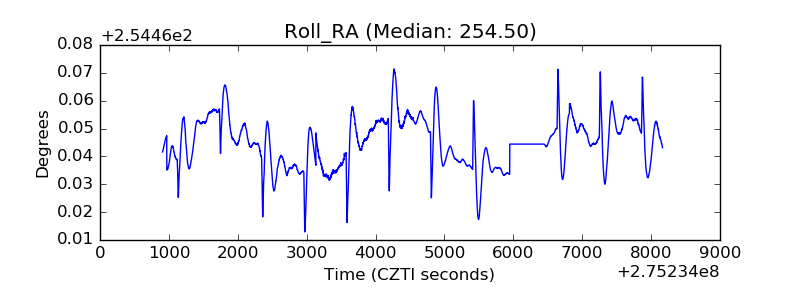 |
| Veto Counter | 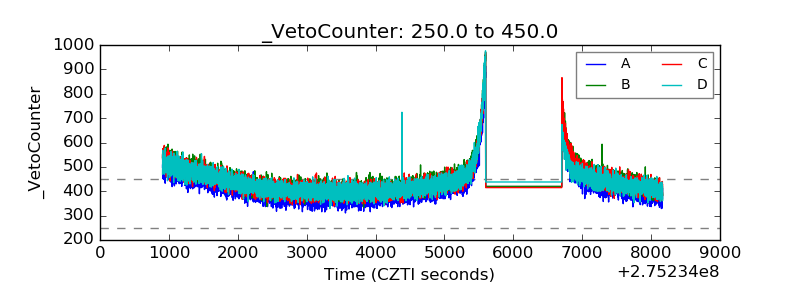 |