| Param | Original file | Final file |
|---|---|---|
| Filename | modeM0/AS1T02_094T01_9000002380_16129cztM0_level2.evt | modeM0/AS1T02_094T01_9000002380_16129cztM0_level2_quad_clean.evt |
| Size (bytes) | 545,572,800 | 98,815,680 |
| Size | 520.3 MB | 94.2 MB |
| Events in quadrant A | 3,845,863 | 646,781 |
| Events in quadrant B | 5,118,981 | 628,082 |
| Events in quadrant C | 3,422,481 | 612,789 |
| Events in quadrant D | 3,655,115 | 611,439 |
| Mode M0 | |||
|---|---|---|---|
| Quadrant | BADHDUFLAG | Total packets | Discarded packets |
| A | 0 | 16150 | 2 |
| B | 0 | 19922 | 2 |
| C | 0 | 14751 | 2 |
| D | 0 | 15643 | 2 |
| Mode SS | |||
|---|---|---|---|
| Quadrant | BADHDUFLAG | Total packets | Discarded packets |
| A | 0 | 144 | 0 |
| B | 0 | 144 | 0 |
| C | 0 | 144 | 0 |
| D | 0 | 144 | 0 |
| Mode M9 | |||
|---|---|---|---|
| Quadrant | BADHDUFLAG | Total packets | Discarded packets |
| A | 0 | 4 | 0 |
| B | 0 | 4 | 0 |
| C | 0 | 4 | 0 |
| D | 0 | 5 | 0 |
| Quadrant | Total seconds | Saturated seconds | Saturation percentage |
|---|---|---|---|
| A | 7083 | 111 | 1.567133% |
| B | 7083 | 195 | 2.753071% |
| C | 7083 | 85 | 1.200056% |
| D | 7083 | 46 | 0.649442% |
Noise dominated data is calculated using 1-second bins in cleaned event files. If a bin has >2000 counts, and if more than 50% of those come from <1% of pixels, then it is considered to be noise-dominated and hence unusable.
| Quadrant | # 1 sec bins | Bins with >0 counts | Bins with >2000 counts | High rate bins dominated by noise | Noise dominated (total time) | Noise dominated (detector-on time) | Marked lightcurve |
|---|---|---|---|---|---|---|---|
| A | 7538 | 7084 | 60 | 60 | 0.80% | 0.85% | 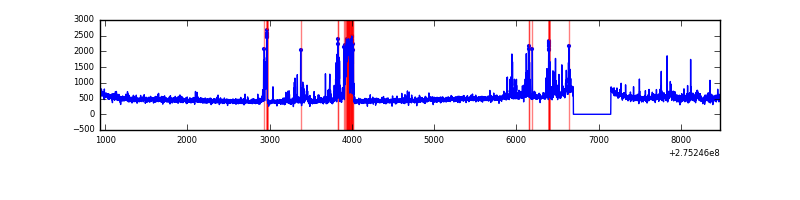 |
| B | 7539 | 7084 | 72 | 72 | 0.96% | 1.02% | 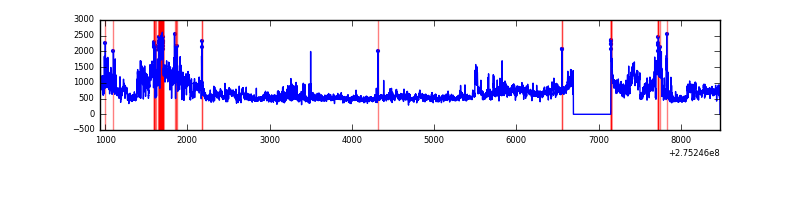 |
| C | 7539 | 7084 | 22 | 22 | 0.29% | 0.31% | 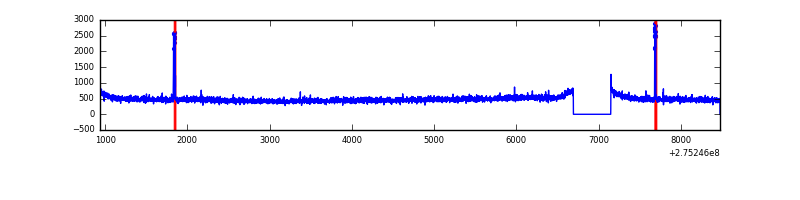 |
| D | 7539 | 7085 | 36 | 36 | 0.48% | 0.51% | 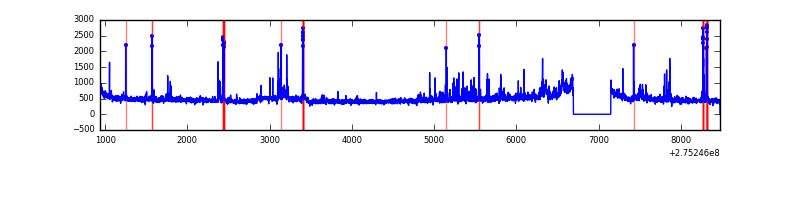 |
Top three noisy pixels from each quadrant. If the there are fewer than three noisy pixels in the level2.evt file, extra rows are filled as -1
| Pixel properties | Quadrant properties | ||||||
|---|---|---|---|---|---|---|---|
| Quadrant | DetID | PixID | Counts | Sigma | Mean | Median | Sigma |
| A | 15 | 174 | 446277 | 2614.4 | 847 | 829 | 170.4 |
| A | 0 | 253 | 103476 | 602.45 | 847 | 829 | 170.4 |
| A | 9 | 143 | 21578 | 121.78 | 847 | 829 | 170.4 |
| B | 5 | 65 | 1261266 | 7888.0 | 841 | 820 | 159.8 |
| B | 7 | 220 | 228168 | 1422.77 | 841 | 820 | 159.8 |
| B | 0 | 189 | 122136 | 759.21 | 841 | 820 | 159.8 |
| C | 14 | 238 | 122441 | 633.82 | 813 | 818 | 191.9 |
| C | 0 | 207 | 72281 | 372.42 | 813 | 818 | 191.9 |
| C | 3 | 233 | 24098 | 121.32 | 813 | 818 | 191.9 |
| D | 1 | 52 | 208211 | 1016.7 | 830 | 807 | 204.0 |
| D | 12 | 221 | 157888 | 770.02 | 830 | 807 | 204.0 |
| D | 15 | 0 | 59084 | 285.68 | 830 | 807 | 204.0 |
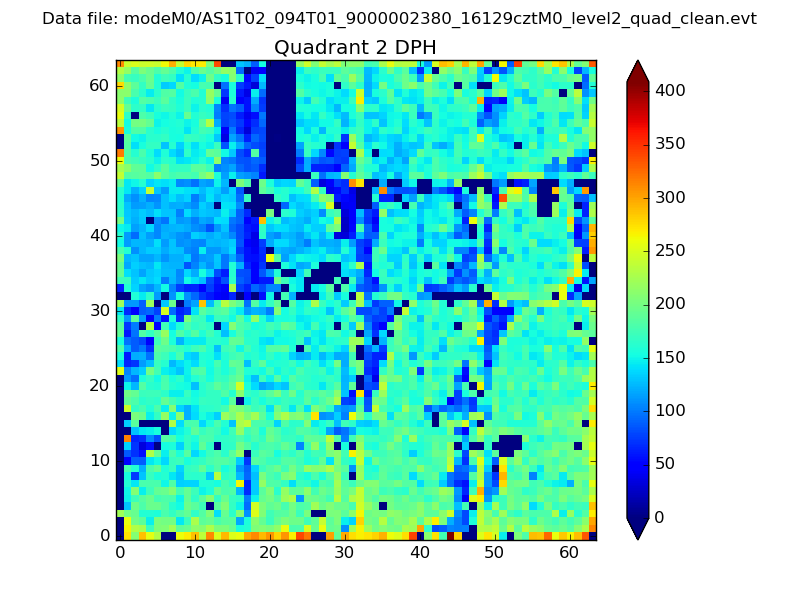
Histogram calculated using DETX and DETY for each event in the final _common_clean file
| Quadrant A | 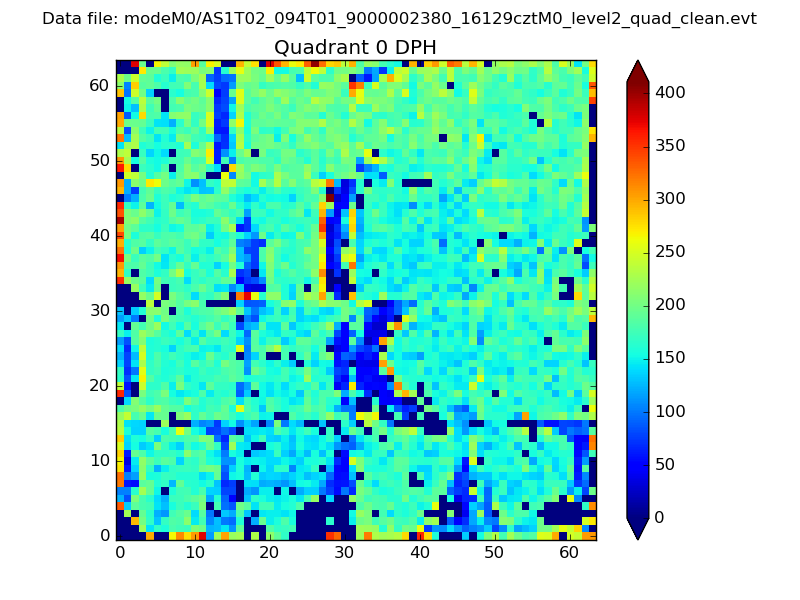 |
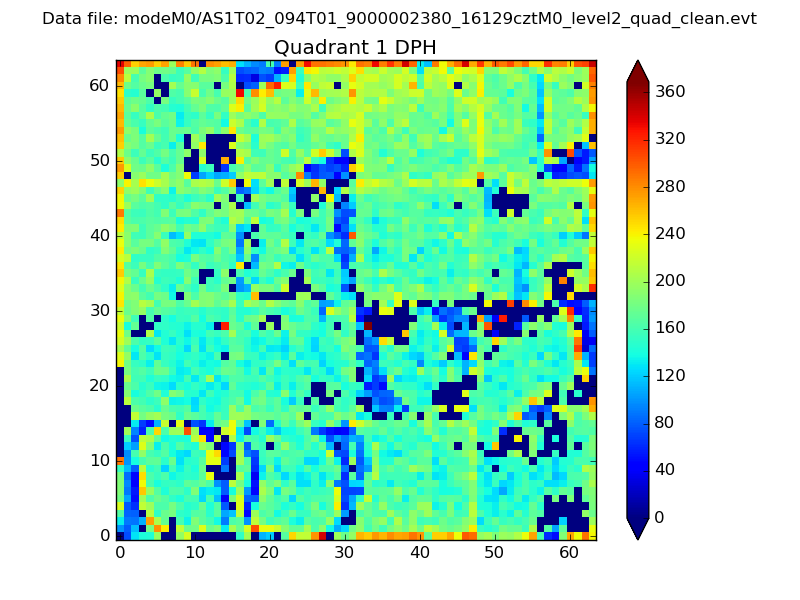 |
Quadrant B |
|---|---|---|---|
| Quadrant D | 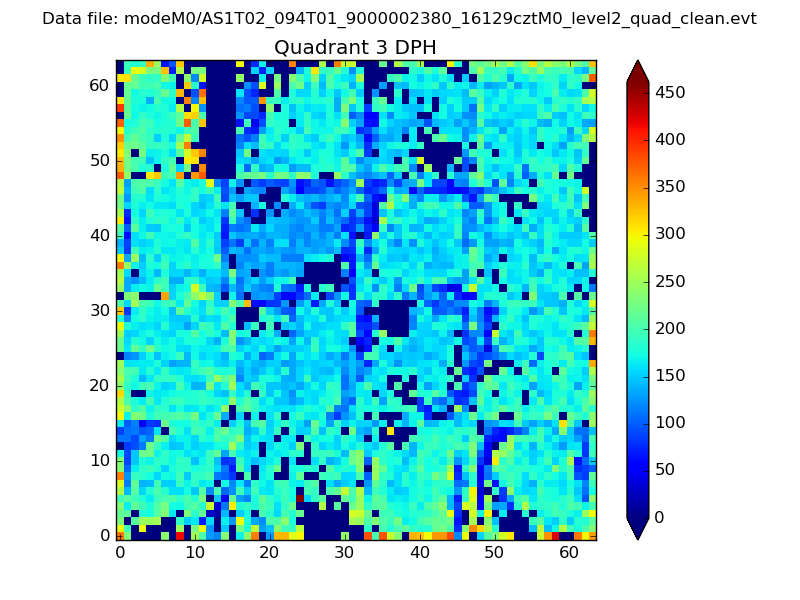 |
 |
Quadrant C |
| Plot type | Count rate plots | Images |
|---|---|---|
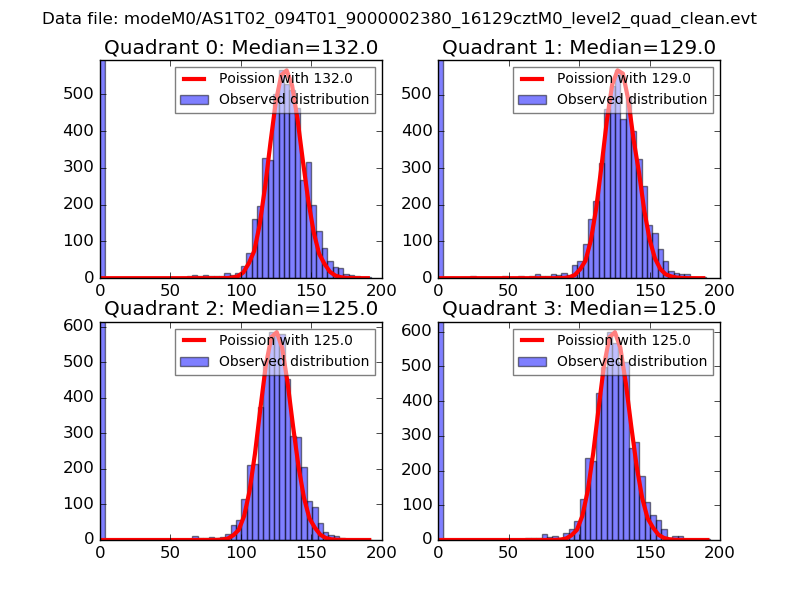
| Comparison with Poisson distribution Blue bars denote a histogram of data divided into 1 sec bins. Red curve is a Poisson curve with rate = median count rate of data. |
 |
 |
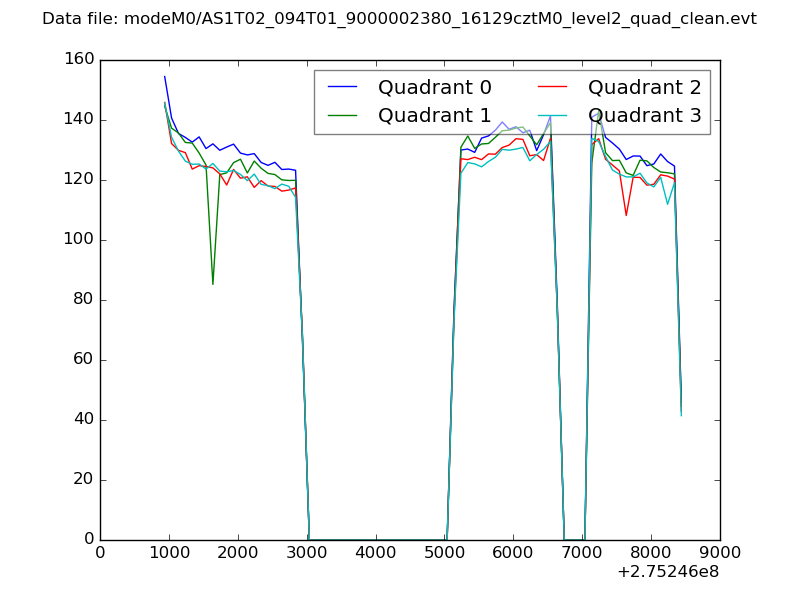
| Quadrant-wise count rates Data is divided into 100 sec bins |
 |
|
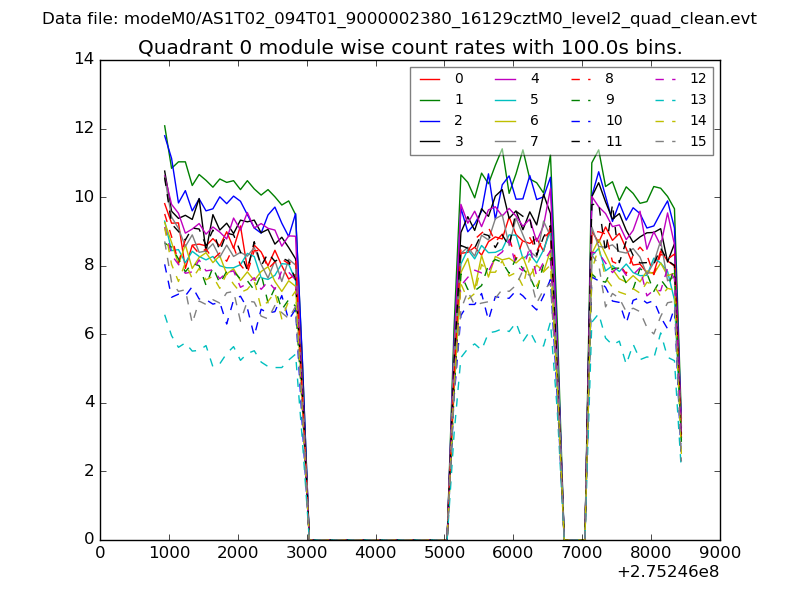
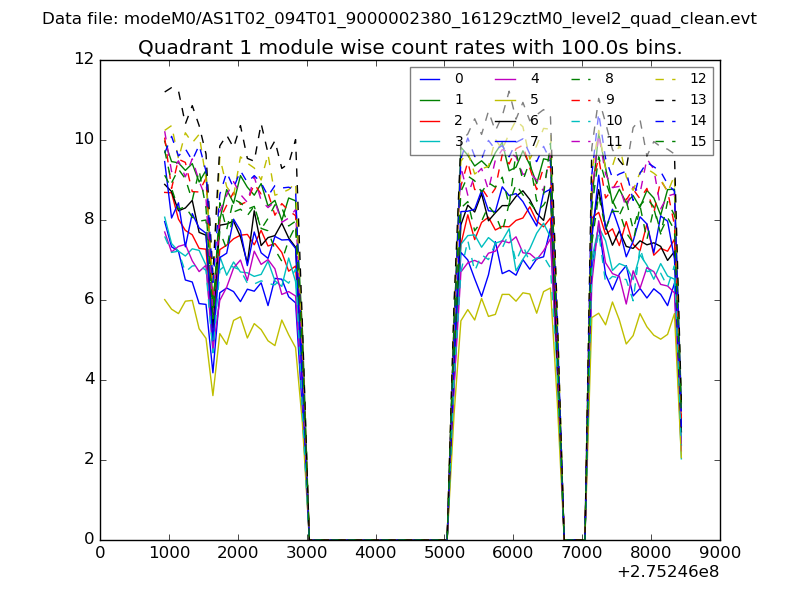
| Module-wise count rates for Quadrant A Data is divided into 100 sec bins |
 |
 |
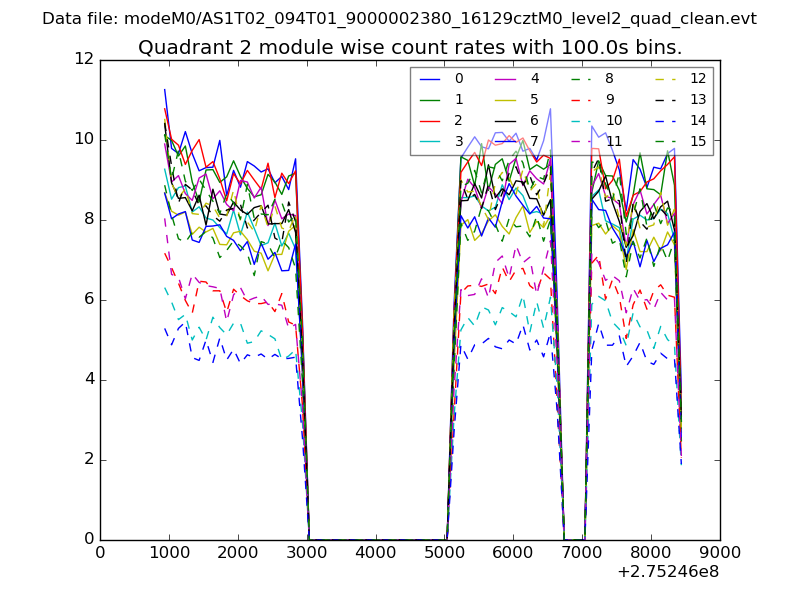
| Module-wise count rates for Quadrant B Data is divided into 100 sec bins |
 |
 |
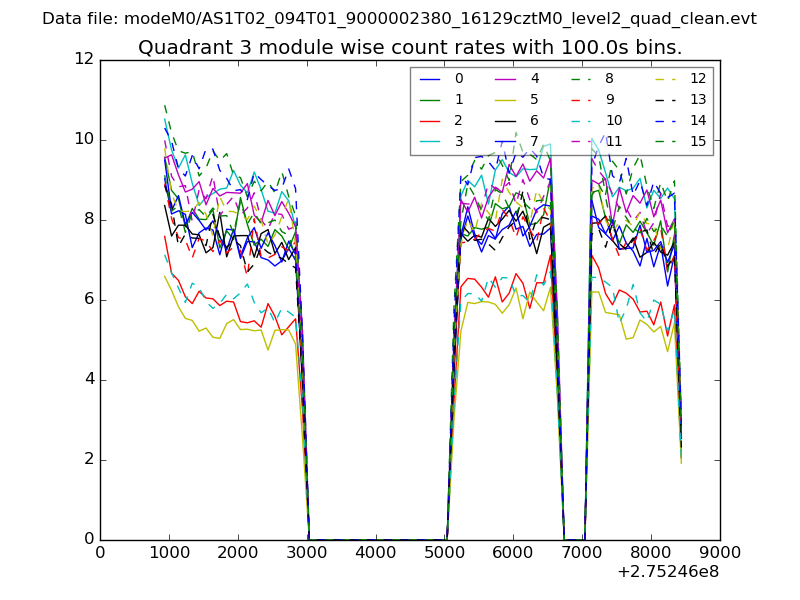
| Module-wise count rates for Quadrant C Data is divided into 100 sec bins |
 |
 |
| Module-wise count rates for Quadrant D Data is divided into 100 sec bins |
 |
 |
| Parameter | Plot |
|---|---|
| CZT HV Monitor | 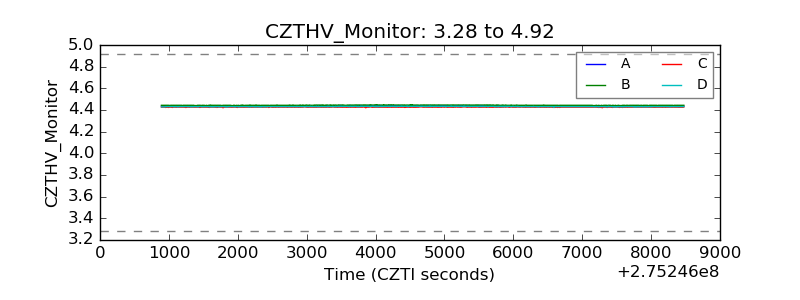 |
| D_VDD | 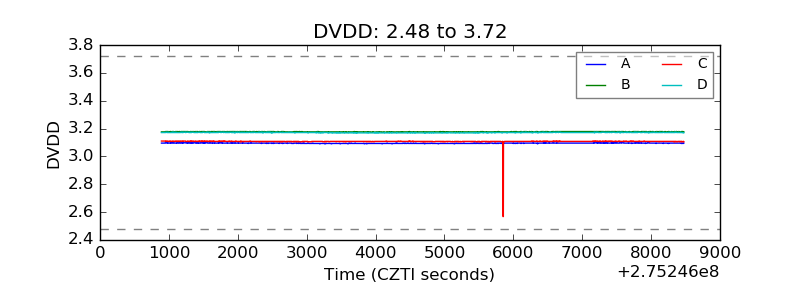 |
| Temperature 1 | 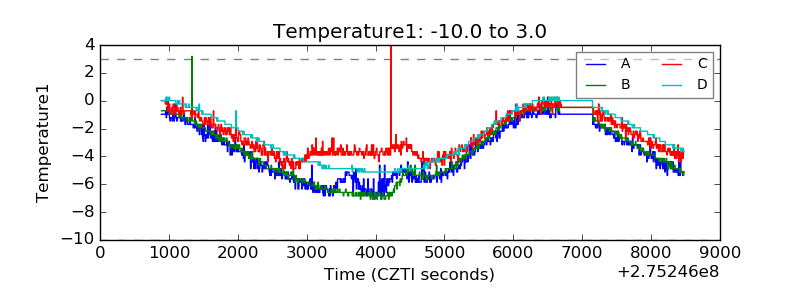 |
| Veto HV Monitor | 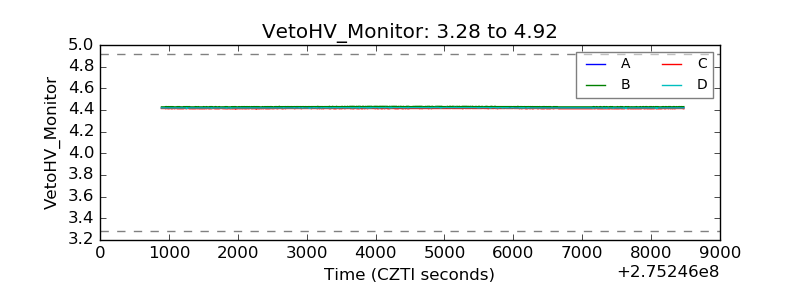 |
| Veto LLD | 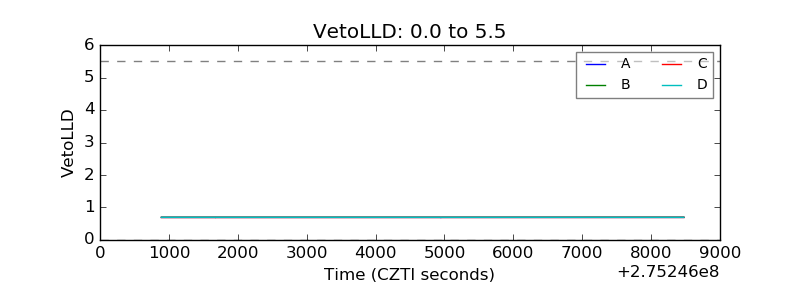 |
| Alpha Counter | 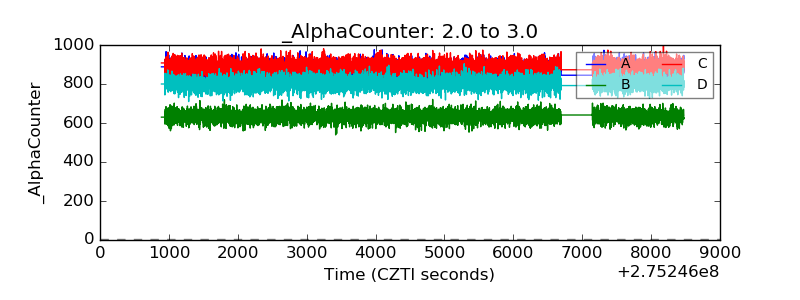 |
| _CPM_Rate | 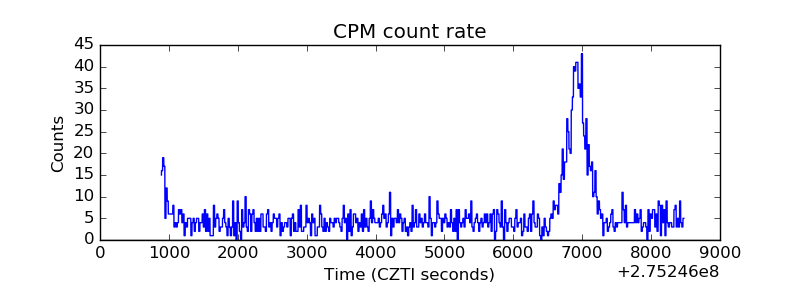 |
| CZT Counter | 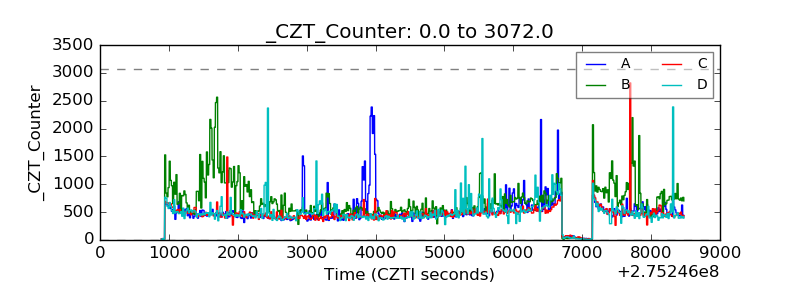 |
| +2.5 Volts monitor |  |
| +5 Volts monitor |  |
| _ROLL_ROT | 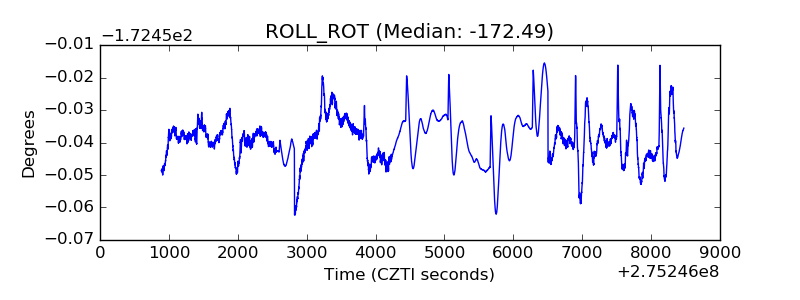 |
| _Roll_DEC | 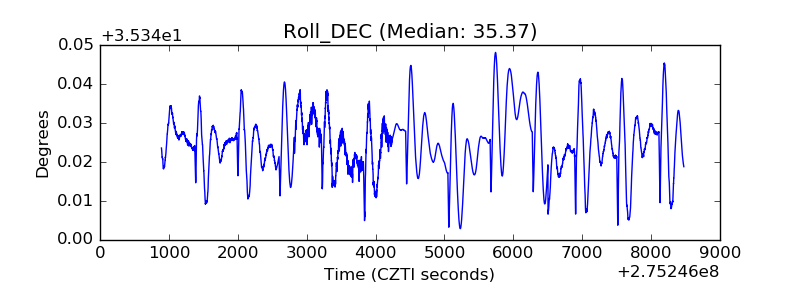 |
| _Roll_RA | 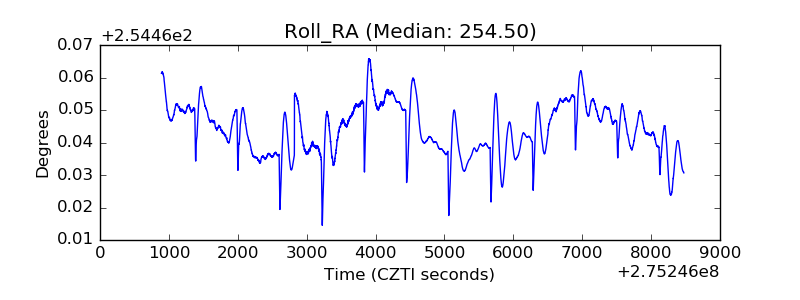 |
| Veto Counter | 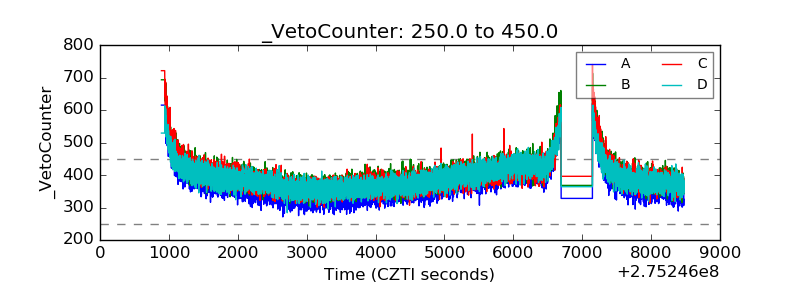 |