| Param | Original file | Final file |
|---|---|---|
| Filename | modeM0/AS1C03_015T04_9000002382_16129cztM0_level2.evt | modeM0/AS1C03_015T04_9000002382_16129cztM0_level2_quad_clean.evt |
| Size (bytes) | 367,548,480 | 97,041,600 |
| Size | 350.5 MB | 92.5 MB |
| Events in quadrant A | 2,504,242 | 651,378 |
| Events in quadrant B | 3,108,334 | 654,860 |
| Events in quadrant C | 2,480,231 | 635,369 |
| Events in quadrant D | 2,672,002 | 620,707 |
| Mode M0 | |||
|---|---|---|---|
| Quadrant | BADHDUFLAG | Total packets | Discarded packets |
| A | 0 | 11254 | 2 |
| B | 0 | 12899 | 1 |
| C | 0 | 11072 | 1 |
| D | 0 | 12003 | 1 |
| Mode M9 | |||
|---|---|---|---|
| Quadrant | BADHDUFLAG | Total packets | Discarded packets |
| A | 0 | 4 | 0 |
| B | 0 | 4 | 0 |
| C | 0 | 4 | 0 |
| D | 0 | 4 | 0 |
| Mode SS | |||
|---|---|---|---|
| Quadrant | BADHDUFLAG | Total packets | Discarded packets |
| A | 0 | 108 | 0 |
| B | 0 | 108 | 0 |
| C | 0 | 108 | 0 |
| D | 0 | 108 | 0 |
| Quadrant | Total seconds | Saturated seconds | Saturation percentage |
|---|---|---|---|
| A | 5385 | 14 | 0.259981% |
| B | 5385 | 93 | 1.727019% |
| C | 5385 | 35 | 0.649954% |
| D | 5385 | 144 | 2.674095% |
Noise dominated data is calculated using 1-second bins in cleaned event files. If a bin has >2000 counts, and if more than 50% of those come from <1% of pixels, then it is considered to be noise-dominated and hence unusable.
| Quadrant | # 1 sec bins | Bins with >0 counts | Bins with >2000 counts | High rate bins dominated by noise | Noise dominated (total time) | Noise dominated (detector-on time) | Marked lightcurve |
|---|---|---|---|---|---|---|---|
| A | 5776 | 5386 | 3 | 3 | 0.05% | 0.06% | 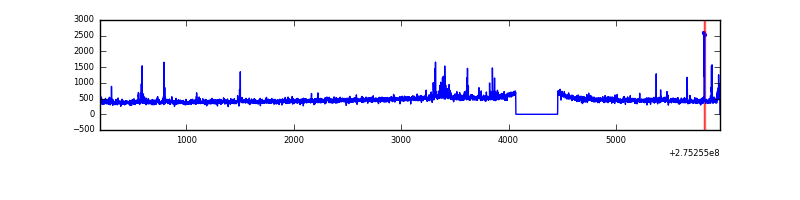 |
| B | 5776 | 5386 | 13 | 13 | 0.23% | 0.24% | 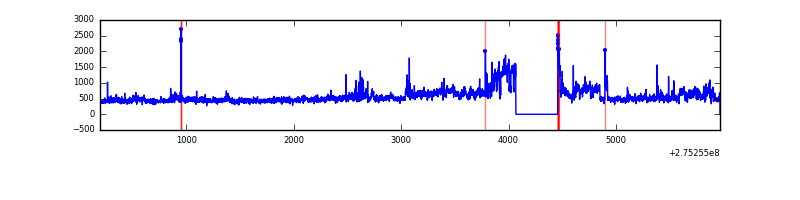 |
| C | 5775 | 5386 | 0 | 0 | 0.00% | 0.00% | 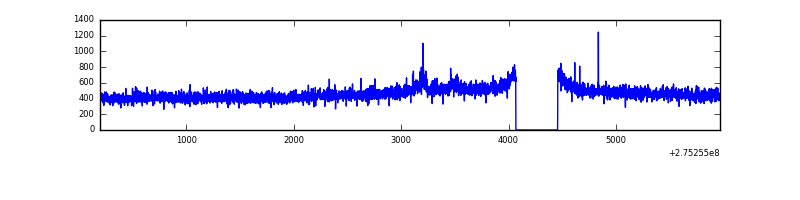 |
| D | 5775 | 5385 | 111 | 111 | 1.92% | 2.06% | 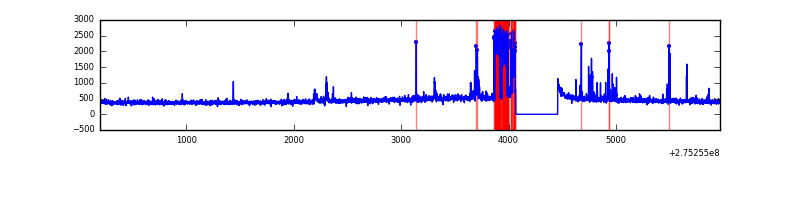 |
Top three noisy pixels from each quadrant. If the there are fewer than three noisy pixels in the level2.evt file, extra rows are filled as -1
| Pixel properties | Quadrant properties | ||||||
|---|---|---|---|---|---|---|---|
| Quadrant | DetID | PixID | Counts | Sigma | Mean | Median | Sigma |
| A | 15 | 174 | 93062 | 727.47 | 620 | 604 | 127.1 |
| A | 8 | 247 | 14901 | 112.49 | 620 | 604 | 127.1 |
| A | 9 | 143 | 10922 | 81.18 | 620 | 604 | 127.1 |
| B | 5 | 65 | 503570 | 4264.82 | 620 | 603 | 117.9 |
| B | 0 | 189 | 45673 | 382.16 | 620 | 603 | 117.9 |
| B | 0 | 229 | 32593 | 271.25 | 620 | 603 | 117.9 |
| C | 14 | 238 | 91081 | 647.69 | 596 | 597 | 139.7 |
| C | 3 | 233 | 29739 | 208.6 | 596 | 597 | 139.7 |
| C | 3 | 9 | 21828 | 151.97 | 596 | 597 | 139.7 |
| D | 1 | 52 | 339391 | 2347.11 | 594 | 575 | 144.4 |
| D | 10 | 70 | 61597 | 422.72 | 594 | 575 | 144.4 |
| D | 2 | 234 | 24625 | 166.6 | 594 | 575 | 144.4 |
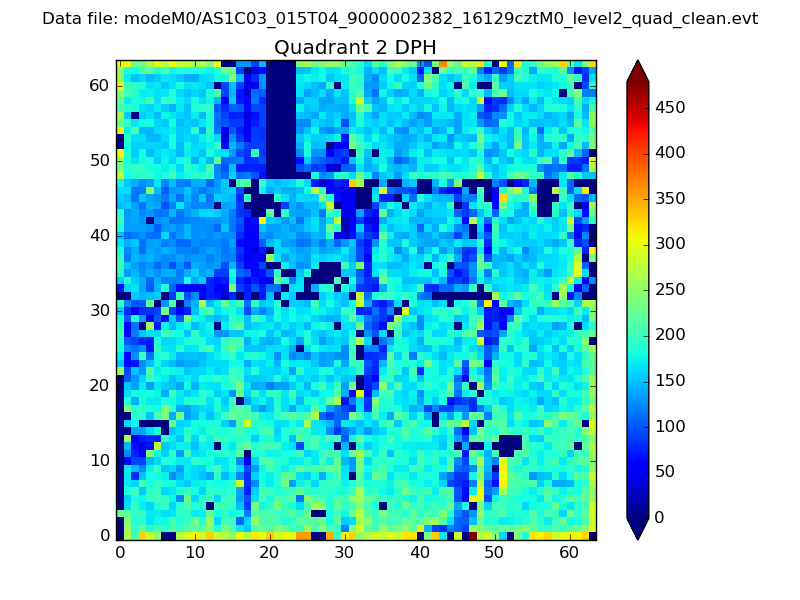
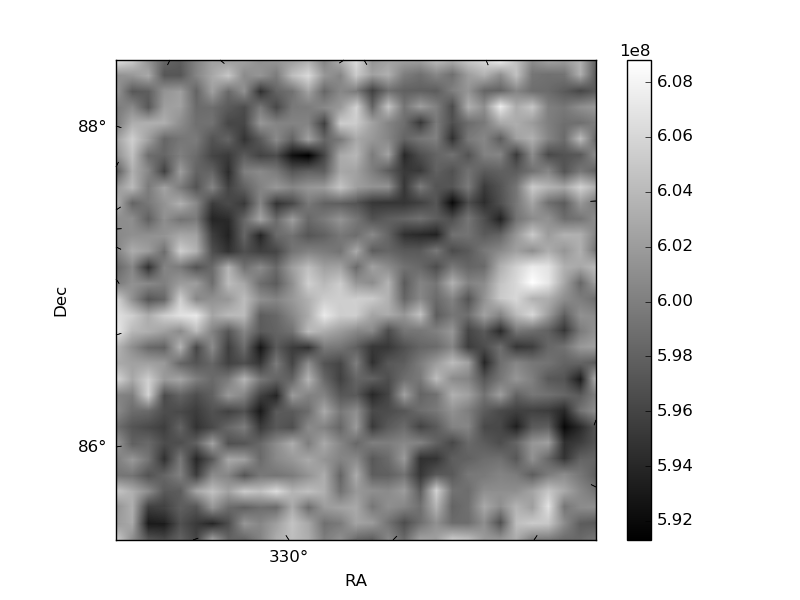
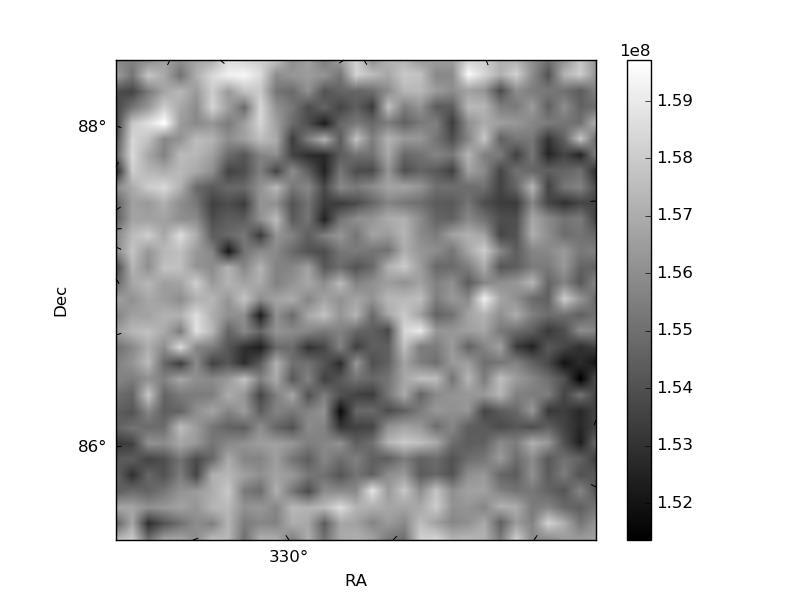
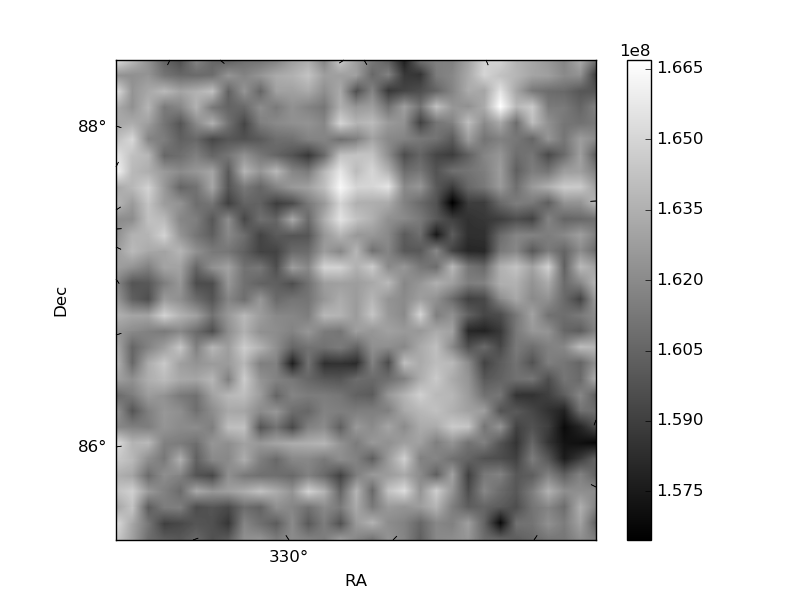
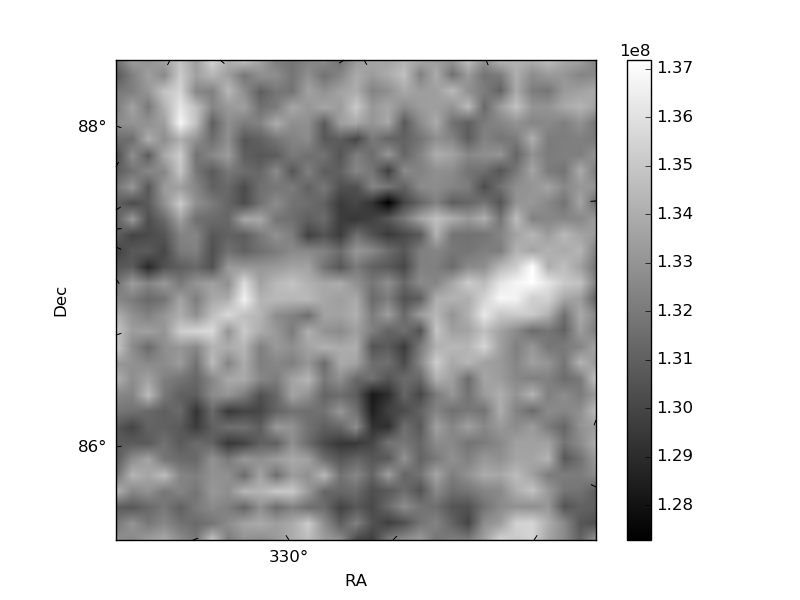
Histogram calculated using DETX and DETY for each event in the final _common_clean file
| Quadrant A | 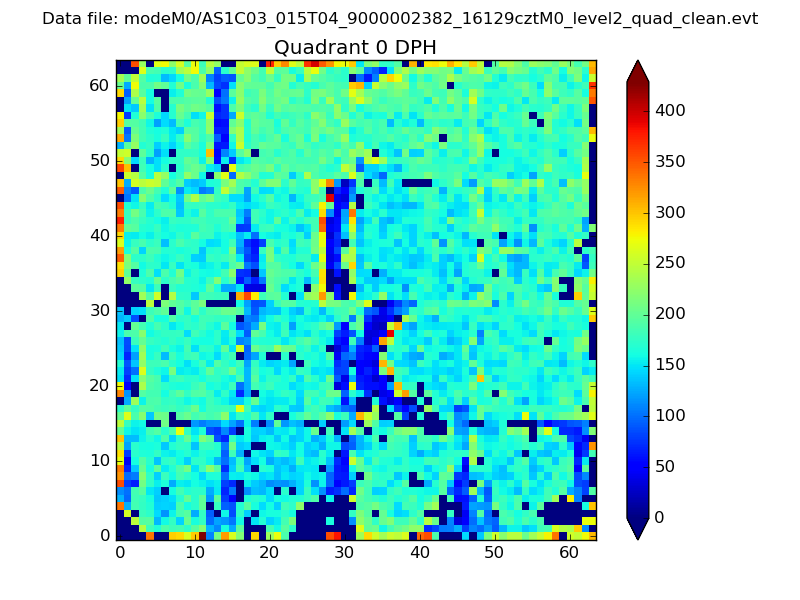 |
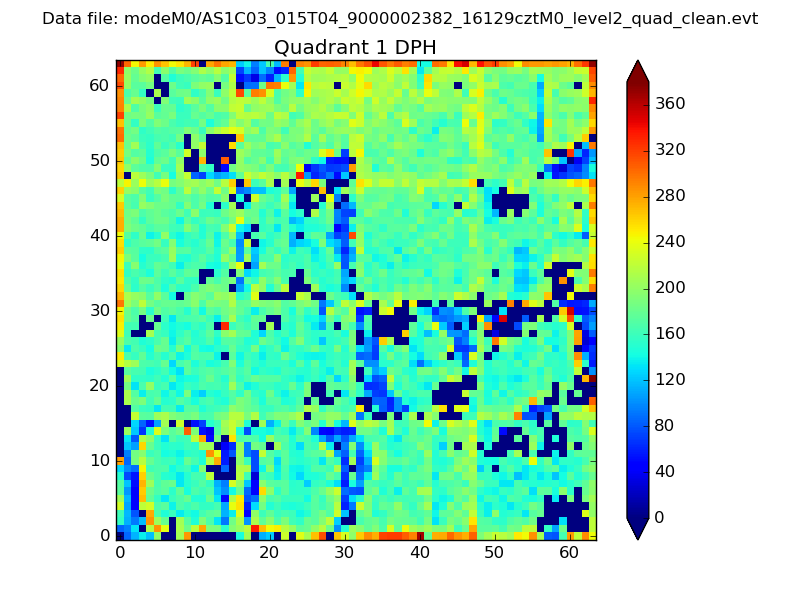 |
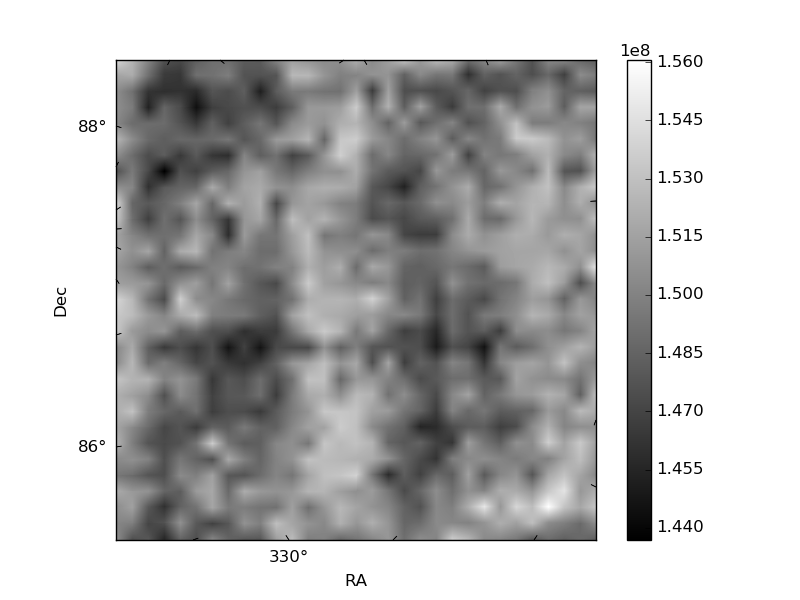
Quadrant B |
|---|---|---|---|
| Quadrant D | 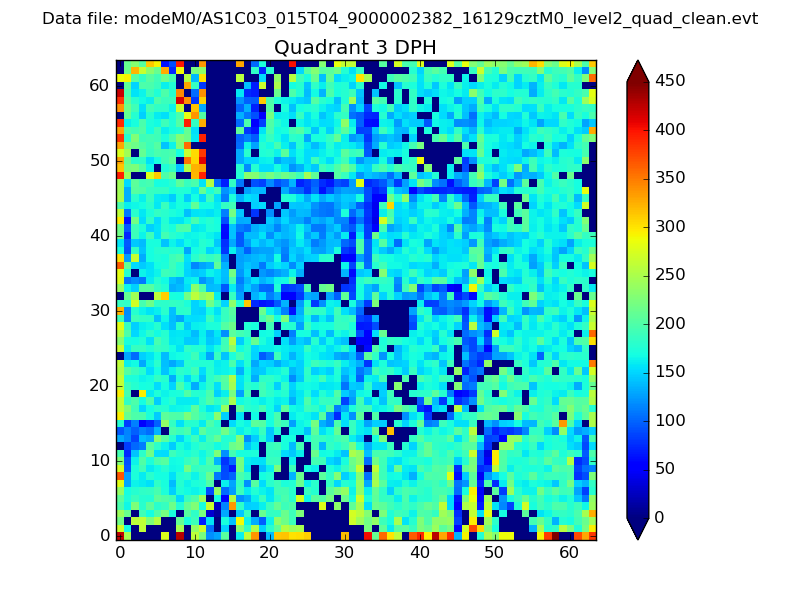 |
 |
Quadrant C |
| Plot type | Count rate plots | Images |
|---|---|---|
| Comparison with Poisson distribution Blue bars denote a histogram of data divided into 1 sec bins. Red curve is a Poisson curve with rate = median count rate of data. |
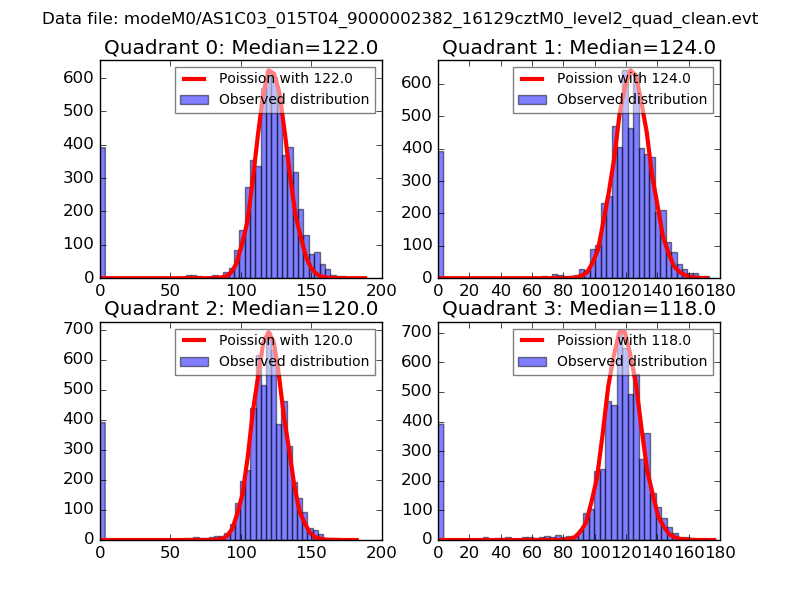 |
 |
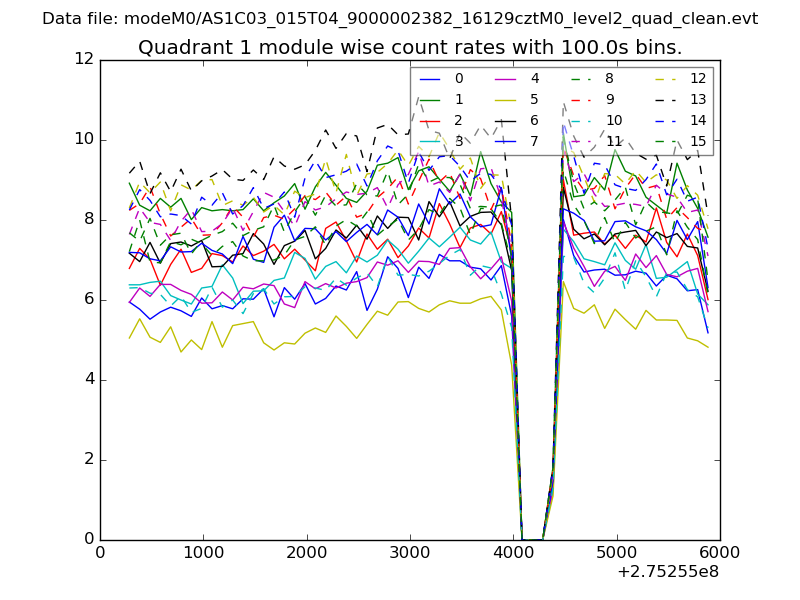
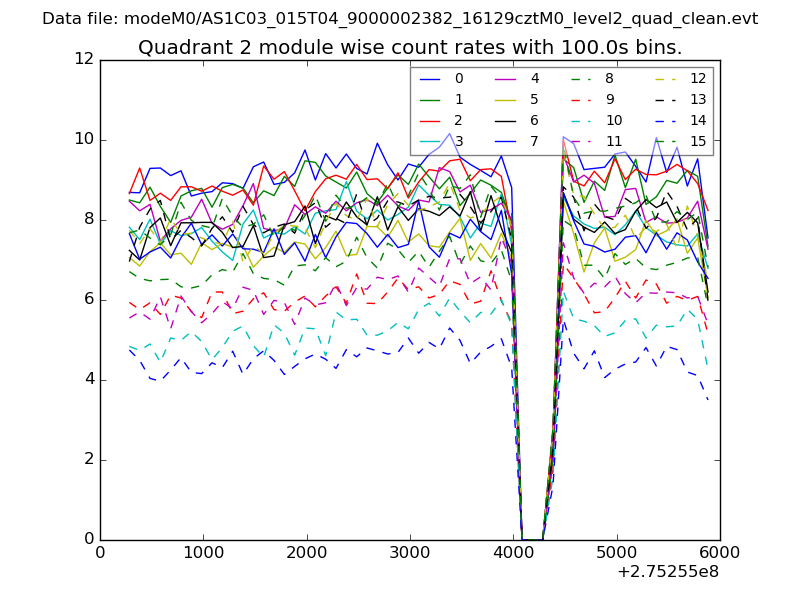
| Quadrant-wise count rates Data is divided into 100 sec bins |
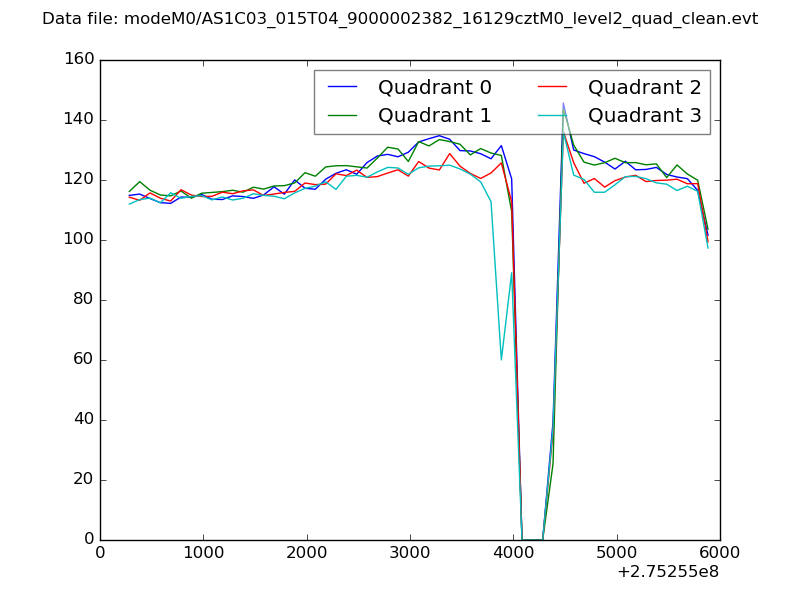 |
|
| Module-wise count rates for Quadrant A Data is divided into 100 sec bins |
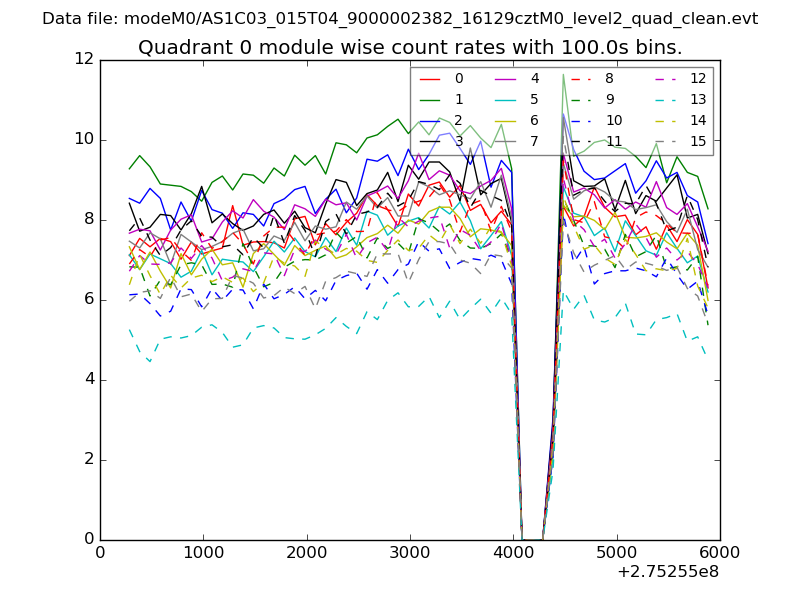 |
 |
| Module-wise count rates for Quadrant B Data is divided into 100 sec bins |
 |
 |
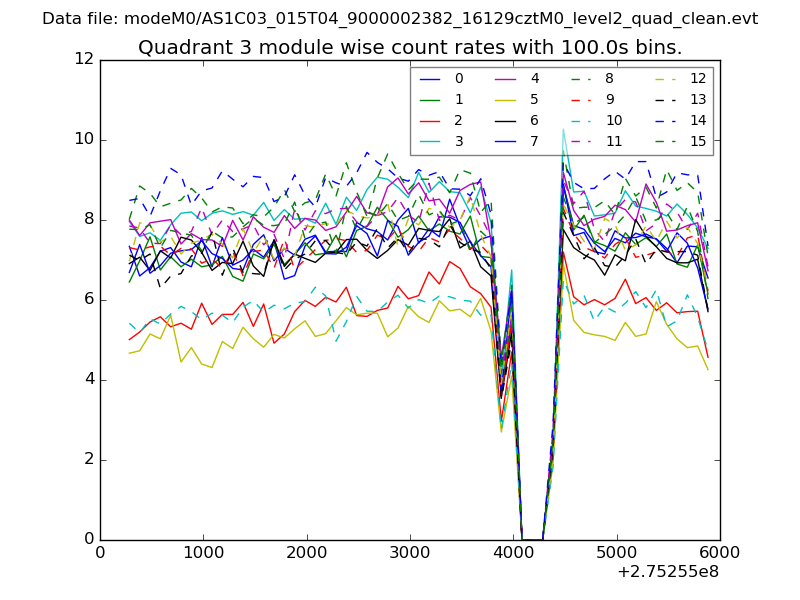
| Module-wise count rates for Quadrant C Data is divided into 100 sec bins |
 |
 |
| Module-wise count rates for Quadrant D Data is divided into 100 sec bins |
 |
 |
| Parameter | Plot |
|---|---|
| CZT HV Monitor | 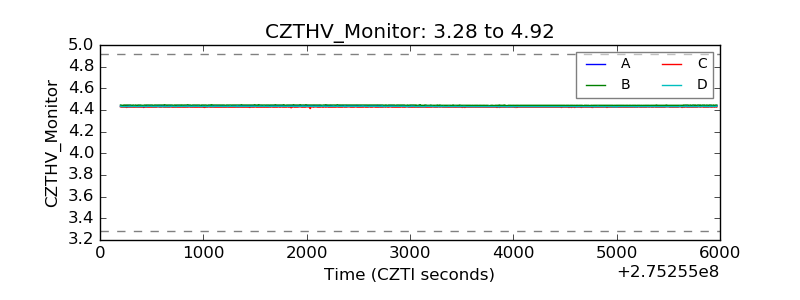 |
| D_VDD | 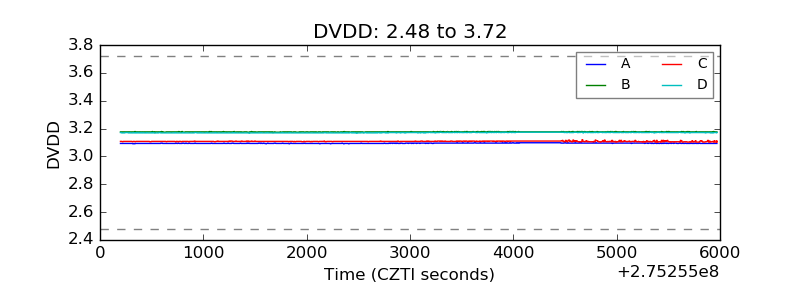 |
| Temperature 1 | 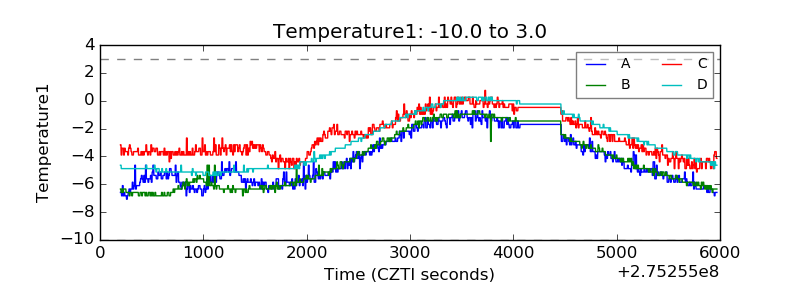 |
| Veto HV Monitor | 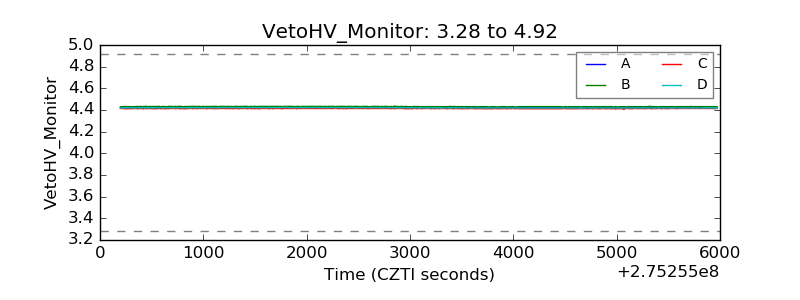 |
| Veto LLD | 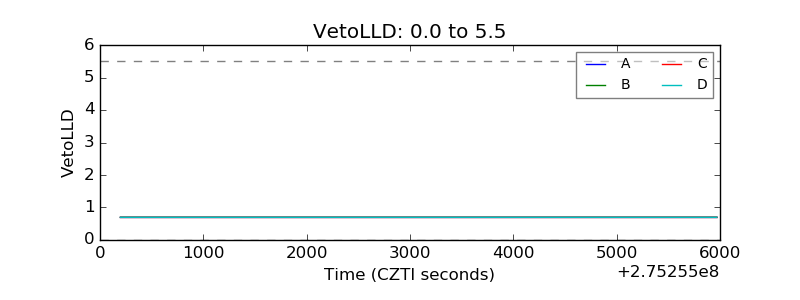 |
| Alpha Counter | 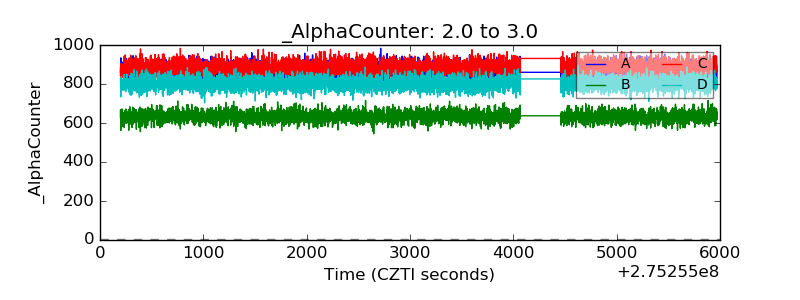 |
| _CPM_Rate | 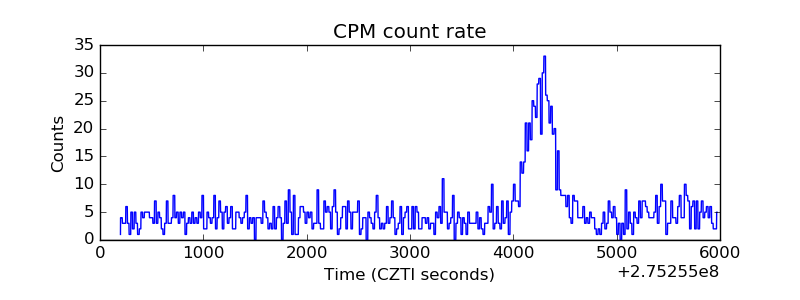 |
| CZT Counter | 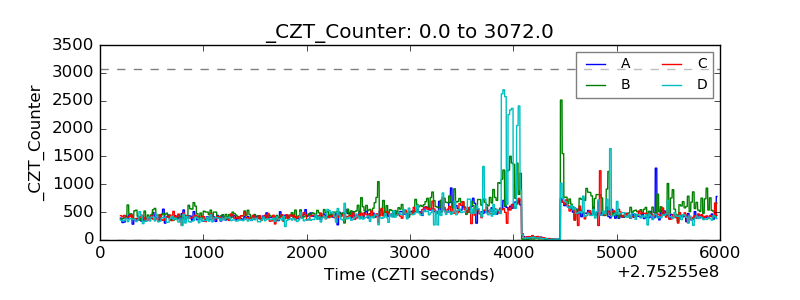 |
| +2.5 Volts monitor |  |
| +5 Volts monitor |  |
| _ROLL_ROT | 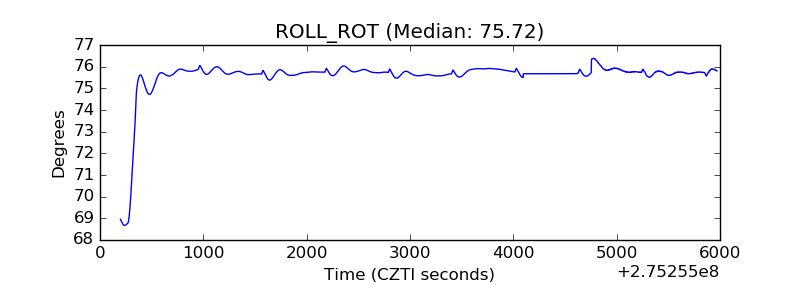 |
| _Roll_DEC | 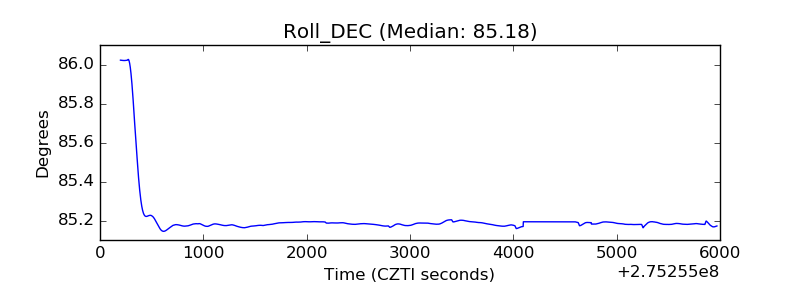 |
| _Roll_RA | 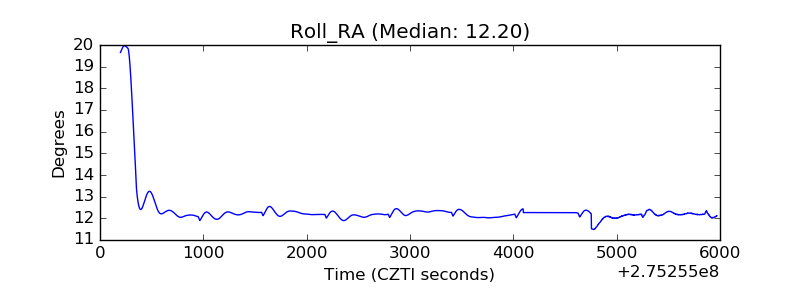 |
| Veto Counter | 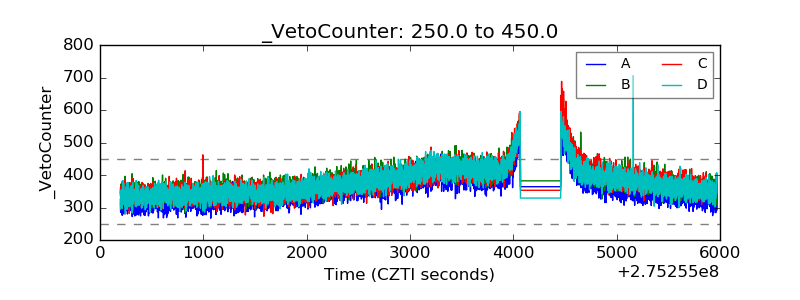 |