| Param | Original file | Final file |
|---|---|---|
| Filename | modeM0/AS1C03_015T04_9000002382_16132cztM0_level2.evt | modeM0/AS1C03_015T04_9000002382_16132cztM0_level2_quad_clean.evt |
| Size (bytes) | 22,556,160 | 4,708,800 |
| Size | 21.5 MB | 4.5 MB |
| Events in quadrant A | 152,540 | 29,989 |
| Events in quadrant B | 220,679 | 30,246 |
| Events in quadrant C | 132,806 | 28,675 |
| Events in quadrant D | 157,517 | 28,334 |
| Mode M0 | |||
|---|---|---|---|
| Quadrant | BADHDUFLAG | Total packets | Discarded packets |
| A | 0 | 600 | 0 |
| B | 0 | 814 | 0 |
| C | 0 | 537 | 0 |
| D | 0 | 616 | 0 |
| Mode M9 | |||
|---|---|---|---|
| Quadrant | BADHDUFLAG | Total packets | Discarded packets |
| A | 0 | 4 | 0 |
| B | 0 | 4 | 0 |
| C | 0 | 4 | 0 |
| D | 0 | 4 | 0 |
| Mode SS | |||
|---|---|---|---|
| Quadrant | BADHDUFLAG | Total packets | Discarded packets |
| A | 0 | 8 | 0 |
| B | 0 | 8 | 0 |
| C | 0 | 8 | 0 |
| D | 0 | 8 | 0 |
| Quadrant | Total seconds | Saturated seconds | Saturation percentage |
|---|---|---|---|
| A | 231 | 8 | 3.463203% |
| B | 231 | 21 | 9.090909% |
| C | 231 | 3 | 1.298701% |
| D | 231 | 4 | 1.731602% |
Noise dominated data is calculated using 1-second bins in cleaned event files. If a bin has >2000 counts, and if more than 50% of those come from <1% of pixels, then it is considered to be noise-dominated and hence unusable.
| Quadrant | # 1 sec bins | Bins with >0 counts | Bins with >2000 counts | High rate bins dominated by noise | Noise dominated (total time) | Noise dominated (detector-on time) | Marked lightcurve |
|---|---|---|---|---|---|---|---|
| A | 231 | 231 | 0 | 0 | 0.00% | 0.00% | 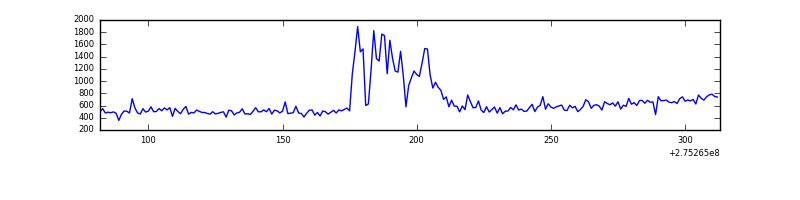 |
| B | 231 | 231 | 2 | 2 | 0.87% | 0.87% | 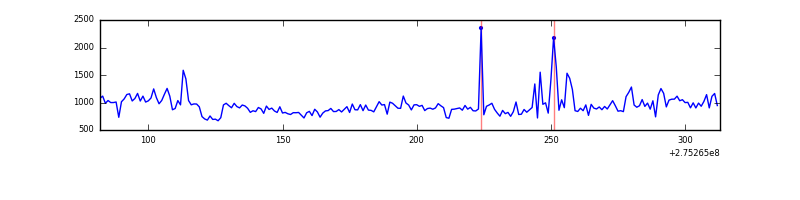 |
| C | 231 | 231 | 0 | 0 | 0.00% | 0.00% | 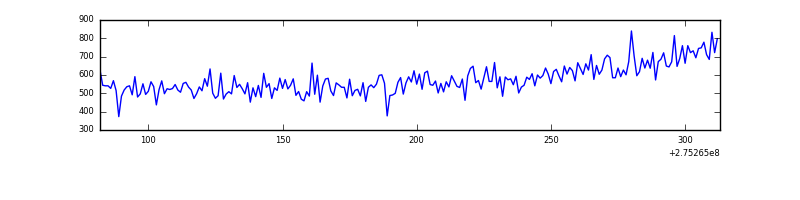 |
| D | 231 | 231 | 1 | 1 | 0.43% | 0.43% | 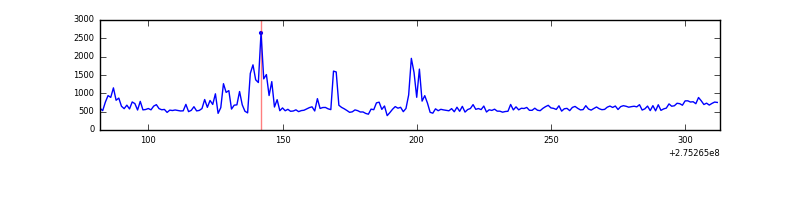 |
Top three noisy pixels from each quadrant. If the there are fewer than three noisy pixels in the level2.evt file, extra rows are filled as -1
| Pixel properties | Quadrant properties | ||||||
|---|---|---|---|---|---|---|---|
| Quadrant | DetID | PixID | Counts | Sigma | Mean | Median | Sigma |
| A | 15 | 174 | 26245 | 2921.77 | 32 | 31 | 9.0 |
| A | 0 | 226 | 310 | 31.1 | 32 | 31 | 9.0 |
| A | 12 | 194 | 237 | 22.96 | 32 | 31 | 9.0 |
| B | 5 | 65 | 69943 | 8157.12 | 32 | 31 | 8.6 |
| B | 4 | 216 | 9377 | 1090.46 | 32 | 31 | 8.6 |
| B | 15 | 35 | 6636 | 770.65 | 32 | 31 | 8.6 |
| C | 14 | 238 | 4580 | 478.98 | 31 | 31 | 9.5 |
| C | 3 | 9 | 1360 | 139.93 | 31 | 31 | 9.5 |
| C | 3 | 233 | 585 | 58.33 | 31 | 31 | 9.5 |
| D | 1 | 52 | 20024 | 2039.18 | 32 | 31 | 9.8 |
| D | 7 | 38 | 12127 | 1233.73 | 32 | 31 | 9.8 |
| D | 2 | 120 | 1968 | 197.56 | 32 | 31 | 9.8 |
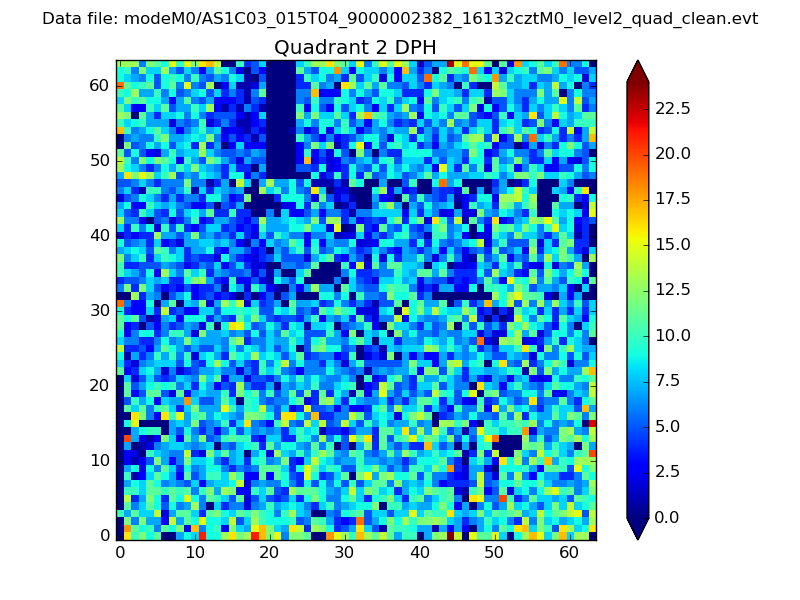
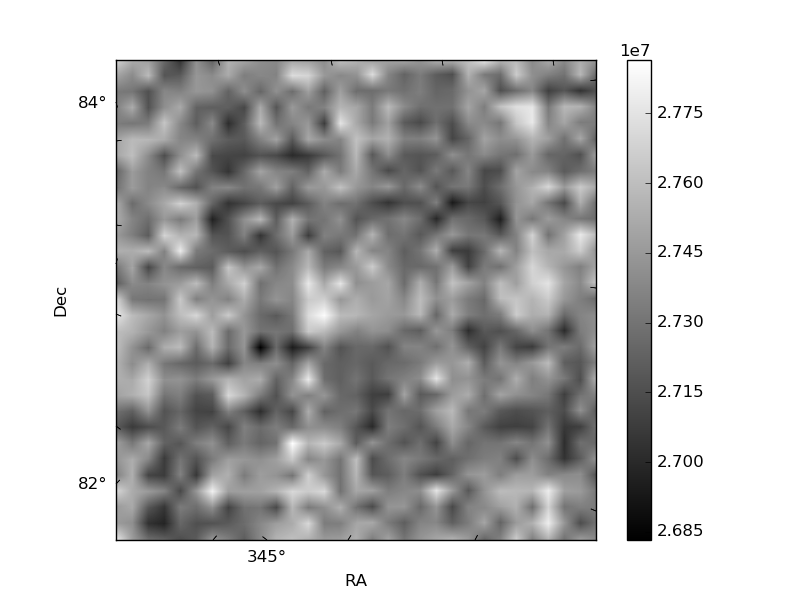
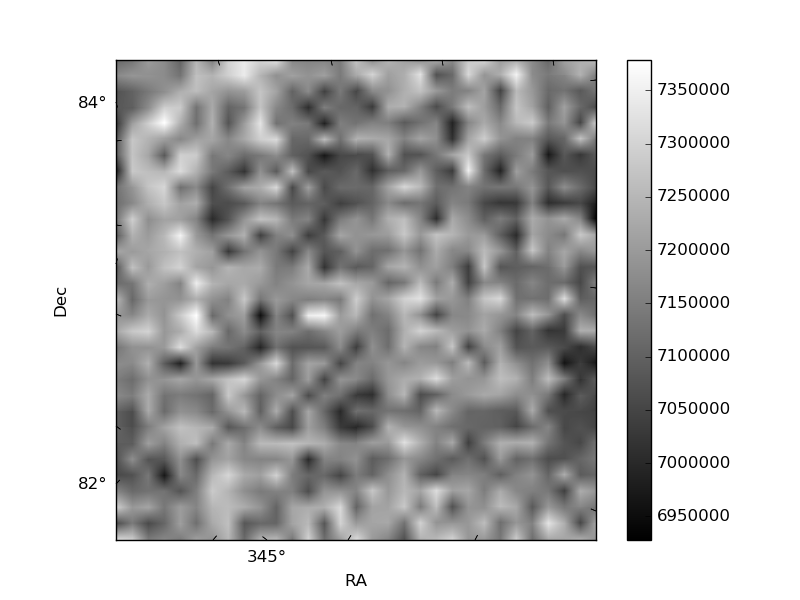
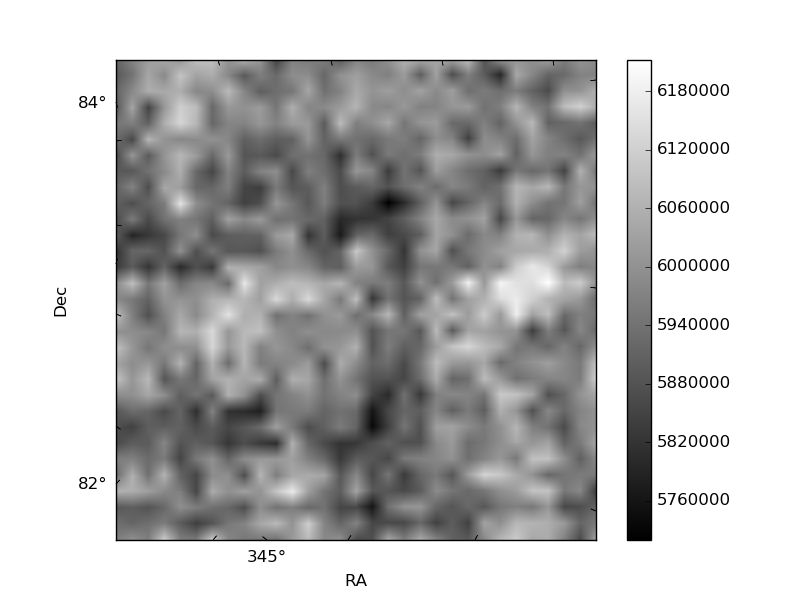
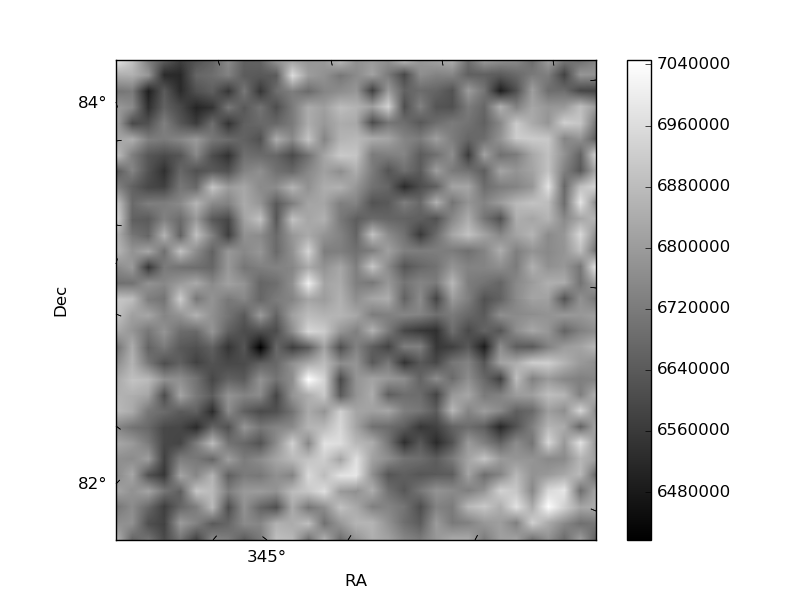
Histogram calculated using DETX and DETY for each event in the final _common_clean file
| Quadrant A | 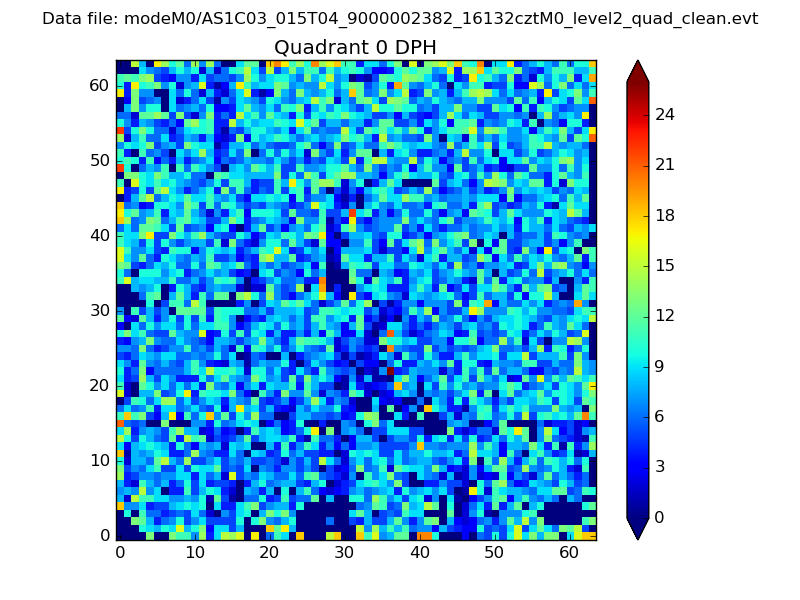 |
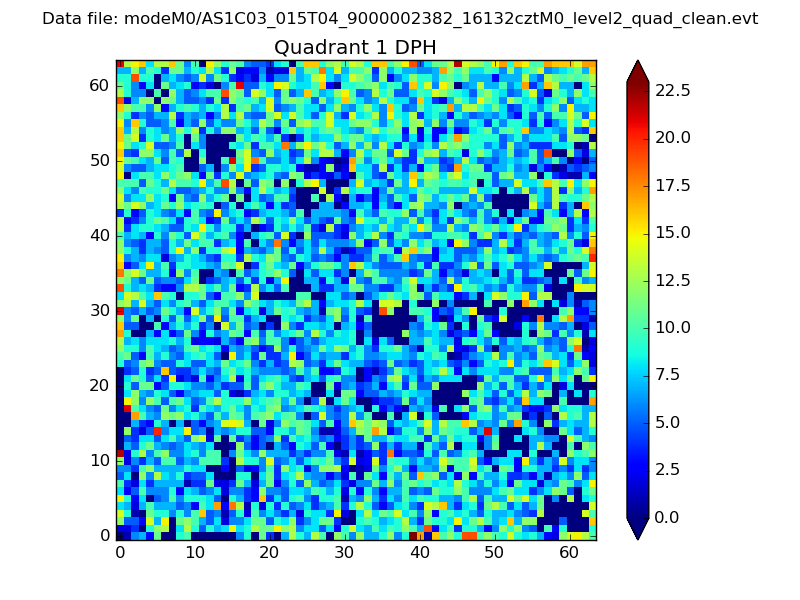 |
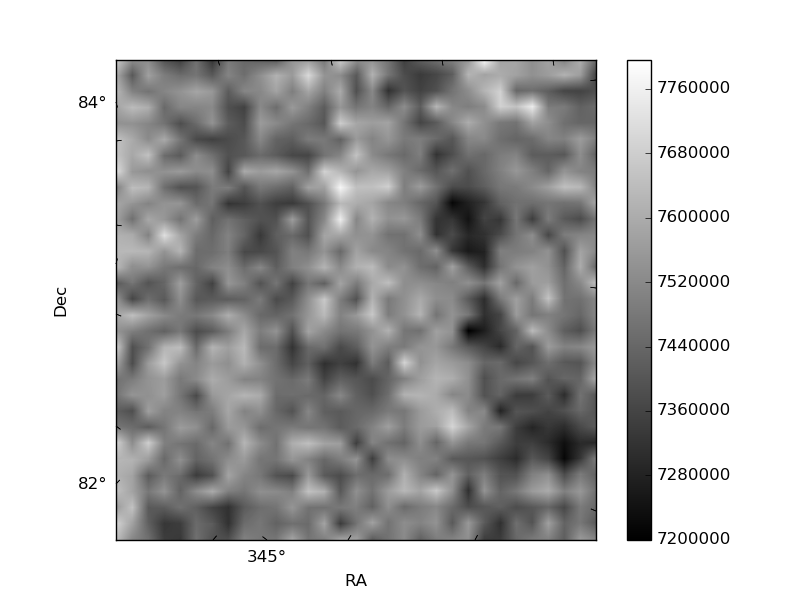
Quadrant B |
|---|---|---|---|
| Quadrant D | 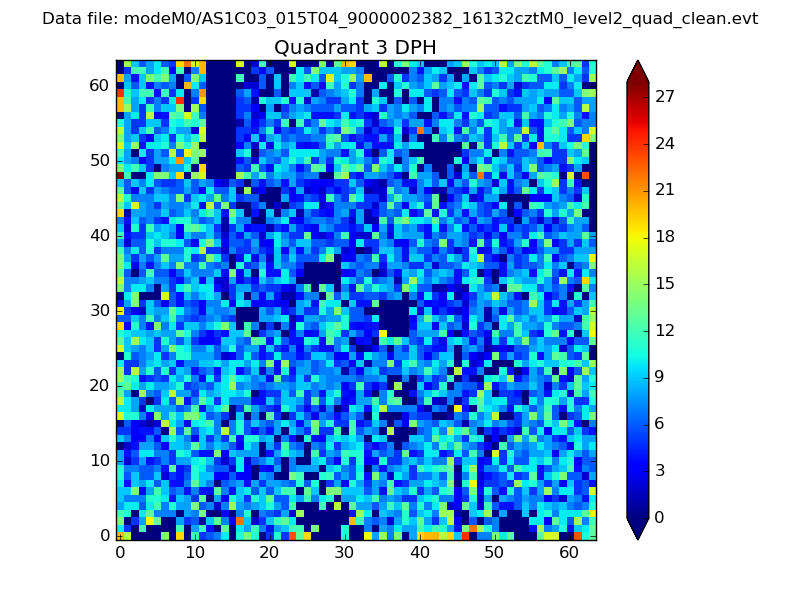 |
 |
Quadrant C |
| Plot type | Count rate plots | Images |
|---|---|---|
| Comparison with Poisson distribution Blue bars denote a histogram of data divided into 1 sec bins. Red curve is a Poisson curve with rate = median count rate of data. |
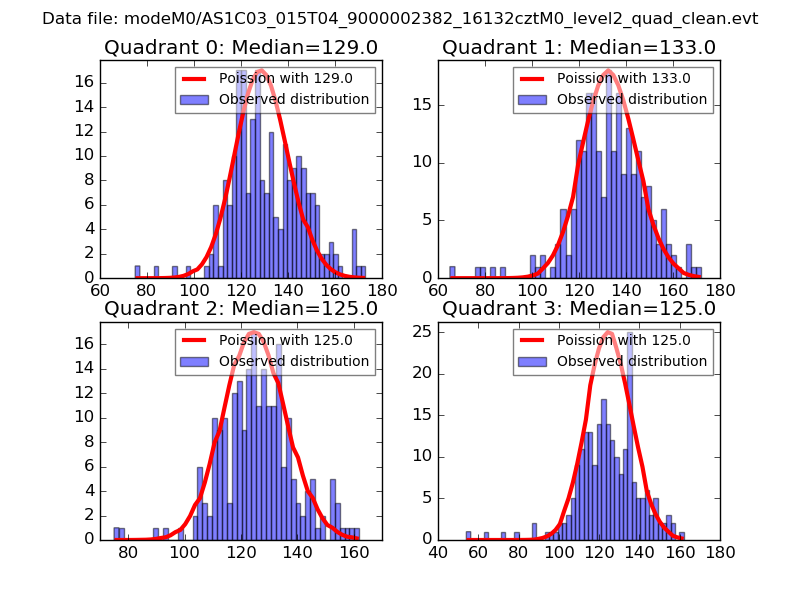 |
 |
| Quadrant-wise count rates Data is divided into 100 sec bins |
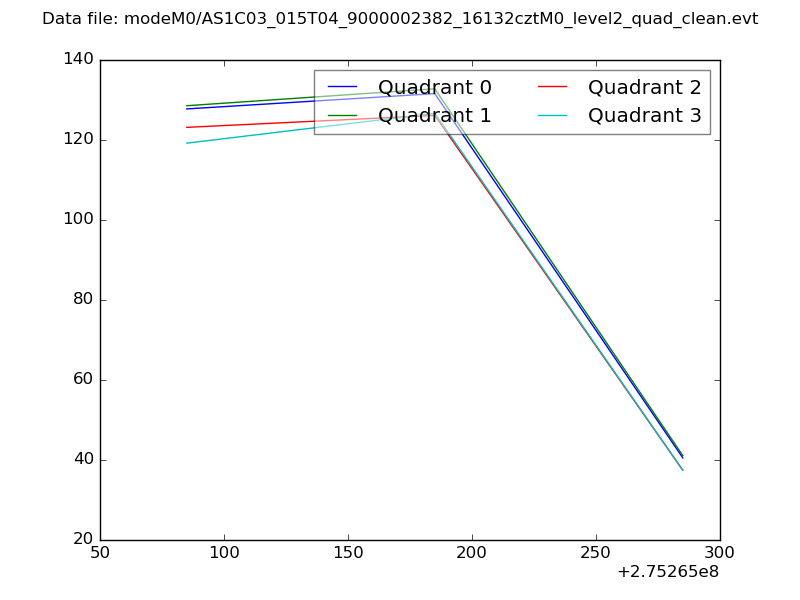 |
|
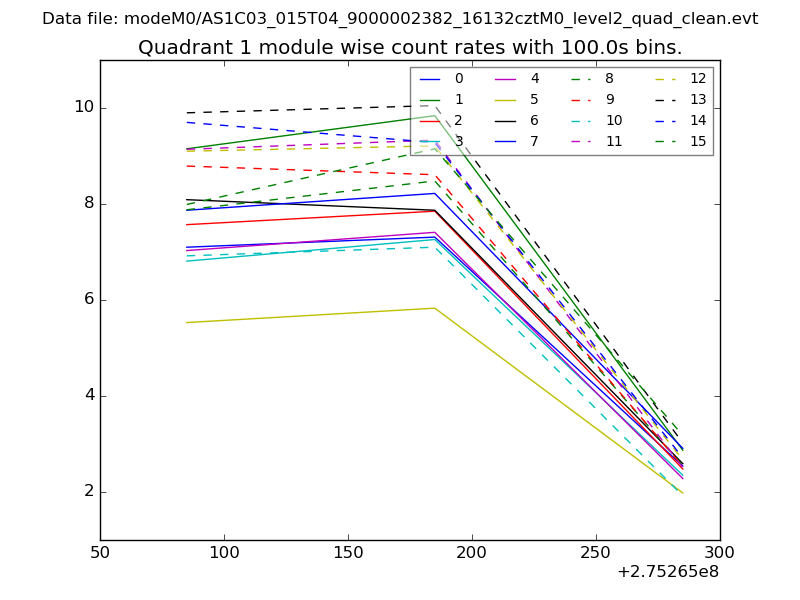
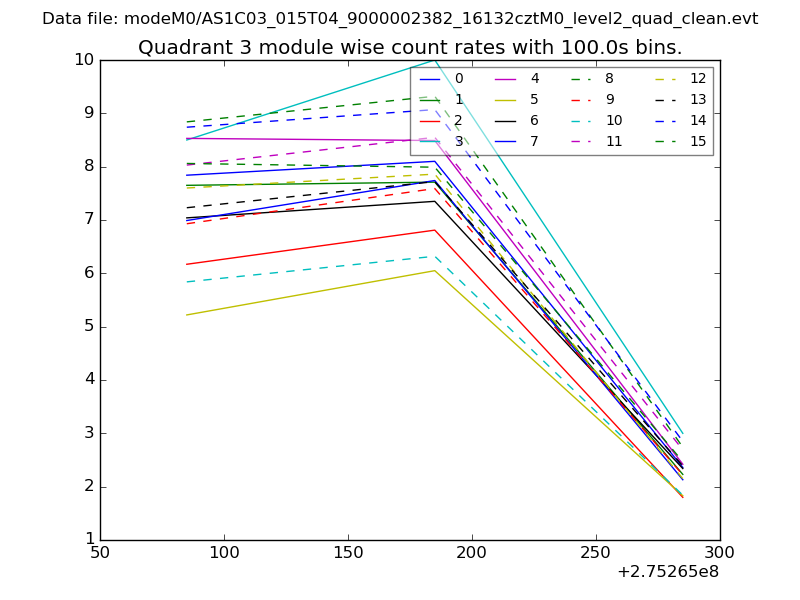
| Module-wise count rates for Quadrant A Data is divided into 100 sec bins |
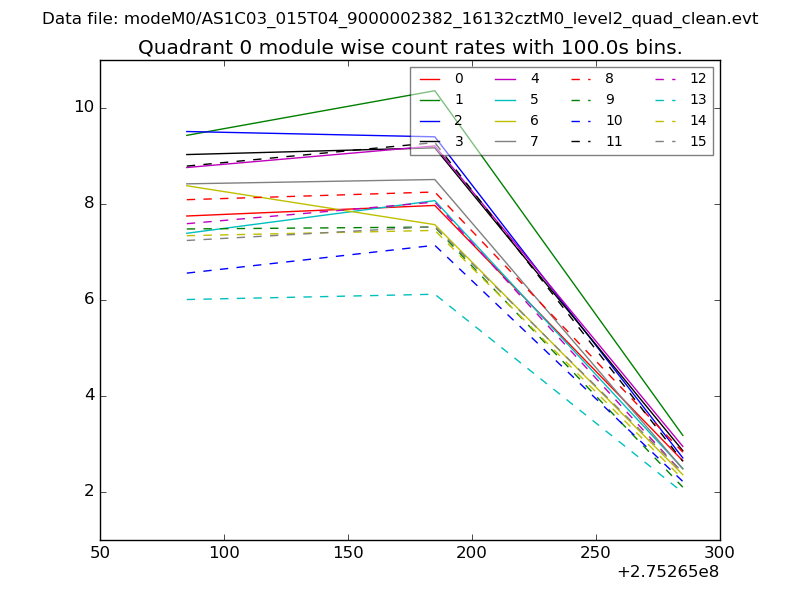 |
 |
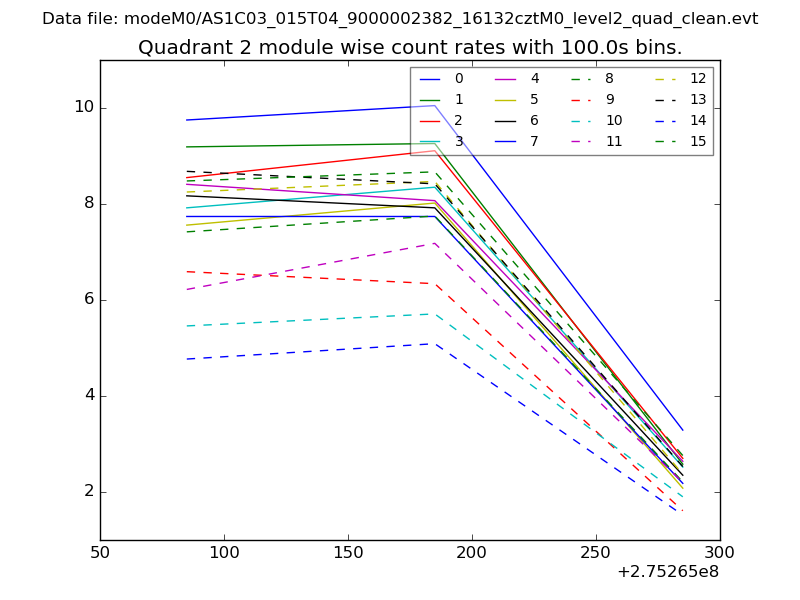
| Module-wise count rates for Quadrant B Data is divided into 100 sec bins |
 |
 |
| Module-wise count rates for Quadrant C Data is divided into 100 sec bins |
 |
 |
| Module-wise count rates for Quadrant D Data is divided into 100 sec bins |
 |
 |
| Parameter | Plot |
|---|---|
| CZT HV Monitor | 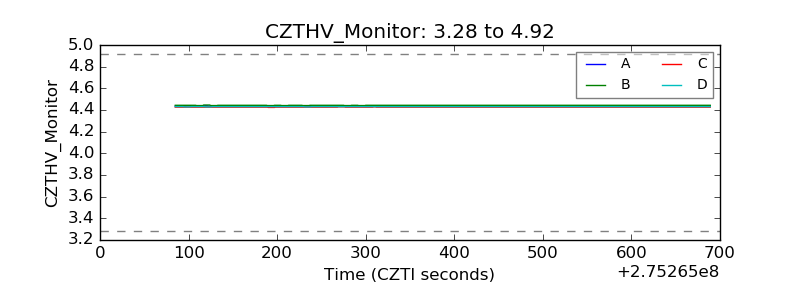 |
| D_VDD | 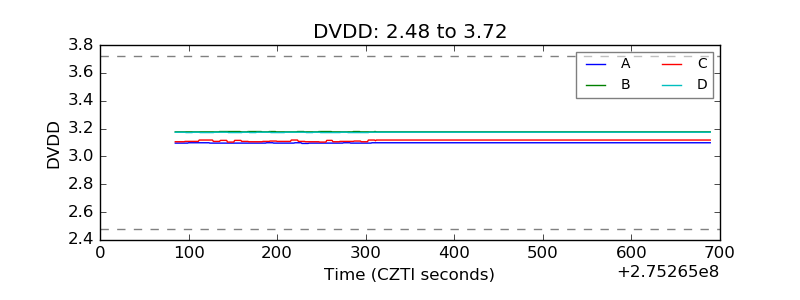 |
| Temperature 1 | 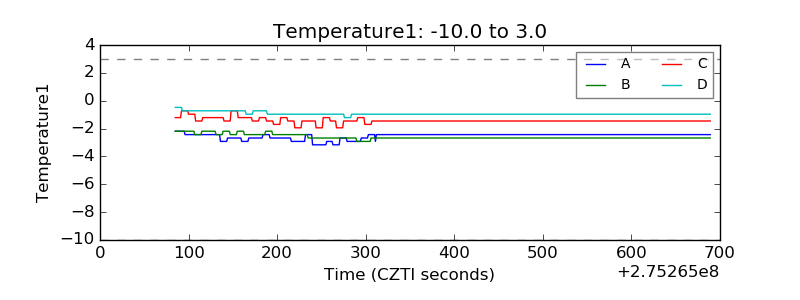 |
| Veto HV Monitor | 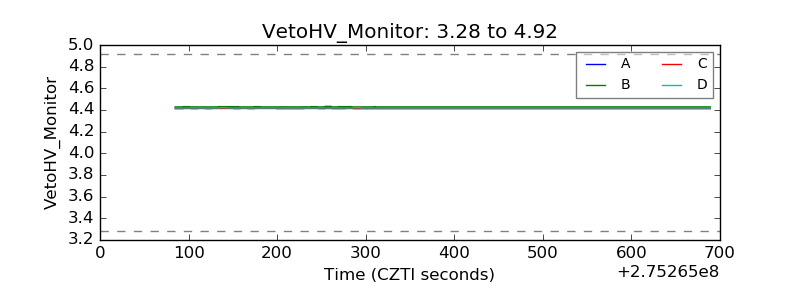 |
| Veto LLD | 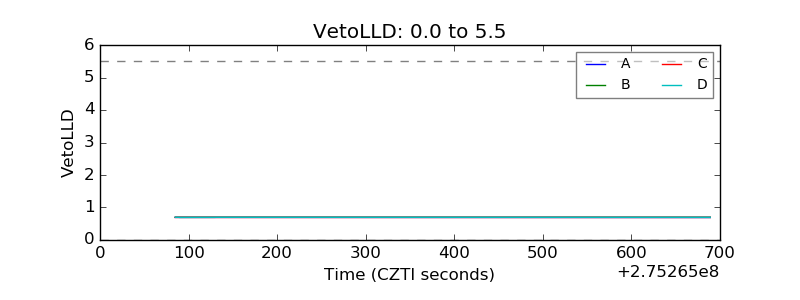 |
| Alpha Counter | 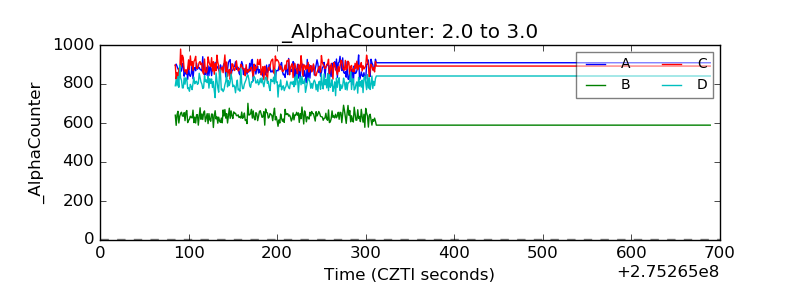 |
| _CPM_Rate | 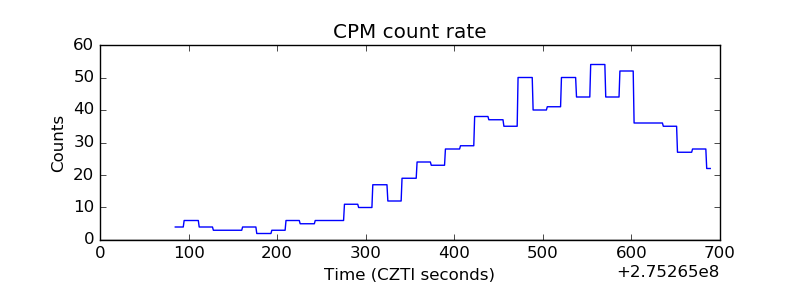 |
| CZT Counter | 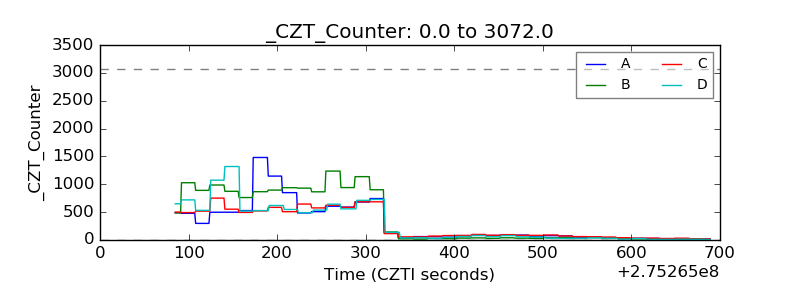 |
| +2.5 Volts monitor |  |
| +5 Volts monitor |  |
| _ROLL_ROT | 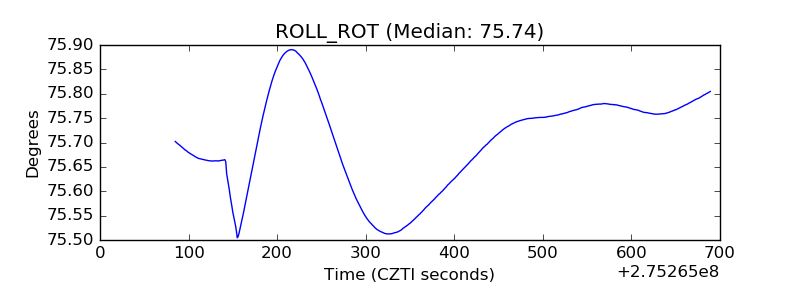 |
| _Roll_DEC | 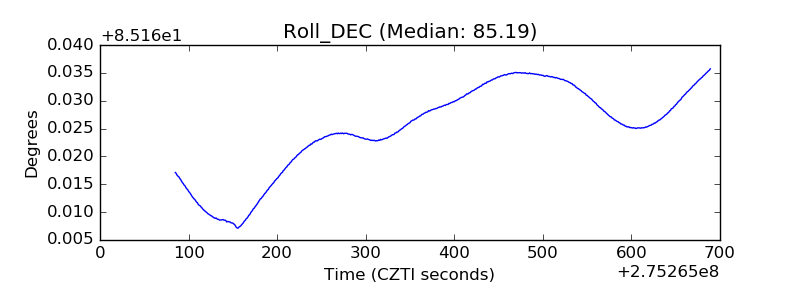 |
| _Roll_RA | 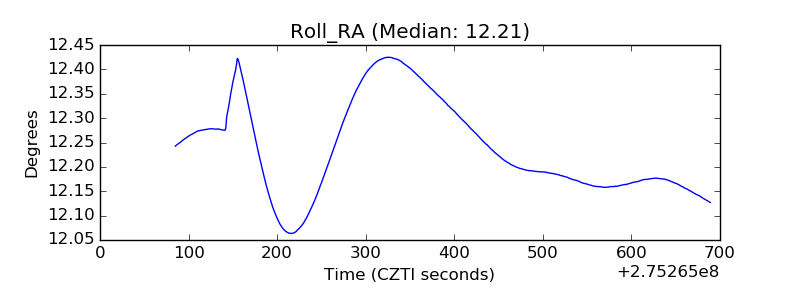 |
| Veto Counter | 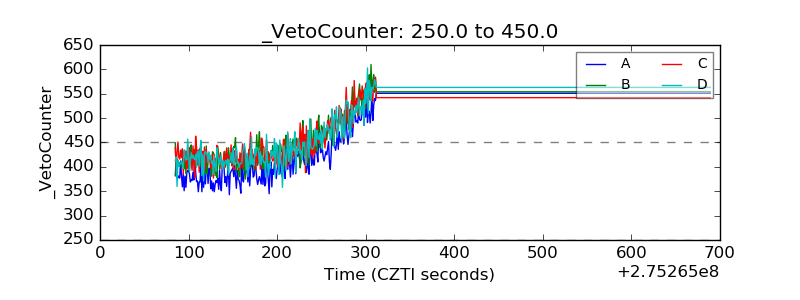 |