| Param | Original file | Final file |
|---|---|---|
| Filename | modeM0/AS1T02_092T01_9000002384cztM0_level2.fits | modeM0/AS1T02_092T01_9000002384cztM0_level2_quad_clean.evt |
| Size (bytes) | 769,786,560 | 736,315,200 |
| Size | 734.1 MB | 702.2 MB |
| Events in quadrant A | 4,746,954 | 4,482,956 |
| Events in quadrant B | 4,502,956 | 4,384,836 |
| Events in quadrant C | 4,571,884 | 4,147,631 |
| Events in quadrant D | 3,944,266 | 3,739,158 |
| Mode SS | |||
|---|---|---|---|
| Quadrant | BADHDUFLAG | Total packets | Discarded packets |
| A | 0 | 1646 | 0 |
| B | 0 | 1646 | 0 |
| C | 0 | 1646 | 0 |
| D | 0 | 1646 | 0 |
| Mode M0 | |||
|---|---|---|---|
| Quadrant | BADHDUFLAG | Total packets | Discarded packets |
| A | 0 | 182199 | 0 |
| B | 0 | 185634 | 0 |
| C | 0 | 173799 | 0 |
| D | 0 | 216039 | 0 |
| Mode M9 | |||
|---|---|---|---|
| Quadrant | BADHDUFLAG | Total packets | Discarded packets |
| A | 0 | 124 | 0 |
| B | 0 | 124 | 0 |
| C | 0 | 124 | 0 |
| D | 0 | 124 | 0 |
| Quadrant | Total seconds | Saturated seconds | Saturation percentage |
|---|---|---|---|
| A | 80879 | 1869 | 2.310859% |
| B | 80879 | 1544 | 1.909025% |
| C | 80879 | 1151 | 1.423114% |
| D | 80879 | 4779 | 5.908827% |
Noise dominated data is calculated using 1-second bins in cleaned event files. If a bin has >2000 counts, and if more than 50% of those come from <1% of pixels, then it is considered to be noise-dominated and hence unusable.
| Quadrant | # 1 sec bins | Bins with >0 counts | Bins with >2000 counts | High rate bins dominated by noise | Noise dominated (total time) | Noise dominated (detector-on time) | Marked lightcurve |
|---|---|---|---|---|---|---|---|
| A | 92788 | 80872 | 0 | 0 | 0.00% | 0.00% |  |
| B | 92788 | 80870 | 0 | 0 | 0.00% | 0.00% |  |
| C | 92788 | 80873 | 0 | 0 | 0.00% | 0.00% |  |
| D | 92788 | 80803 | 0 | 0 | 0.00% | 0.00% |  |
Top three noisy pixels from each quadrant. If the there are fewer than three noisy pixels in the level2.evt file, extra rows are filled as -1
| Pixel properties | Quadrant properties | ||||||
|---|---|---|---|---|---|---|---|
| Quadrant | DetID | PixID | Counts | Sigma | Mean | Median | Sigma |
| A | 0 | 29 | 4592 | 11.26 | 1235 | 1156 | 305.1 |
| A | 7 | 110 | 3680 | 8.27 | 1235 | 1156 | 305.1 |
| A | 9 | 19 | 3654 | 8.19 | 1235 | 1156 | 305.1 |
| B | 2 | 9 | 3687 | 10.93 | 1193 | 1137 | 233.4 |
| B | 2 | 8 | 3099 | 8.41 | 1193 | 1137 | 233.4 |
| B | 3 | 17 | 3005 | 8.01 | 1193 | 1137 | 233.4 |
| C | 12 | 241 | 3372 | 7.27 | 1206 | 1122 | 309.6 |
| C | 9 | 233 | 3098 | 6.38 | 1206 | 1122 | 309.6 |
| C | 2 | 191 | 3091 | 6.36 | 1206 | 1122 | 309.6 |
| D | 6 | 231 | 2905 | 6.3 | 1126 | 1023 | 298.8 |
| D | 3 | 14 | 2903 | 6.29 | 1126 | 1023 | 298.8 |
| D | 10 | 189 | 2826 | 6.03 | 1126 | 1023 | 298.8 |
Histogram calculated using DETX and DETY for each event in the final _common_clean file
| Quadrant A |  |
 |
Quadrant B |
|---|---|---|---|
| Quadrant D | 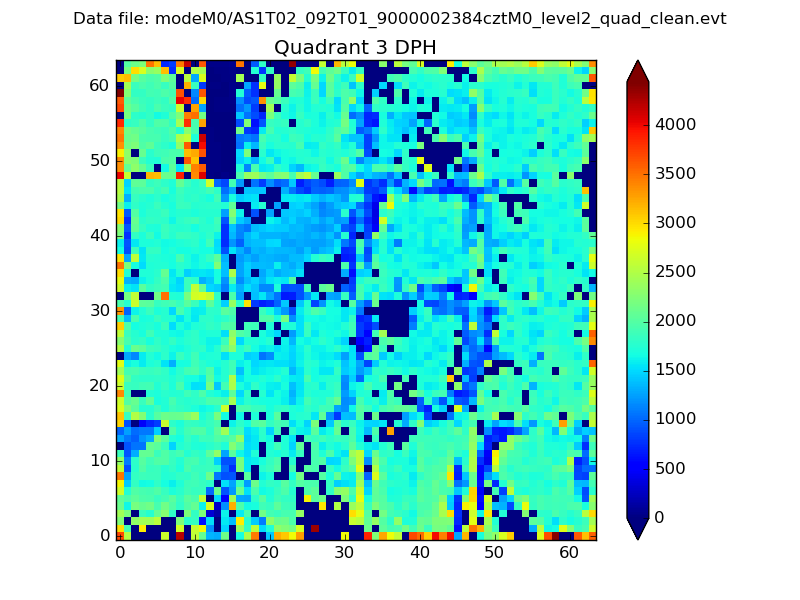 |
 |
Quadrant C |
| Plot type | Count rate plots | Images |
|---|---|---|
| Comparison with Poisson distribution Blue bars denote a histogram of data divided into 1 sec bins. Red curve is a Poisson curve with rate = median count rate of data. |
 |
 |
| Quadrant-wise count rates Data is divided into 100 sec bins |
 |
|
| Module-wise count rates for Quadrant A Data is divided into 100 sec bins |
 |
 |
| Module-wise count rates for Quadrant B Data is divided into 100 sec bins |
 |
 |
| Module-wise count rates for Quadrant C Data is divided into 100 sec bins |
 |
 |
| Module-wise count rates for Quadrant D Data is divided into 100 sec bins |
 |
 |
| Parameter | Plot |
|---|---|
| CZT HV Monitor |  |
| D_VDD |  |
| Temperature 1 |  |
| Veto HV Monitor |  |
| Veto LLD |  |
| Alpha Counter |  |
| _CPM_Rate |  |
| CZT Counter |  |
| +2.5 Volts monitor |  |
| +5 Volts monitor |  |
| _ROLL_ROT |  |
| _Roll_DEC |  |
| _Roll_RA |  |
| Veto Counter |  |