| Param | Original file | Final file |
|---|---|---|
| Filename | modeM0/AS1T02_092T01_9000002384_16130cztM0_level2.evt | modeM0/AS1T02_092T01_9000002384_16130cztM0_level2_quad_clean.evt |
| Size (bytes) | 67,659,840 | 4,176,000 |
| Size | 64.5 MB | 4.0 MB |
| Events in quadrant A | 566,312 | 12,052 |
| Events in quadrant B | 497,862 | 13,423 |
| Events in quadrant C | 431,828 | 12,821 |
| Events in quadrant D | 484,408 | 12,993 |
| Mode SS | |||
|---|---|---|---|
| Quadrant | BADHDUFLAG | Total packets | Discarded packets |
| A | 0 | 18 | 0 |
| B | 0 | 18 | 0 |
| C | 0 | 18 | 0 |
| D | 0 | 18 | 0 |
| Mode M0 | |||
|---|---|---|---|
| Quadrant | BADHDUFLAG | Total packets | Discarded packets |
| A | 0 | 2374 | 1 |
| B | 0 | 2109 | 0 |
| C | 0 | 1934 | 0 |
| D | 0 | 2127 | 0 |
| Quadrant | Total seconds | Saturated seconds | Saturation percentage |
|---|---|---|---|
| A | 966 | 29 | 3.002070% |
| B | 966 | 0 | 0.000000% |
| C | 966 | 2 | 0.207039% |
| D | 966 | 13 | 1.345756% |
Noise dominated data is calculated using 1-second bins in cleaned event files. If a bin has >2000 counts, and if more than 50% of those come from <1% of pixels, then it is considered to be noise-dominated and hence unusable.
| Quadrant | # 1 sec bins | Bins with >0 counts | Bins with >2000 counts | High rate bins dominated by noise | Noise dominated (total time) | Noise dominated (detector-on time) | Marked lightcurve |
|---|---|---|---|---|---|---|---|
| A | 966 | 966 | 25 | 25 | 2.59% | 2.59% | 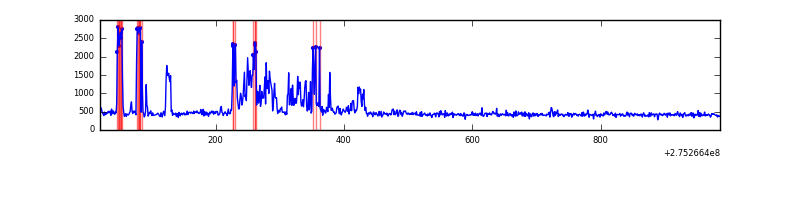 |
| B | 966 | 966 | 0 | 0 | 0.00% | 0.00% | 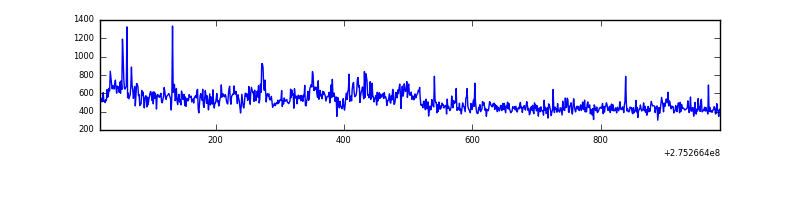 |
| C | 966 | 966 | 0 | 0 | 0.00% | 0.00% | 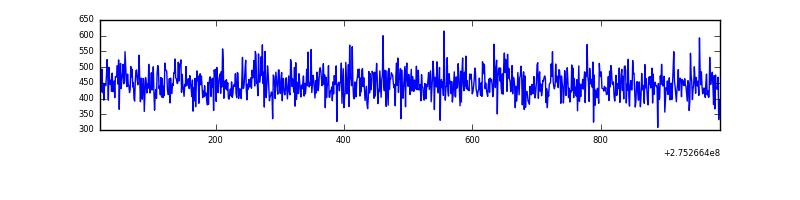 |
| D | 966 | 966 | 11 | 11 | 1.14% | 1.14% | 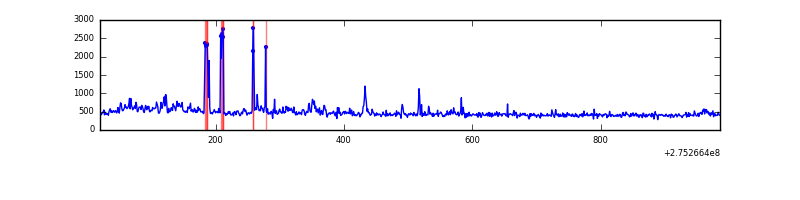 |
Top three noisy pixels from each quadrant. If the there are fewer than three noisy pixels in the level2.evt file, extra rows are filled as -1
| Pixel properties | Quadrant properties | ||||||
|---|---|---|---|---|---|---|---|
| Quadrant | DetID | PixID | Counts | Sigma | Mean | Median | Sigma |
| A | 15 | 174 | 158207 | 6686.14 | 104 | 102 | 23.6 |
| A | 8 | 247 | 4445 | 183.66 | 104 | 102 | 23.6 |
| A | 0 | 226 | 930 | 35.02 | 104 | 102 | 23.6 |
| B | 5 | 65 | 57651 | 2484.47 | 108 | 105 | 23.2 |
| B | 0 | 189 | 12330 | 527.8 | 108 | 105 | 23.2 |
| B | 12 | 111 | 2505 | 103.62 | 108 | 105 | 23.2 |
| C | 14 | 238 | 16424 | 602.16 | 105 | 105 | 27.1 |
| C | 3 | 9 | 4579 | 165.09 | 105 | 105 | 27.1 |
| C | 13 | 61 | 747 | 23.69 | 105 | 105 | 27.1 |
| D | 1 | 52 | 72565 | 2640.32 | 103 | 100 | 27.4 |
| D | 12 | 221 | 11179 | 403.67 | 103 | 100 | 27.4 |
| D | 2 | 234 | 4625 | 164.87 | 103 | 100 | 27.4 |
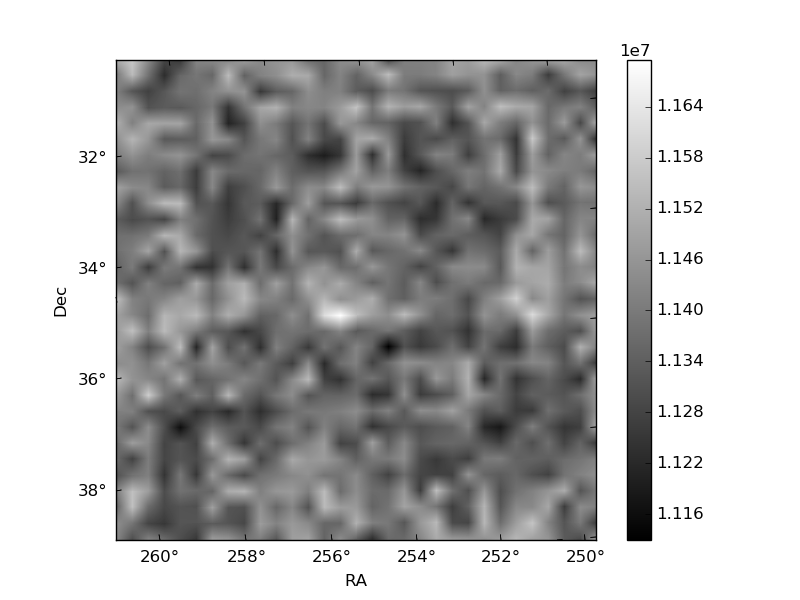
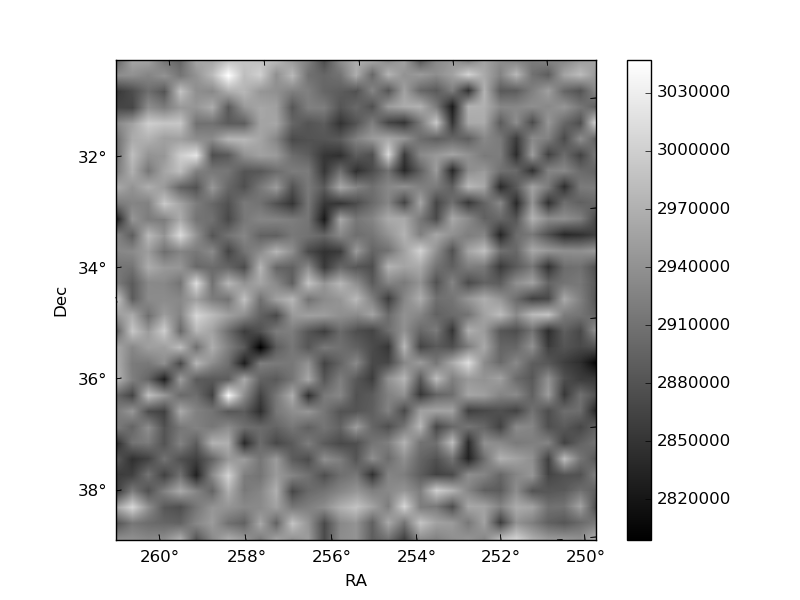
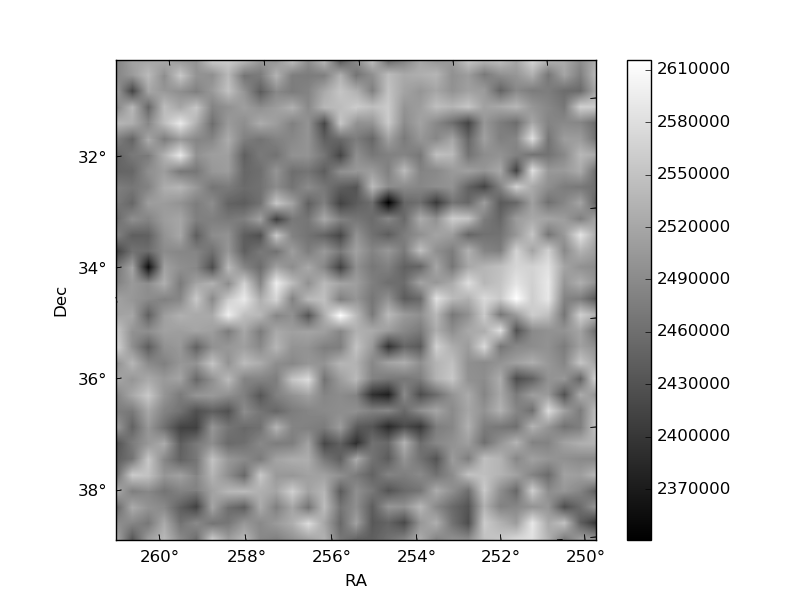
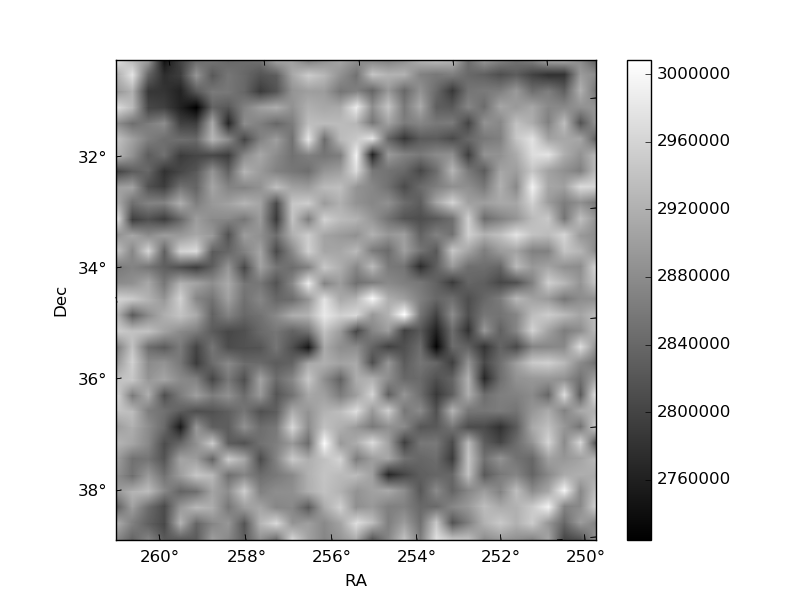
Histogram calculated using DETX and DETY for each event in the final _common_clean file
| Quadrant A | 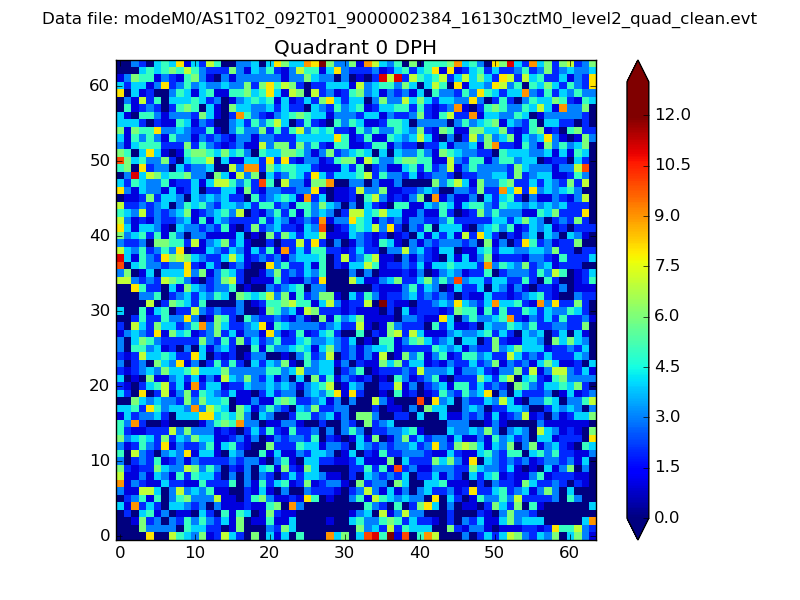 |
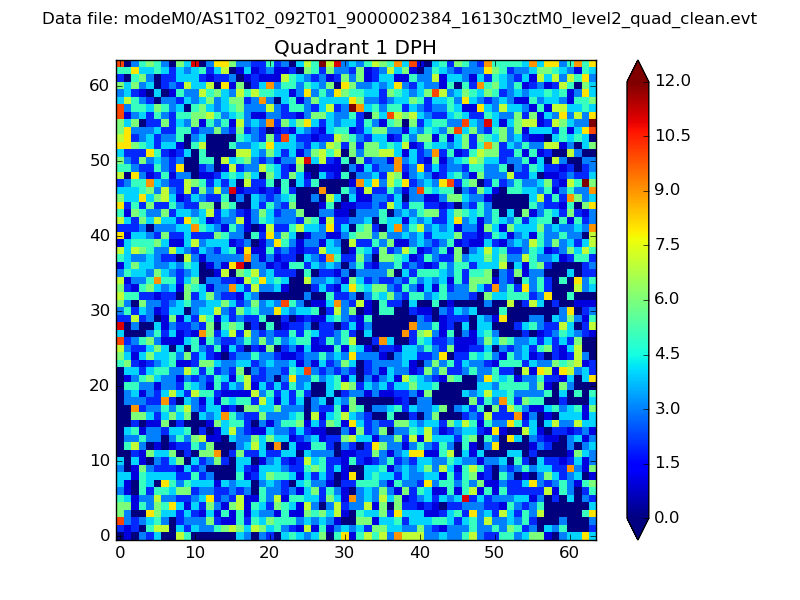 |
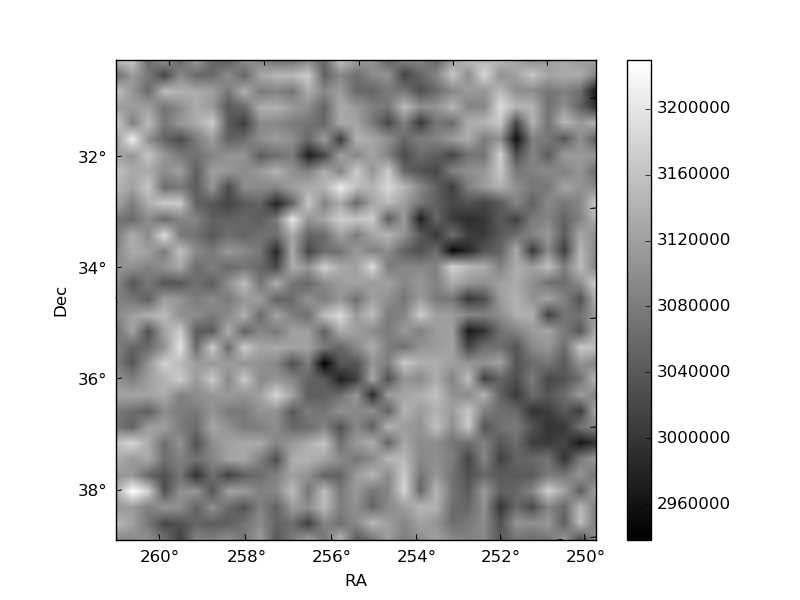
Quadrant B |
|---|---|---|---|
| Quadrant D | 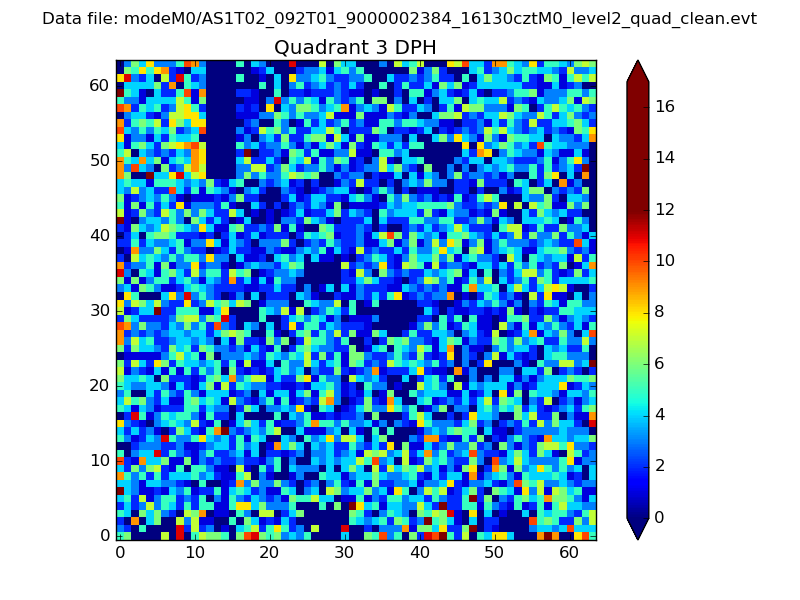 |
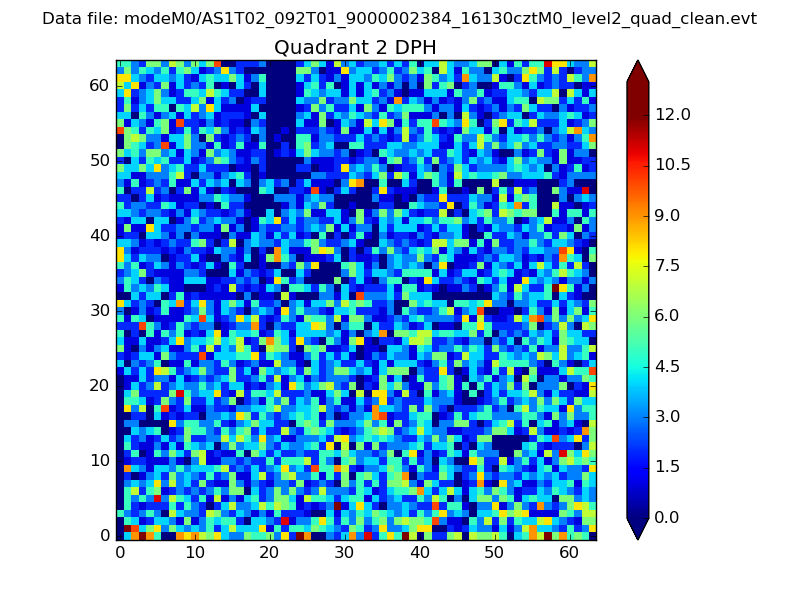 |
Quadrant C |
| Plot type | Count rate plots | Images |
|---|---|---|
| Comparison with Poisson distribution Blue bars denote a histogram of data divided into 1 sec bins. Red curve is a Poisson curve with rate = median count rate of data. |
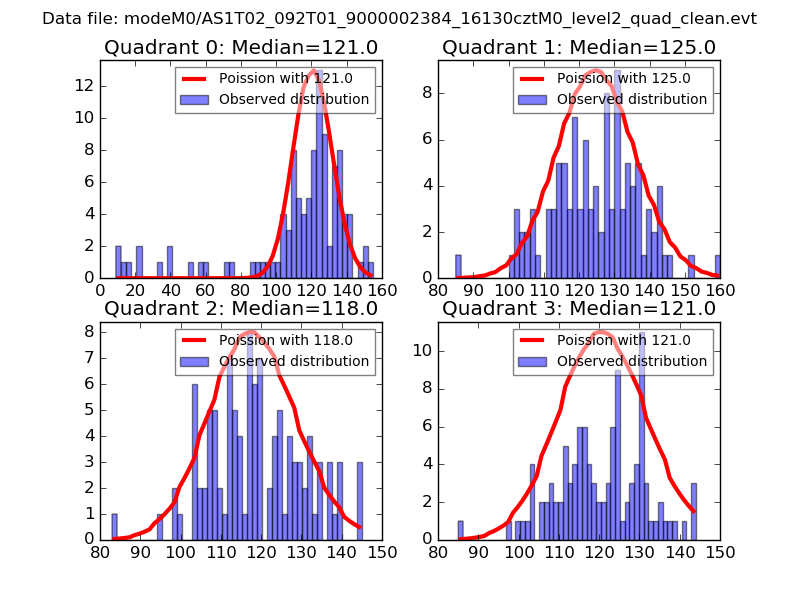 |
 |
| Quadrant-wise count rates Data is divided into 100 sec bins |
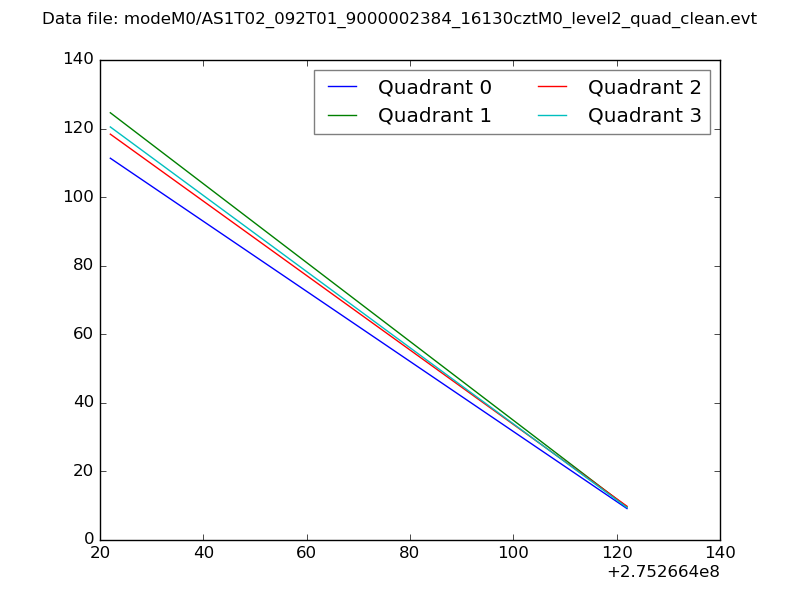 |
|
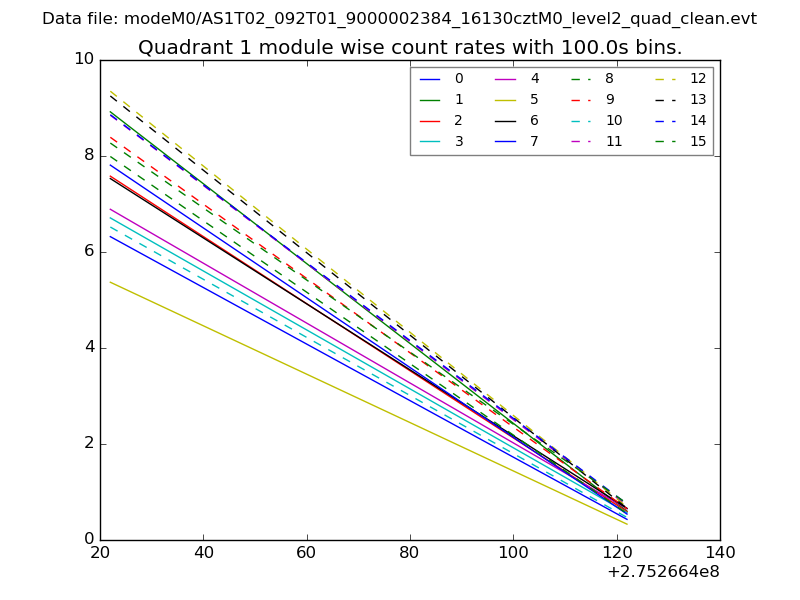
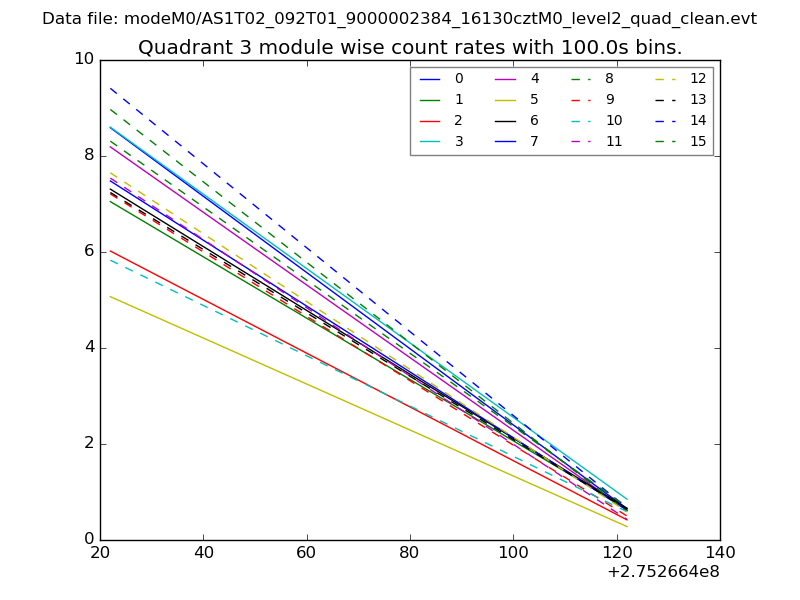
| Module-wise count rates for Quadrant A Data is divided into 100 sec bins |
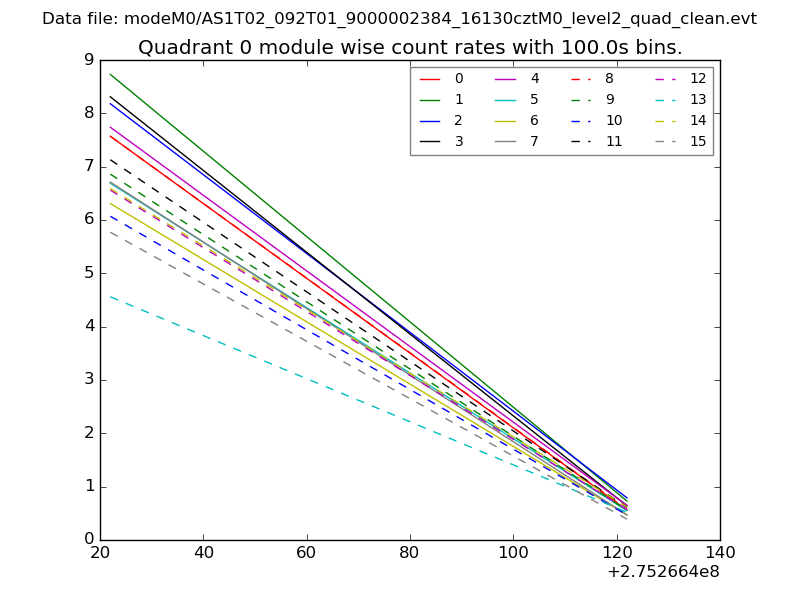 |
 |
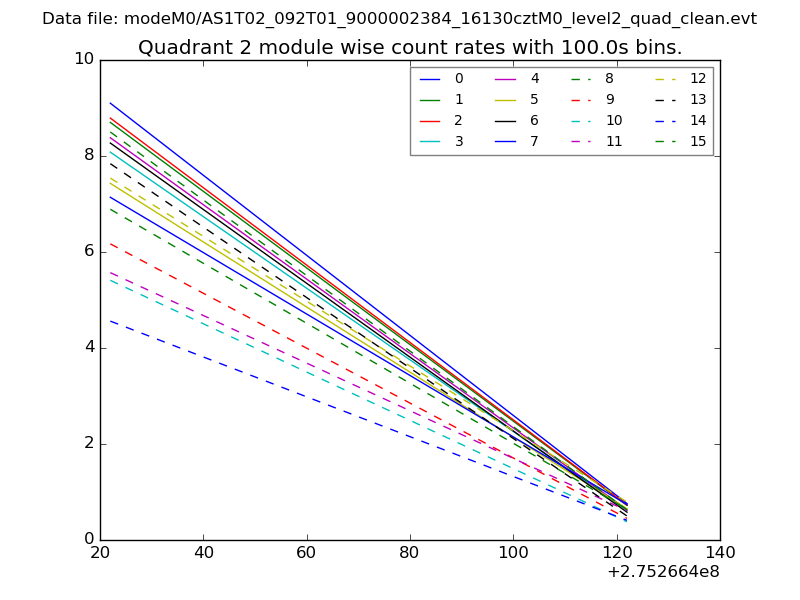
| Module-wise count rates for Quadrant B Data is divided into 100 sec bins |
 |
 |
| Module-wise count rates for Quadrant C Data is divided into 100 sec bins |
 |
 |
| Module-wise count rates for Quadrant D Data is divided into 100 sec bins |
 |
 |
| Parameter | Plot |
|---|---|
| CZT HV Monitor | 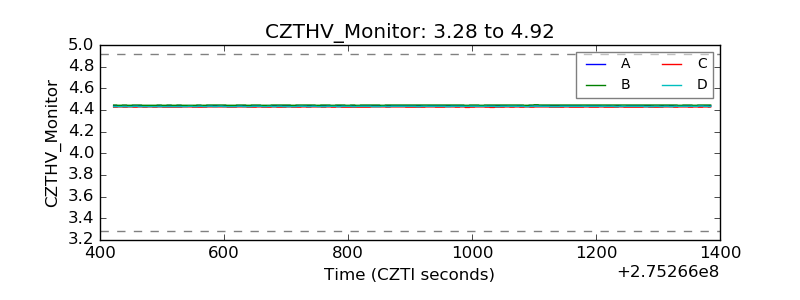 |
| D_VDD | 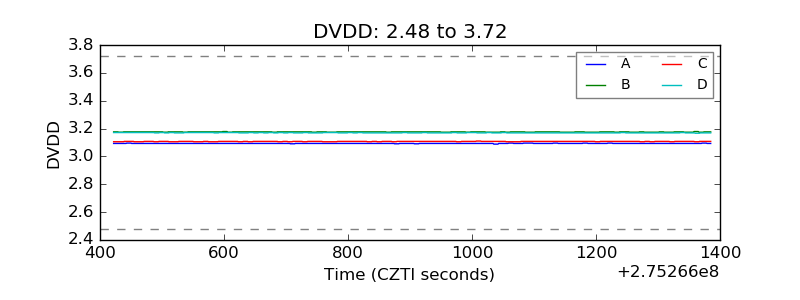 |
| Temperature 1 | 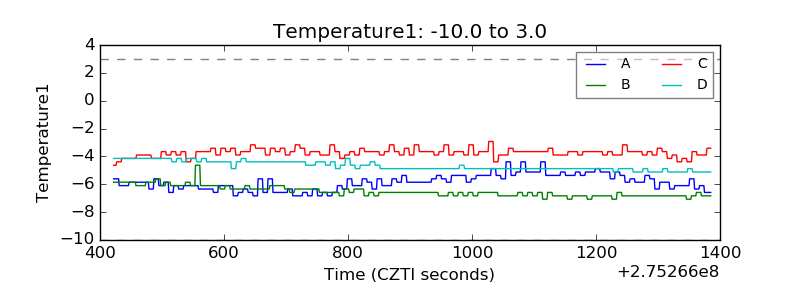 |
| Veto HV Monitor |  |
| Veto LLD | 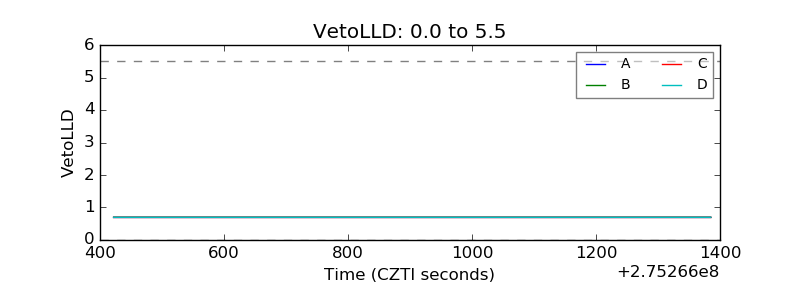 |
| Alpha Counter | 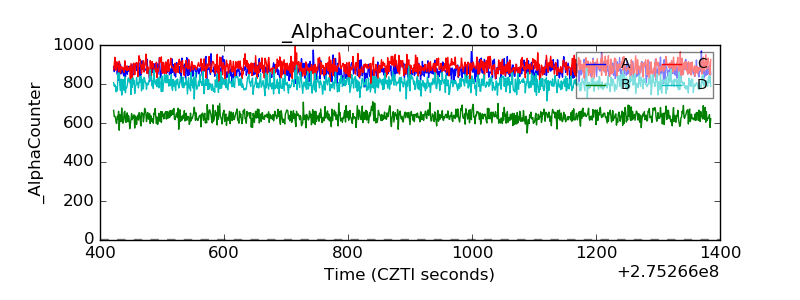 |
| _CPM_Rate | 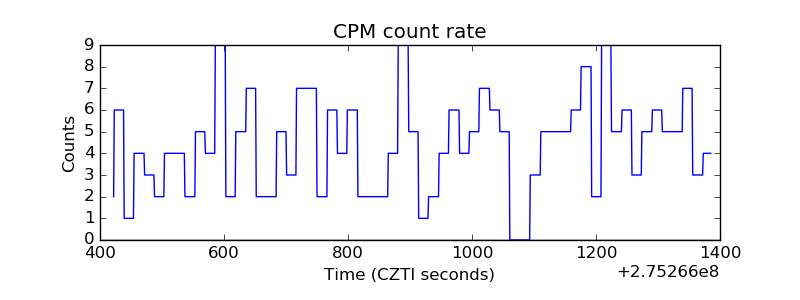 |
| CZT Counter | 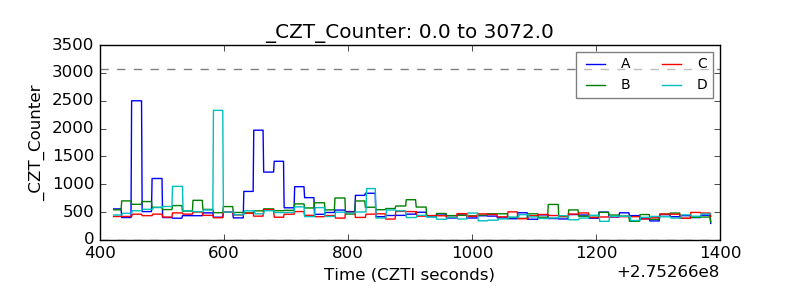 |
| +2.5 Volts monitor |  |
| +5 Volts monitor |  |
| _ROLL_ROT | 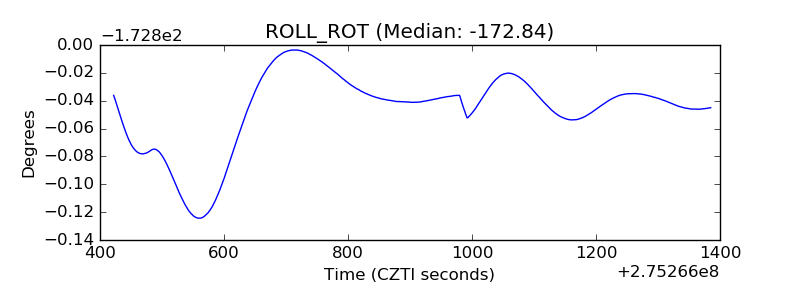 |
| _Roll_DEC | 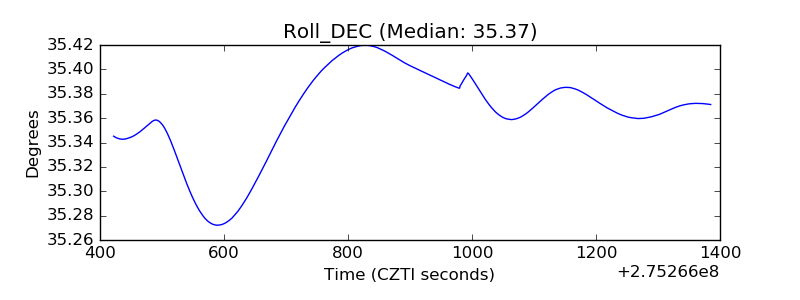 |
| _Roll_RA | 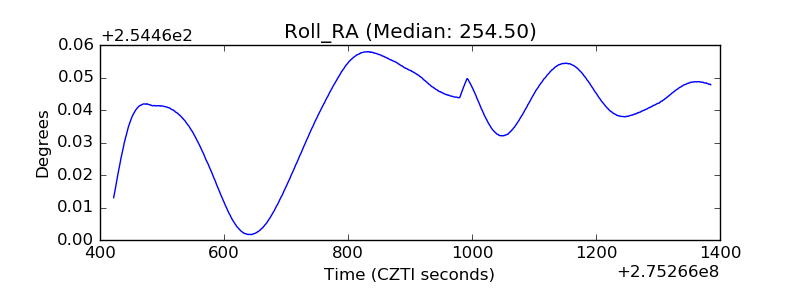 |
| Veto Counter | 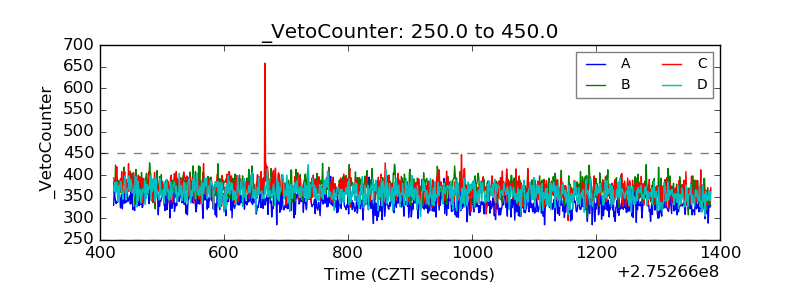 |