| Param | Original file | Final file |
|---|---|---|
| Filename | modeM0/AS1T02_092T01_9000002384_16133cztM0_level2.evt | modeM0/AS1T02_092T01_9000002384_16133cztM0_level2_quad_clean.evt |
| Size (bytes) | 442,690,560 | 70,102,080 |
| Size | 422.2 MB | 66.9 MB |
| Events in quadrant A | 3,261,225 | 430,010 |
| Events in quadrant B | 3,474,051 | 424,091 |
| Events in quadrant C | 3,162,319 | 408,435 |
| Events in quadrant D | 3,069,663 | 408,823 |
| Mode SS | |||
|---|---|---|---|
| Quadrant | BADHDUFLAG | Total packets | Discarded packets |
| A | 0 | 132 | 0 |
| B | 0 | 132 | 0 |
| C | 0 | 132 | 0 |
| D | 0 | 132 | 0 |
| Mode M0 | |||
|---|---|---|---|
| Quadrant | BADHDUFLAG | Total packets | Discarded packets |
| A | 0 | 13836 | 2 |
| B | 0 | 14301 | 1 |
| C | 0 | 13345 | 1 |
| D | 0 | 13380 | 1 |
| Mode M9 | |||
|---|---|---|---|
| Quadrant | BADHDUFLAG | Total packets | Discarded packets |
| A | 0 | 9 | 0 |
| B | 0 | 9 | 0 |
| C | 0 | 9 | 0 |
| D | 0 | 9 | 0 |
| Quadrant | Total seconds | Saturated seconds | Saturation percentage |
|---|---|---|---|
| A | 6466 | 82 | 1.268172% |
| B | 6466 | 98 | 1.515620% |
| C | 6466 | 63 | 0.974327% |
| D | 6466 | 32 | 0.494896% |
Noise dominated data is calculated using 1-second bins in cleaned event files. If a bin has >2000 counts, and if more than 50% of those come from <1% of pixels, then it is considered to be noise-dominated and hence unusable.
| Quadrant | # 1 sec bins | Bins with >0 counts | Bins with >2000 counts | High rate bins dominated by noise | Noise dominated (total time) | Noise dominated (detector-on time) | Marked lightcurve |
|---|---|---|---|---|---|---|---|
| A | 7347 | 6468 | 26 | 26 | 0.35% | 0.40% | 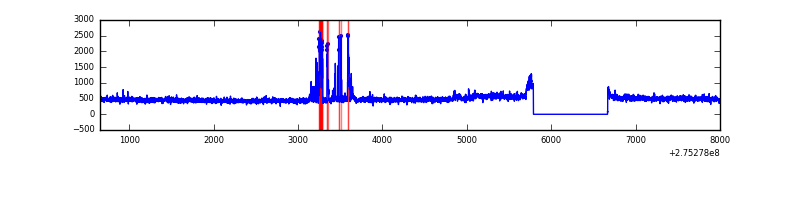 |
| B | 7347 | 6468 | 34 | 34 | 0.46% | 0.53% | 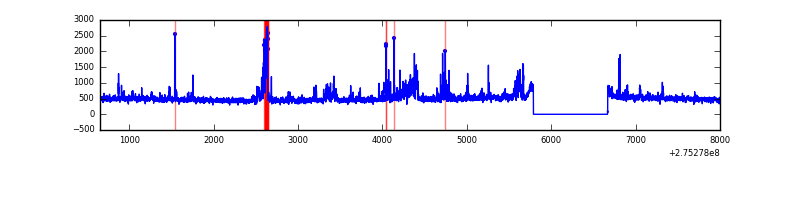 |
| C | 7347 | 6468 | 0 | 0 | 0.00% | 0.00% | 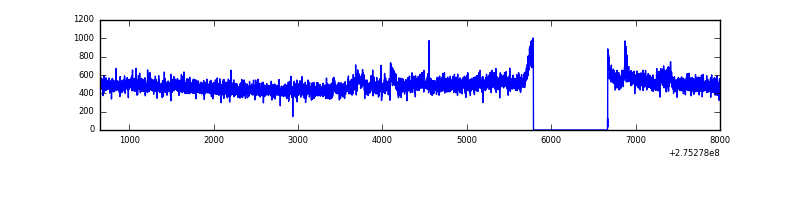 |
| D | 7347 | 6468 | 4 | 4 | 0.05% | 0.06% | 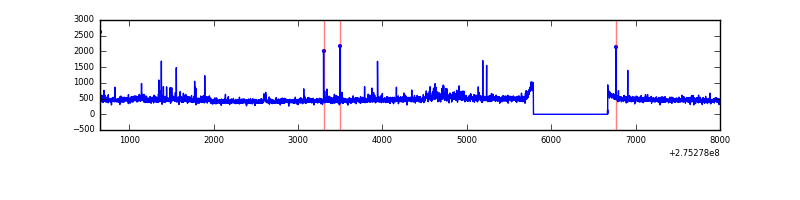 |
Top three noisy pixels from each quadrant. If the there are fewer than three noisy pixels in the level2.evt file, extra rows are filled as -1
| Pixel properties | Quadrant properties | ||||||
|---|---|---|---|---|---|---|---|
| Quadrant | DetID | PixID | Counts | Sigma | Mean | Median | Sigma |
| A | 15 | 174 | 170285 | 1062.13 | 779 | 763 | 159.6 |
| A | 0 | 253 | 88695 | 550.93 | 779 | 763 | 159.6 |
| A | 0 | 226 | 6823 | 37.97 | 779 | 763 | 159.6 |
| B | 0 | 189 | 92488 | 613.85 | 780 | 761 | 149.4 |
| B | 15 | 201 | 84665 | 561.5 | 780 | 761 | 149.4 |
| B | 4 | 216 | 59776 | 394.94 | 780 | 761 | 149.4 |
| C | 14 | 238 | 114670 | 649.18 | 746 | 749 | 175.5 |
| C | 3 | 233 | 76962 | 434.3 | 746 | 749 | 175.5 |
| C | 3 | 9 | 49724 | 279.09 | 746 | 749 | 175.5 |
| D | 1 | 52 | 185798 | 987.65 | 758 | 735 | 187.4 |
| D | 2 | 234 | 29015 | 150.93 | 758 | 735 | 187.4 |
| D | 14 | 226 | 7393 | 35.53 | 758 | 735 | 187.4 |
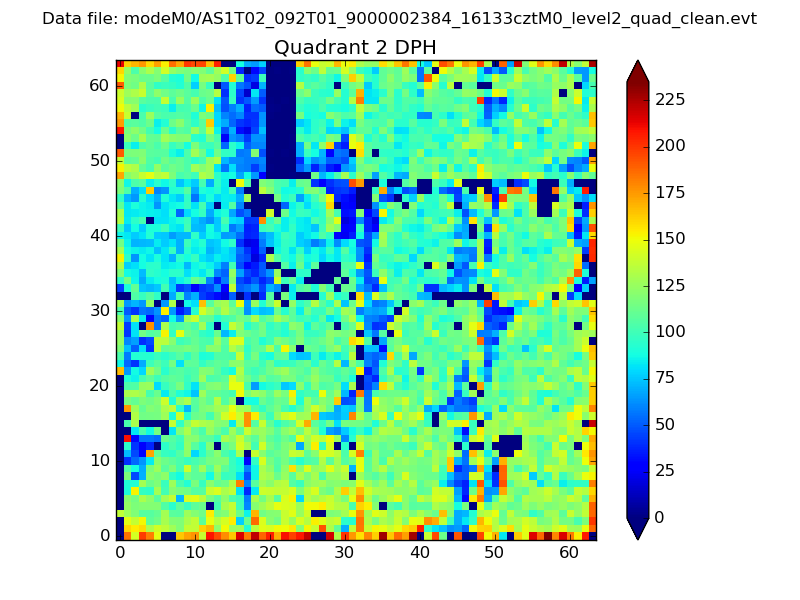
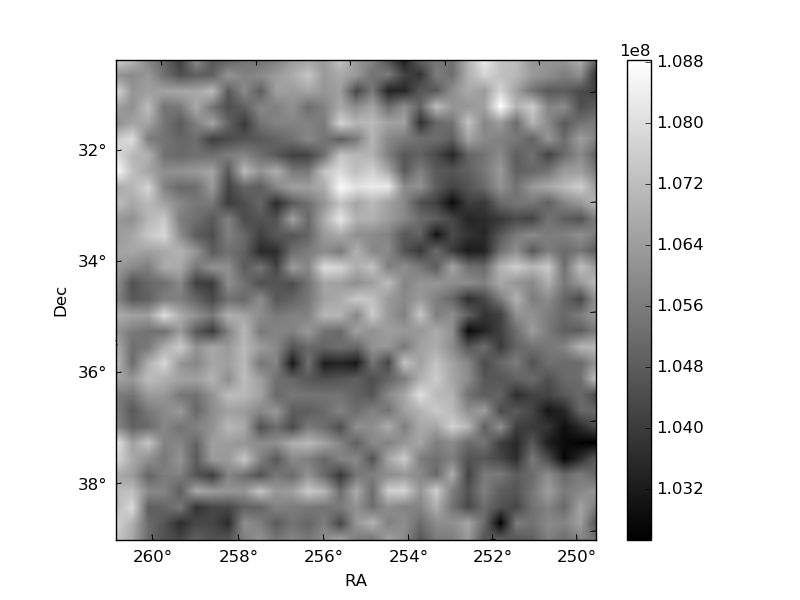
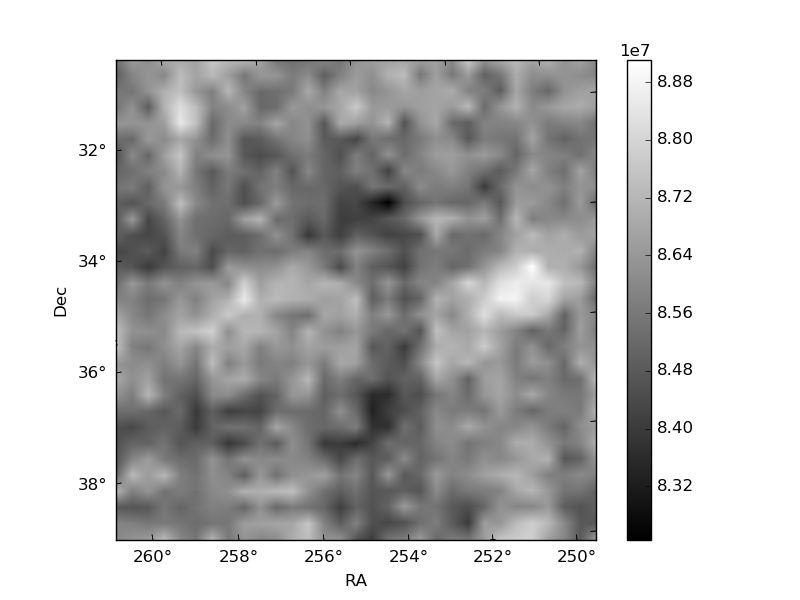
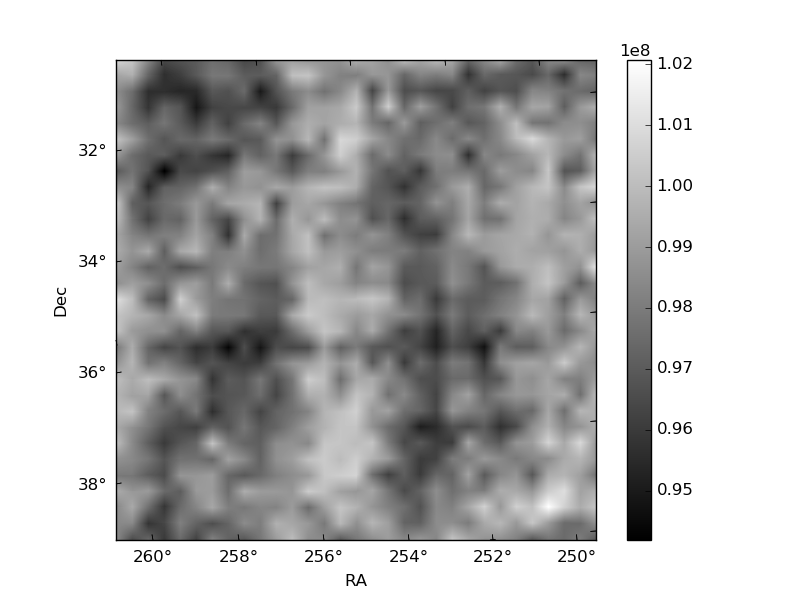
Histogram calculated using DETX and DETY for each event in the final _common_clean file
| Quadrant A | 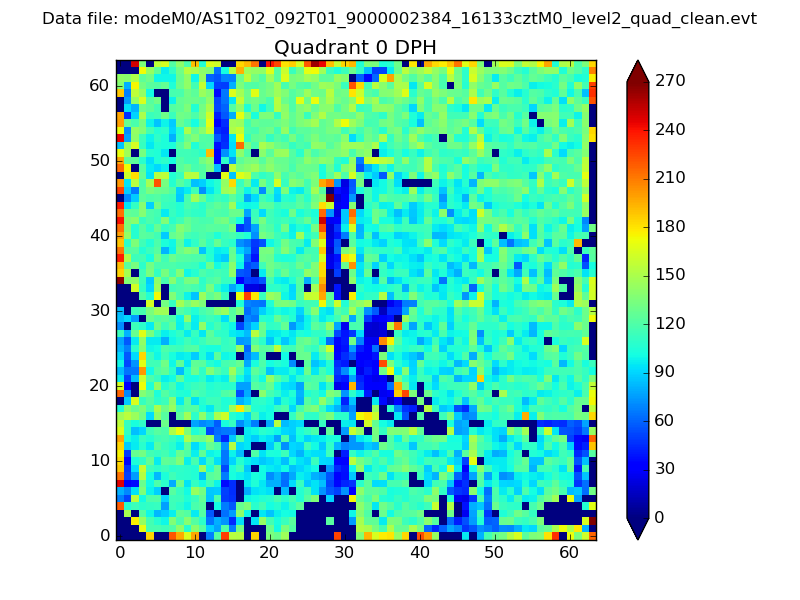 |
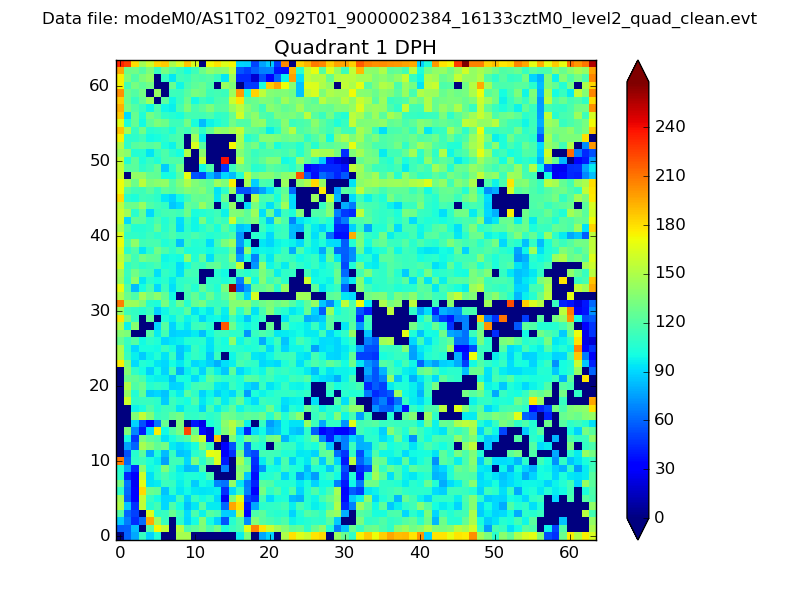 |
Quadrant B |
|---|---|---|---|
| Quadrant D | 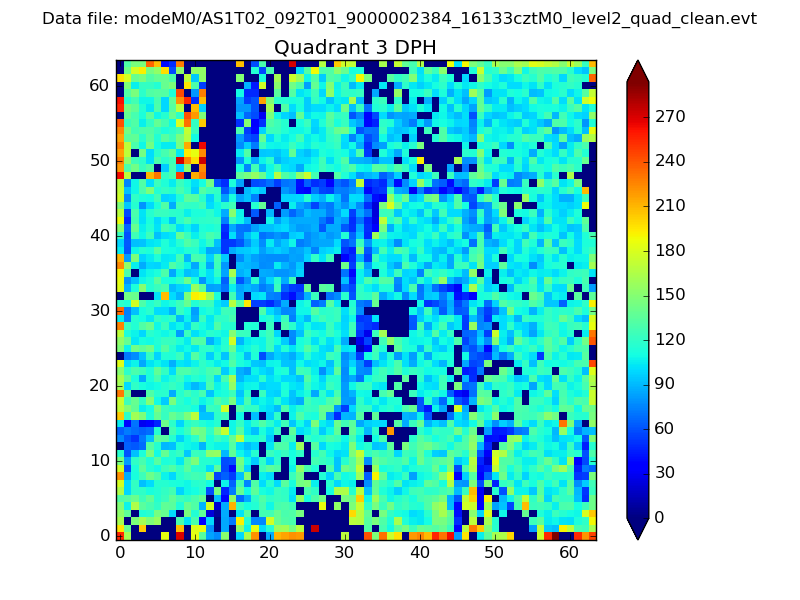 |
 |
Quadrant C |
| Plot type | Count rate plots | Images |
|---|---|---|
| Comparison with Poisson distribution Blue bars denote a histogram of data divided into 1 sec bins. Red curve is a Poisson curve with rate = median count rate of data. |
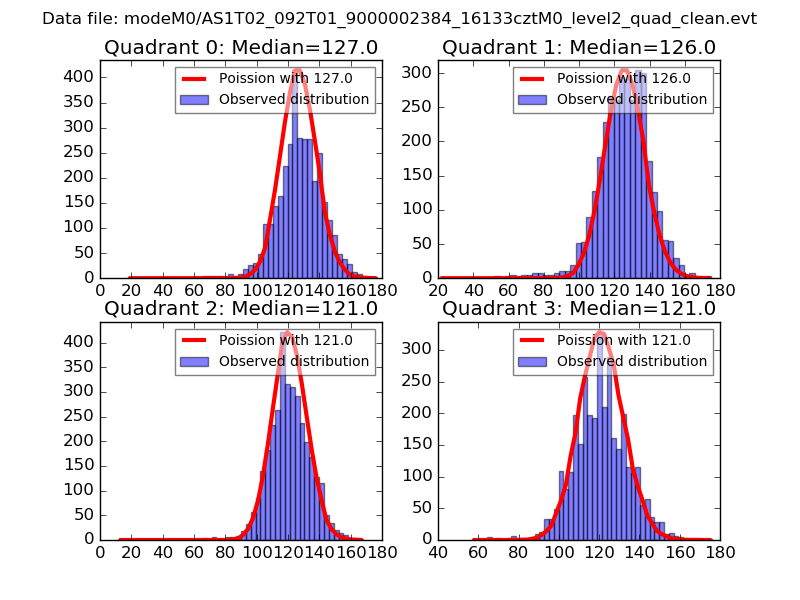 |
 |
| Quadrant-wise count rates Data is divided into 100 sec bins |
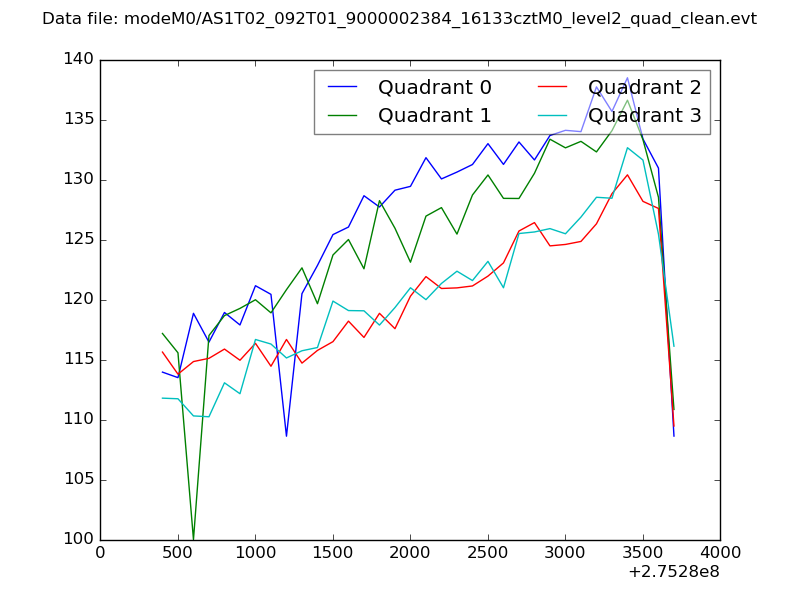 |
|
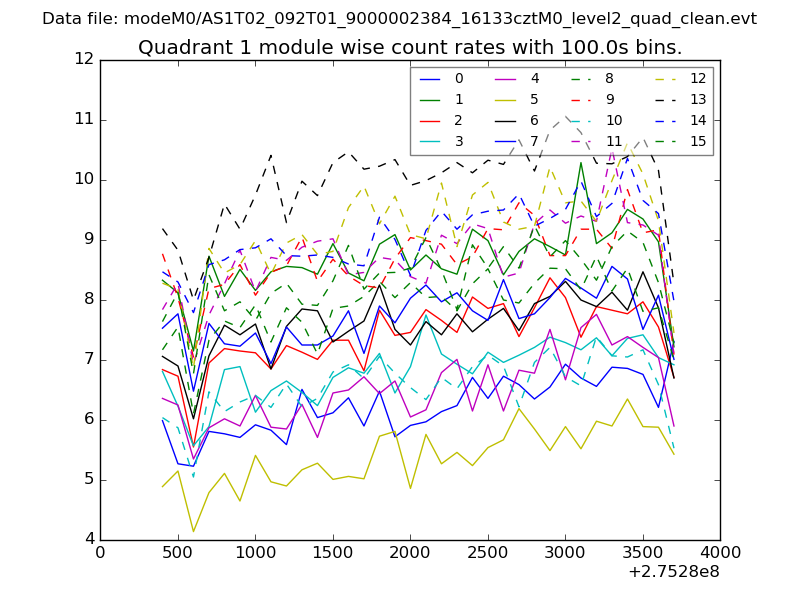
| Module-wise count rates for Quadrant A Data is divided into 100 sec bins |
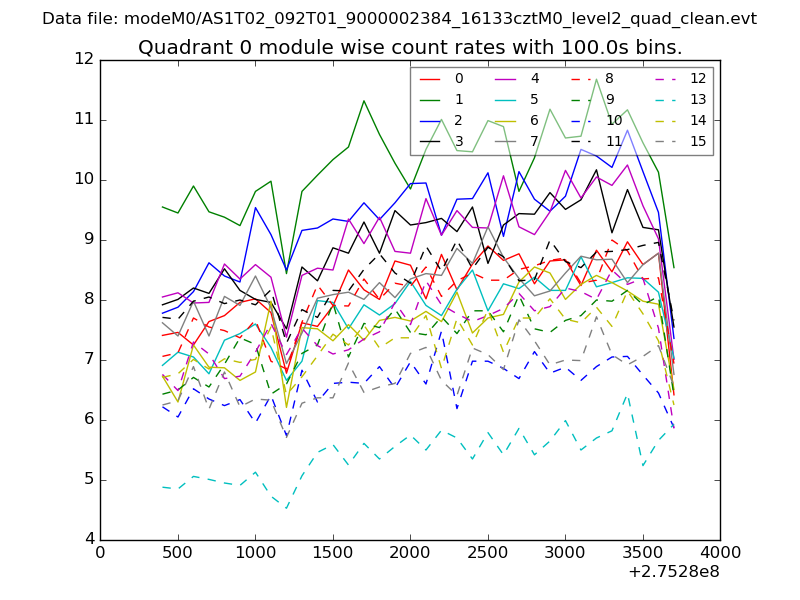 |
 |
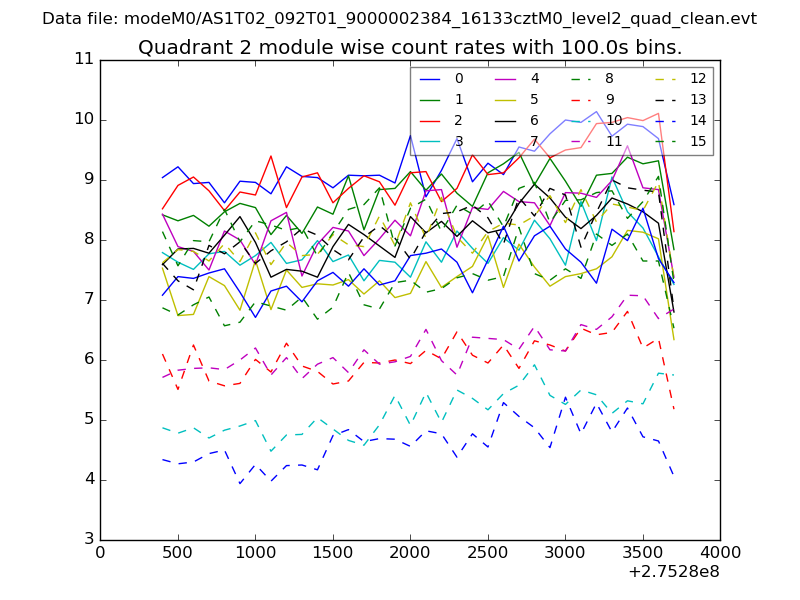
| Module-wise count rates for Quadrant B Data is divided into 100 sec bins |
 |
 |
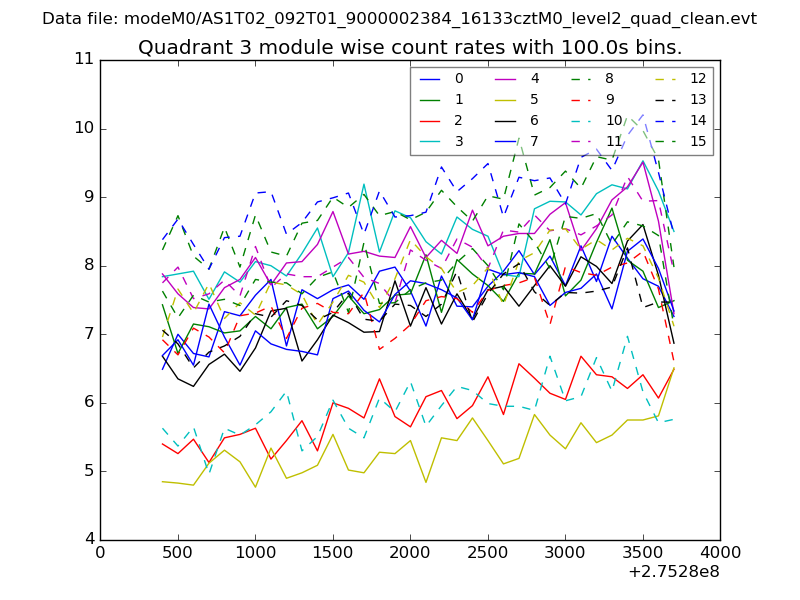
| Module-wise count rates for Quadrant C Data is divided into 100 sec bins |
 |
 |
| Module-wise count rates for Quadrant D Data is divided into 100 sec bins |
 |
 |
| Parameter | Plot |
|---|---|
| CZT HV Monitor | 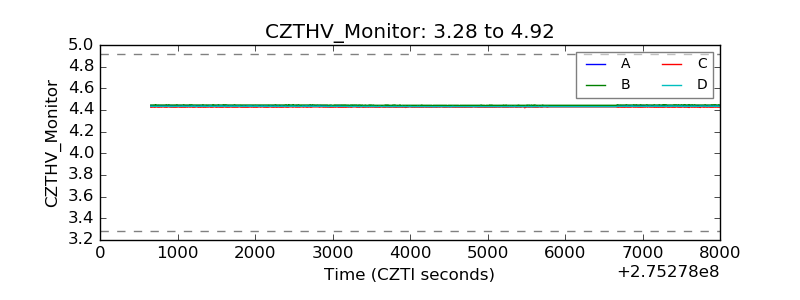 |
| D_VDD | 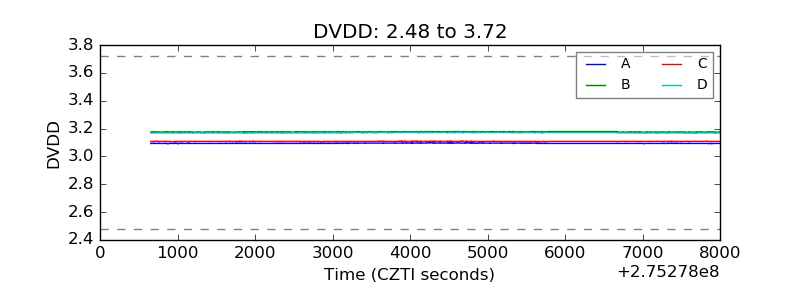 |
| Temperature 1 | 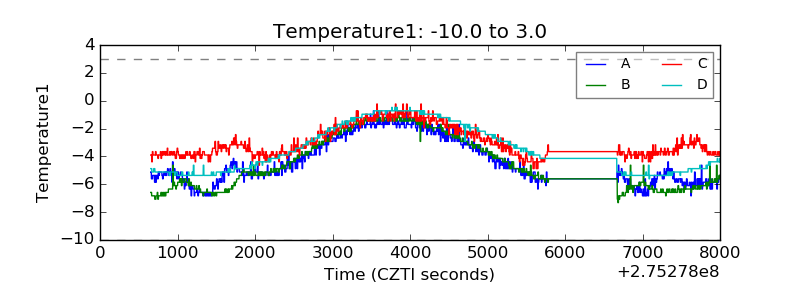 |
| Veto HV Monitor | 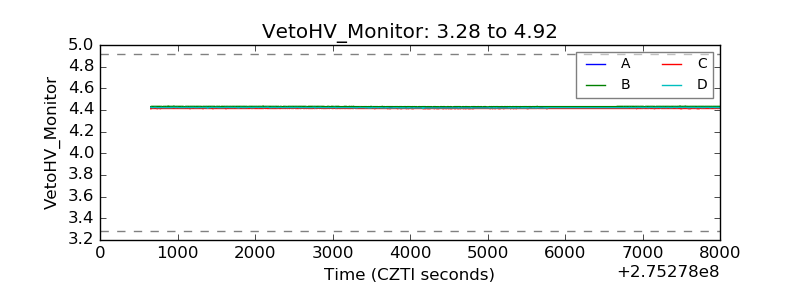 |
| Veto LLD | 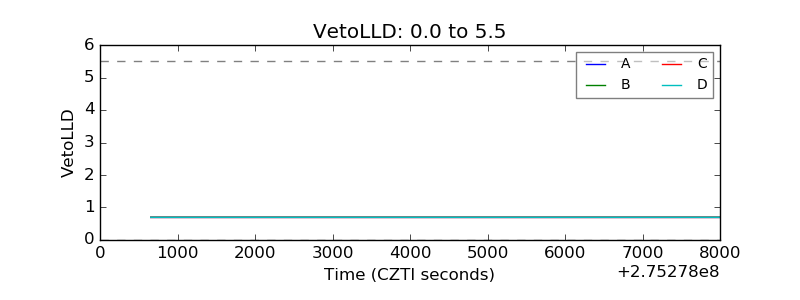 |
| Alpha Counter | 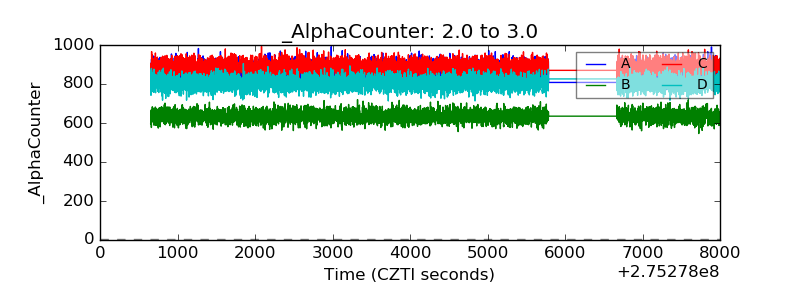 |
| _CPM_Rate | 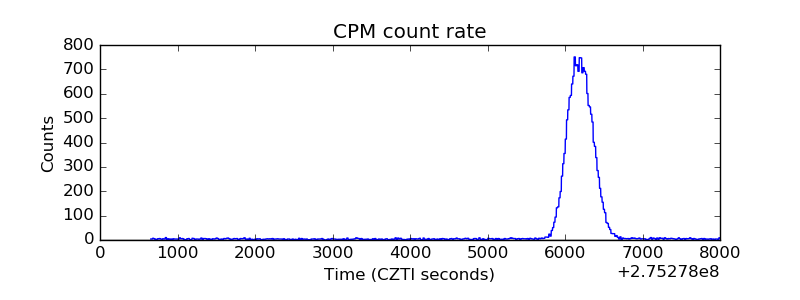 |
| CZT Counter |  |
| +2.5 Volts monitor |  |
| +5 Volts monitor |  |
| _ROLL_ROT | 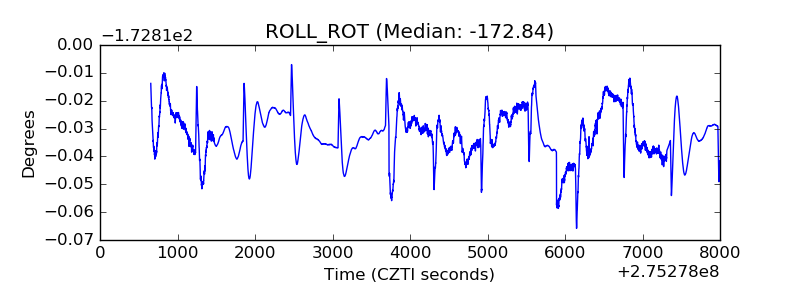 |
| _Roll_DEC | 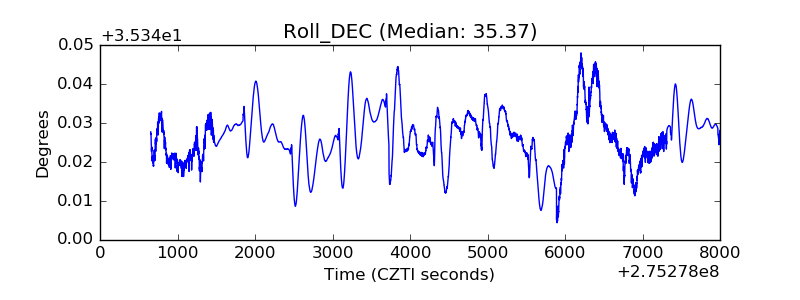 |
| _Roll_RA | 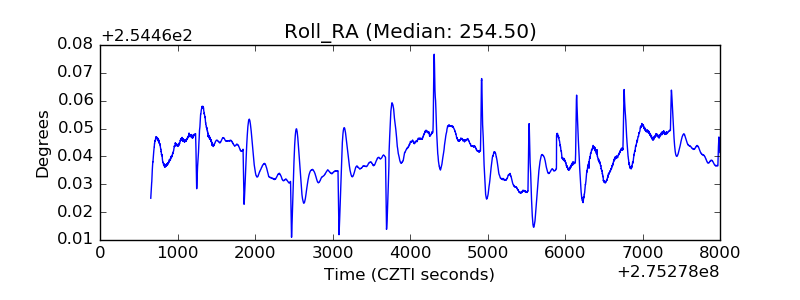 |
| Veto Counter | 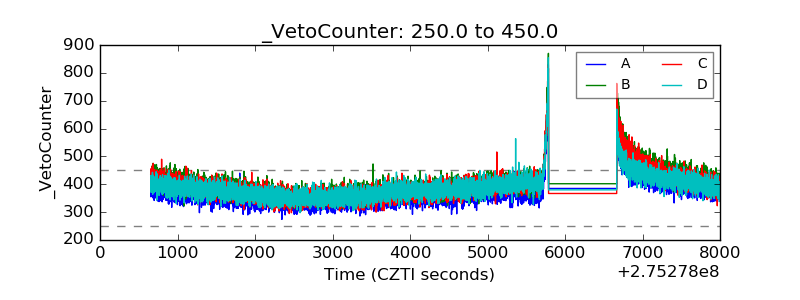 |