| Param | Original file | Final file |
|---|---|---|
| Filename | modeM0/AS1T02_092T01_9000002384_16134cztM0_level2.evt | modeM0/AS1T02_092T01_9000002384_16134cztM0_level2_quad_clean.evt |
| Size (bytes) | 477,031,680 | 79,704,000 |
| Size | 454.9 MB | 76.0 MB |
| Events in quadrant A | 3,807,439 | 498,920 |
| Events in quadrant B | 3,578,632 | 498,043 |
| Events in quadrant C | 3,354,639 | 474,230 |
| Events in quadrant D | 3,255,503 | 479,680 |
| Mode SS | |||
|---|---|---|---|
| Quadrant | BADHDUFLAG | Total packets | Discarded packets |
| A | 0 | 134 | 0 |
| B | 0 | 134 | 0 |
| C | 0 | 134 | 0 |
| D | 0 | 134 | 0 |
| Mode M0 | |||
|---|---|---|---|
| Quadrant | BADHDUFLAG | Total packets | Discarded packets |
| A | 0 | 15270 | 3 |
| B | 0 | 14734 | 2 |
| C | 0 | 14079 | 2 |
| D | 0 | 13939 | 2 |
| Mode M9 | |||
|---|---|---|---|
| Quadrant | BADHDUFLAG | Total packets | Discarded packets |
| A | 0 | 16 | 0 |
| B | 0 | 16 | 0 |
| C | 0 | 16 | 0 |
| D | 0 | 17 | 0 |
| Quadrant | Total seconds | Saturated seconds | Saturation percentage |
|---|---|---|---|
| A | 6637 | 241 | 3.631159% |
| B | 6637 | 118 | 1.777912% |
| C | 6637 | 105 | 1.582040% |
| D | 6637 | 70 | 1.054693% |
Noise dominated data is calculated using 1-second bins in cleaned event files. If a bin has >2000 counts, and if more than 50% of those come from <1% of pixels, then it is considered to be noise-dominated and hence unusable.
| Quadrant | # 1 sec bins | Bins with >0 counts | Bins with >2000 counts | High rate bins dominated by noise | Noise dominated (total time) | Noise dominated (detector-on time) | Marked lightcurve |
|---|---|---|---|---|---|---|---|
| A | 7613 | 6639 | 127 | 127 | 1.67% | 1.91% | 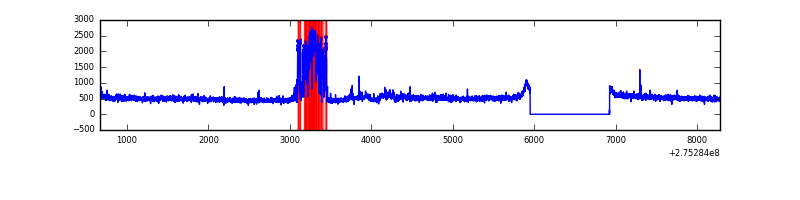 |
| B | 7613 | 6639 | 10 | 10 | 0.13% | 0.15% | 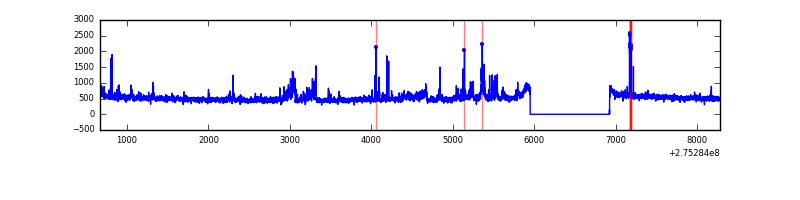 |
| C | 7613 | 6639 | 0 | 0 | 0.00% | 0.00% | 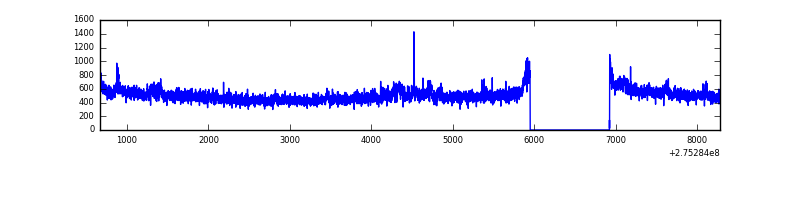 |
| D | 7613 | 6639 | 9 | 9 | 0.12% | 0.14% | 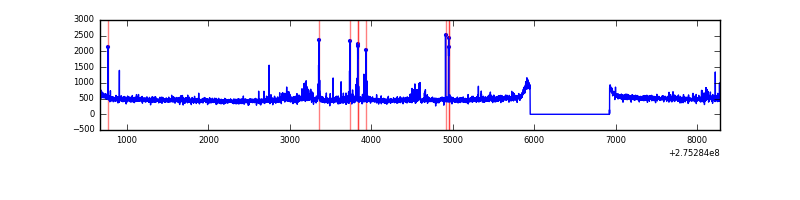 |
Top three noisy pixels from each quadrant. If the there are fewer than three noisy pixels in the level2.evt file, extra rows are filled as -1
| Pixel properties | Quadrant properties | ||||||
|---|---|---|---|---|---|---|---|
| Quadrant | DetID | PixID | Counts | Sigma | Mean | Median | Sigma |
| A | 15 | 174 | 471725 | 2797.5 | 830 | 812 | 168.3 |
| A | 0 | 253 | 121059 | 714.34 | 830 | 812 | 168.3 |
| A | 8 | 247 | 11849 | 65.57 | 830 | 812 | 168.3 |
| B | 0 | 189 | 162967 | 1027.01 | 831 | 812 | 157.9 |
| B | 4 | 173 | 55405 | 345.77 | 831 | 812 | 157.9 |
| B | 0 | 197 | 46280 | 287.97 | 831 | 812 | 157.9 |
| C | 3 | 233 | 124772 | 667.84 | 789 | 793 | 185.6 |
| C | 14 | 238 | 122010 | 652.97 | 789 | 793 | 185.6 |
| C | 3 | 9 | 16768 | 86.05 | 789 | 793 | 185.6 |
| D | 1 | 52 | 143604 | 723.59 | 808 | 786 | 197.4 |
| D | 2 | 234 | 26489 | 130.22 | 808 | 786 | 197.4 |
| D | 10 | 70 | 25326 | 124.33 | 808 | 786 | 197.4 |
Histogram calculated using DETX and DETY for each event in the final _common_clean file
| Quadrant A |  |
 |
Quadrant B |
|---|---|---|---|
| Quadrant D | 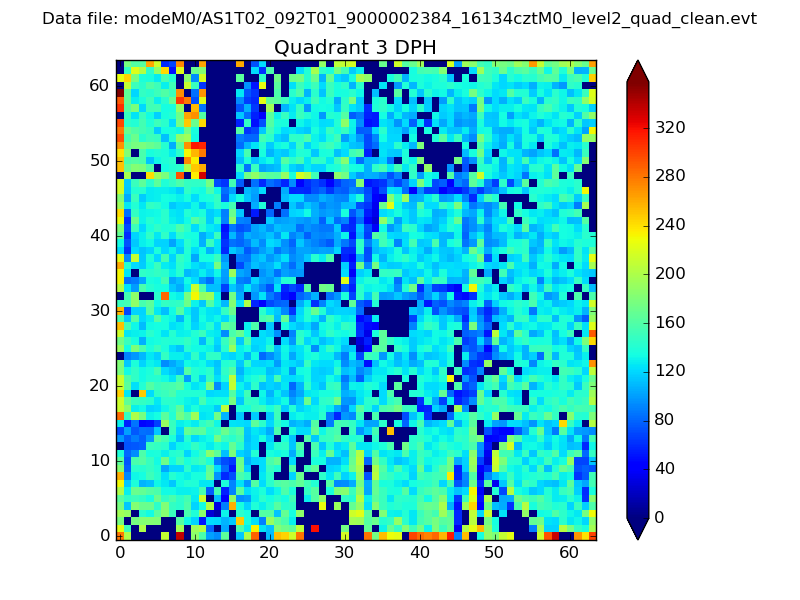 |
 |
Quadrant C |
| Plot type | Count rate plots | Images |
|---|---|---|
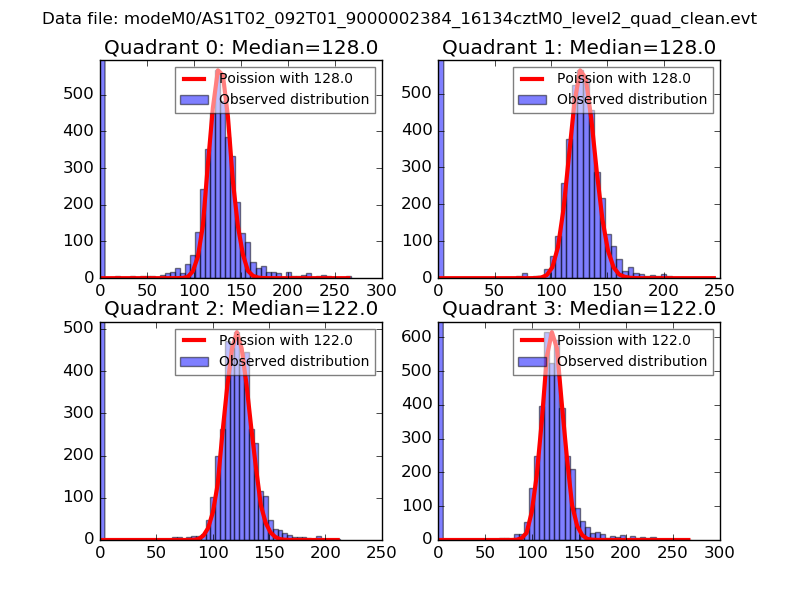
| Comparison with Poisson distribution Blue bars denote a histogram of data divided into 1 sec bins. Red curve is a Poisson curve with rate = median count rate of data. |
 |
 |
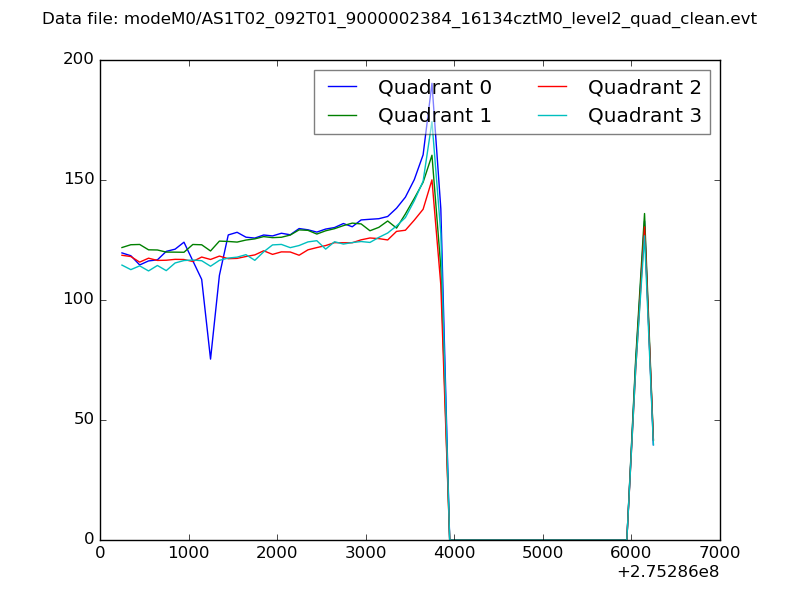
| Quadrant-wise count rates Data is divided into 100 sec bins |
 |
|
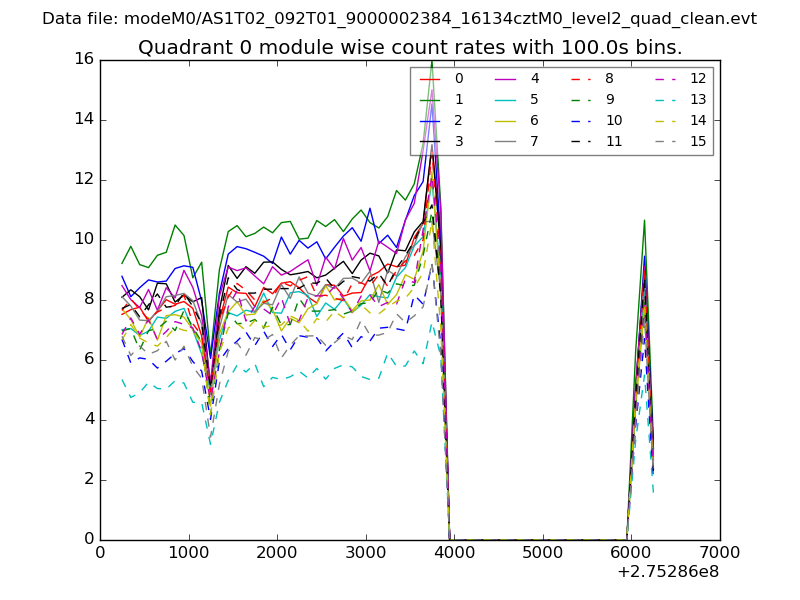
| Module-wise count rates for Quadrant A Data is divided into 100 sec bins |
 |
 |
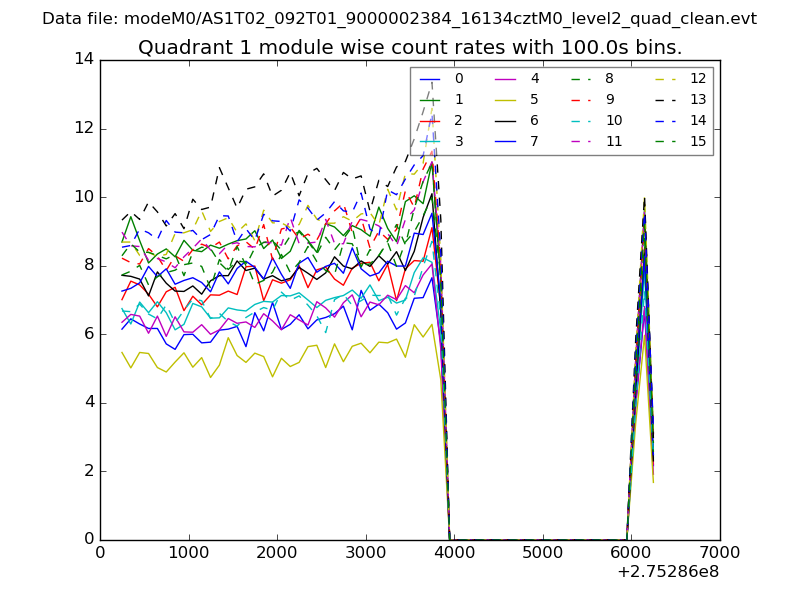
| Module-wise count rates for Quadrant B Data is divided into 100 sec bins |
 |
 |
| Module-wise count rates for Quadrant C Data is divided into 100 sec bins |
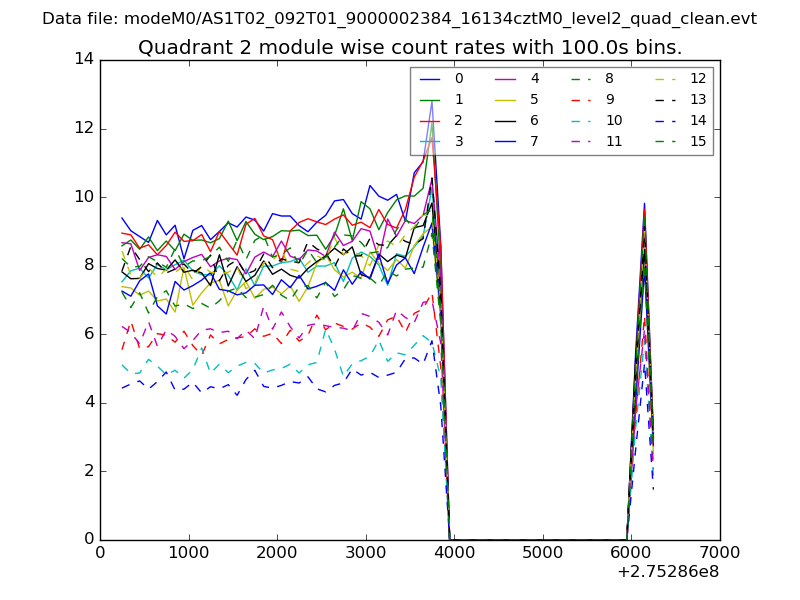 |
 |
| Module-wise count rates for Quadrant D Data is divided into 100 sec bins |
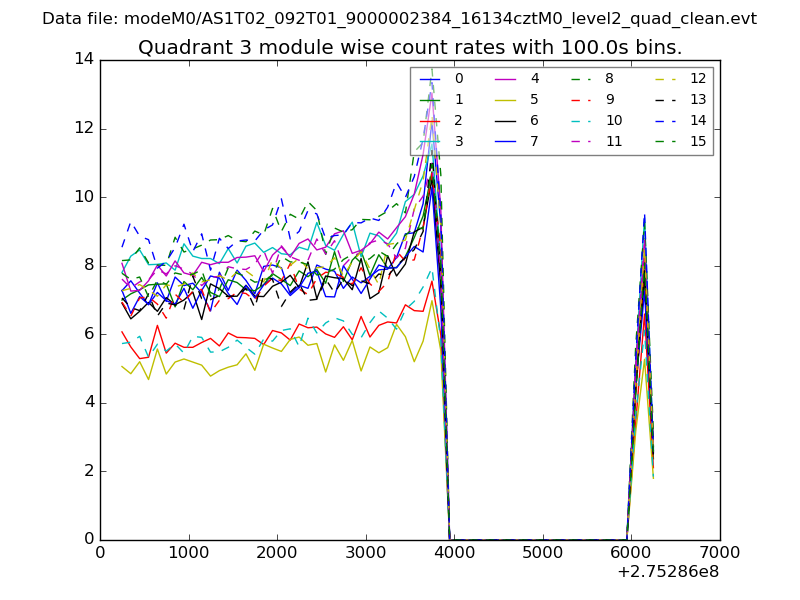 |
 |
| Parameter | Plot |
|---|---|
| CZT HV Monitor | 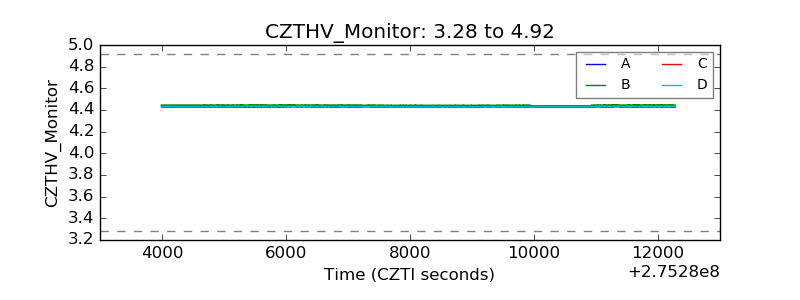 |
| D_VDD | 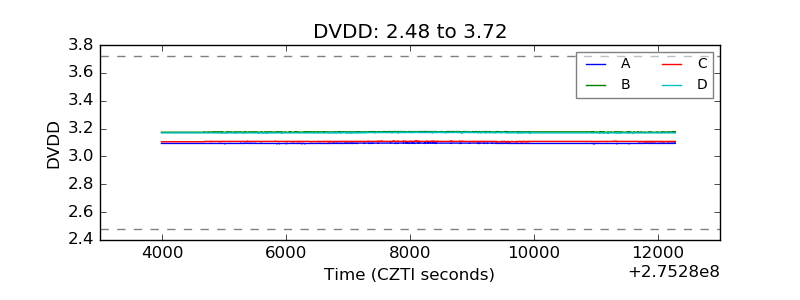 |
| Temperature 1 | 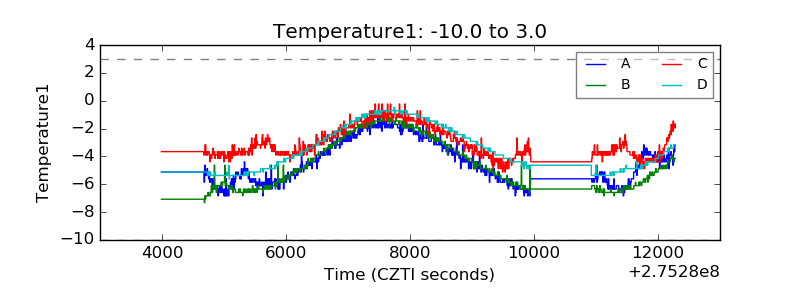 |
| Veto HV Monitor | 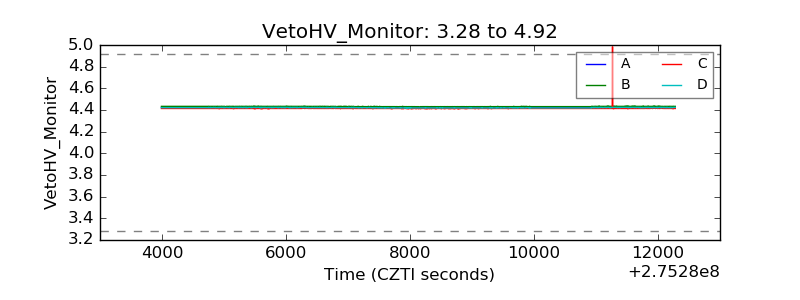 |
| Veto LLD |  |
| Alpha Counter | 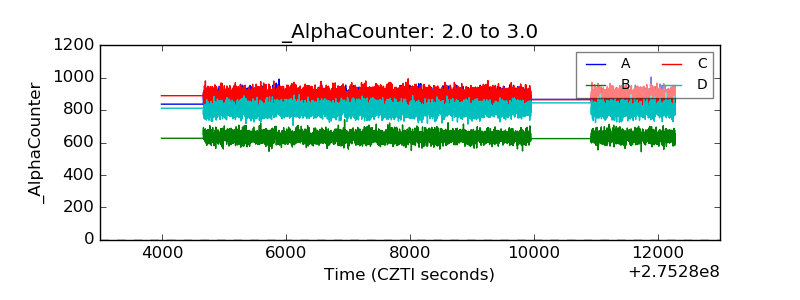 |
| _CPM_Rate | 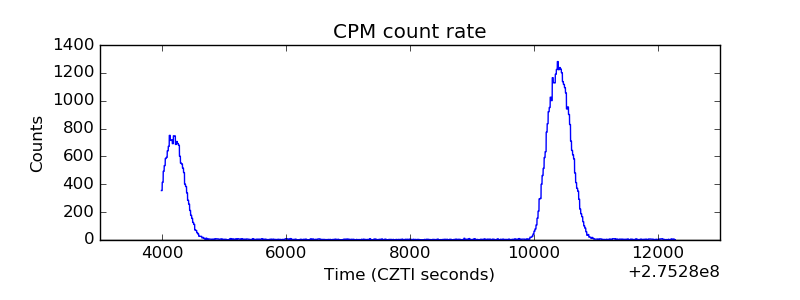 |
| CZT Counter | 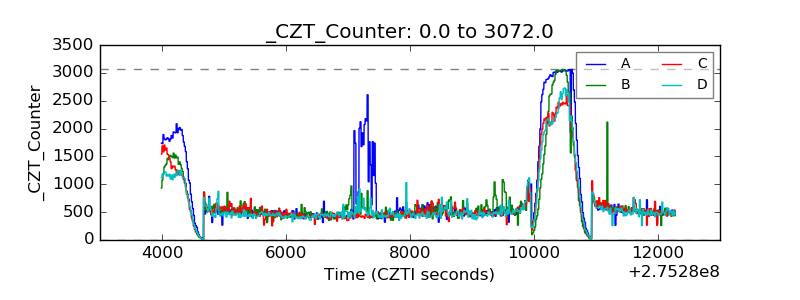 |
| +2.5 Volts monitor |  |
| +5 Volts monitor | 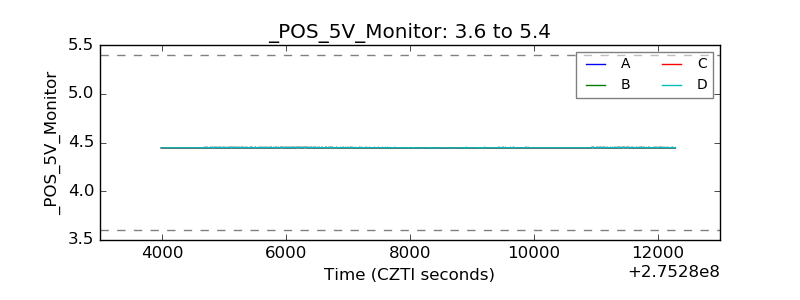 |
| _ROLL_ROT | 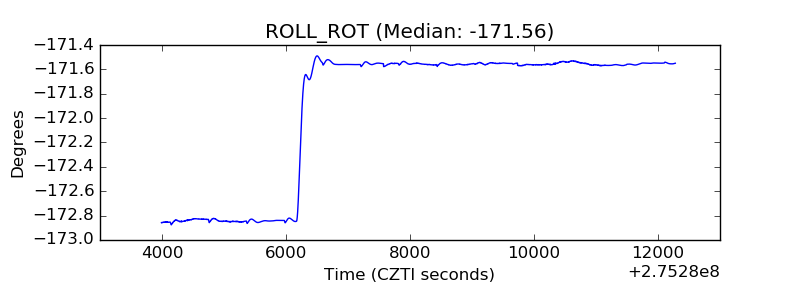 |
| _Roll_DEC | 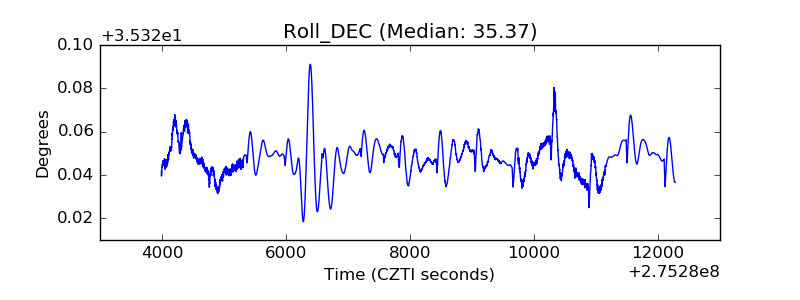 |
| _Roll_RA | 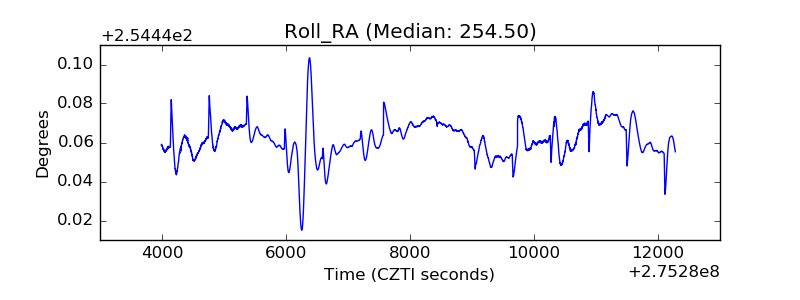 |
| Veto Counter | 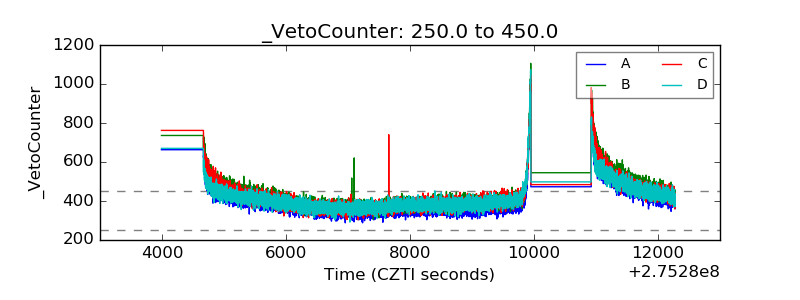 |