| Param | Original file | Final file |
|---|---|---|
| Filename | modeM0/AS1T02_092T01_9000002384_16137cztM0_level2.evt | modeM0/AS1T02_092T01_9000002384_16137cztM0_level2_quad_clean.evt |
| Size (bytes) | 542,681,280 | 98,556,480 |
| Size | 517.5 MB | 94.0 MB |
| Events in quadrant A | 3,577,147 | 661,817 |
| Events in quadrant B | 4,063,219 | 658,379 |
| Events in quadrant C | 3,326,189 | 619,541 |
| Events in quadrant D | 5,036,054 | 599,834 |
| Mode SS | |||
|---|---|---|---|
| Quadrant | BADHDUFLAG | Total packets | Discarded packets |
| A | 0 | 128 | 0 |
| B | 0 | 128 | 0 |
| C | 0 | 128 | 0 |
| D | 0 | 128 | 0 |
| Mode M0 | |||
|---|---|---|---|
| Quadrant | BADHDUFLAG | Total packets | Discarded packets |
| A | 0 | 14706 | 3 |
| B | 0 | 16197 | 2 |
| C | 0 | 13739 | 2 |
| D | 0 | 19129 | 2 |
| Mode M9 | |||
|---|---|---|---|
| Quadrant | BADHDUFLAG | Total packets | Discarded packets |
| A | 0 | 15 | 0 |
| B | 0 | 15 | 0 |
| C | 0 | 15 | 0 |
| D | 0 | 16 | 0 |
| Quadrant | Total seconds | Saturated seconds | Saturation percentage |
|---|---|---|---|
| A | 6385 | 174 | 2.725137% |
| B | 6385 | 252 | 3.946750% |
| C | 6385 | 137 | 2.145654% |
| D | 6385 | 435 | 6.812843% |
Noise dominated data is calculated using 1-second bins in cleaned event files. If a bin has >2000 counts, and if more than 50% of those come from <1% of pixels, then it is considered to be noise-dominated and hence unusable.
| Quadrant | # 1 sec bins | Bins with >0 counts | Bins with >2000 counts | High rate bins dominated by noise | Noise dominated (total time) | Noise dominated (detector-on time) | Marked lightcurve |
|---|---|---|---|---|---|---|---|
| A | 7566 | 6387 | 49 | 49 | 0.65% | 0.77% | 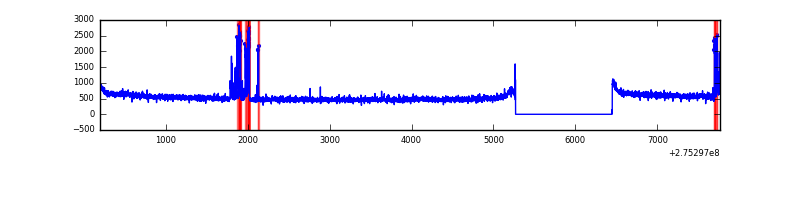 |
| B | 7566 | 6387 | 118 | 118 | 1.56% | 1.85% | 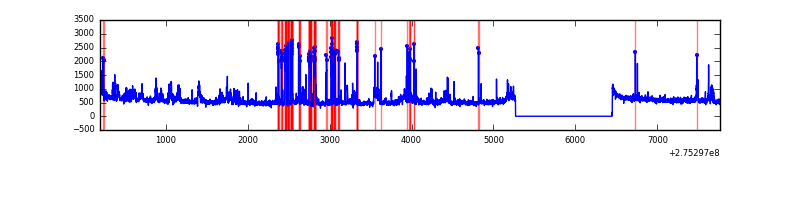 |
| C | 7566 | 6387 | 3 | 3 | 0.04% | 0.05% | 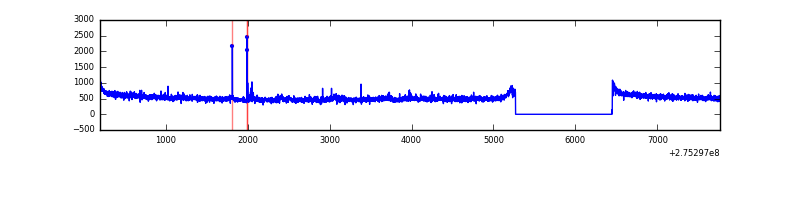 |
| D | 7566 | 6387 | 330 | 330 | 4.36% | 5.17% | 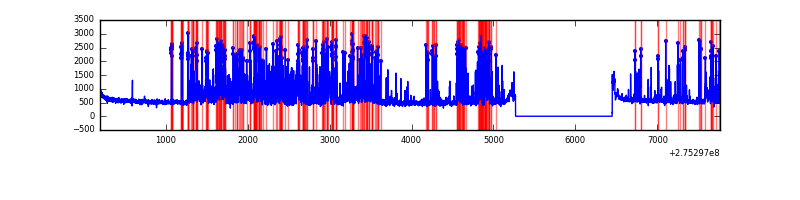 |
Top three noisy pixels from each quadrant. If the there are fewer than three noisy pixels in the level2.evt file, extra rows are filled as -1
| Pixel properties | Quadrant properties | ||||||
|---|---|---|---|---|---|---|---|
| Quadrant | DetID | PixID | Counts | Sigma | Mean | Median | Sigma |
| A | 15 | 174 | 216812 | 1256.81 | 857 | 841 | 171.8 |
| A | 15 | 223 | 34100 | 193.54 | 857 | 841 | 171.8 |
| A | 8 | 247 | 21339 | 119.28 | 857 | 841 | 171.8 |
| B | 5 | 65 | 518984 | 3300.09 | 842 | 824 | 157.0 |
| B | 0 | 189 | 73106 | 460.35 | 842 | 824 | 157.0 |
| B | 4 | 173 | 60567 | 380.49 | 842 | 824 | 157.0 |
| C | 14 | 238 | 125389 | 671.5 | 798 | 805 | 185.5 |
| C | 3 | 233 | 56582 | 300.63 | 798 | 805 | 185.5 |
| C | 0 | 207 | 21931 | 113.87 | 798 | 805 | 185.5 |
| D | 1 | 52 | 1878972 | 9570.42 | 809 | 785 | 196.2 |
| D | 7 | 38 | 28737 | 142.43 | 809 | 785 | 196.2 |
| D | 2 | 234 | 24219 | 119.41 | 809 | 785 | 196.2 |
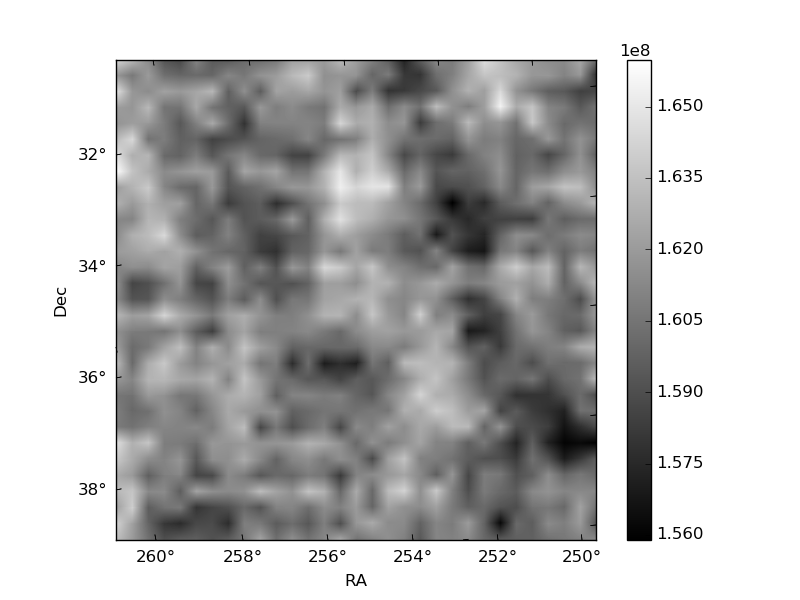
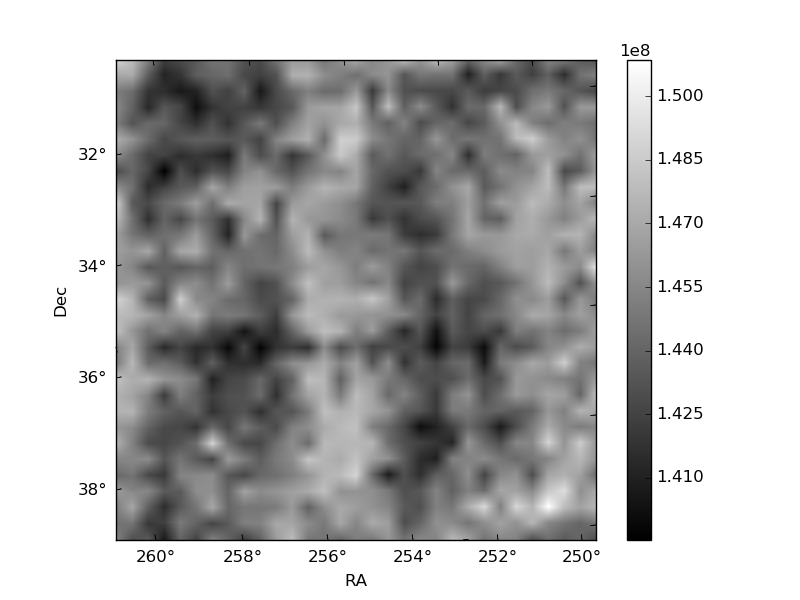
Histogram calculated using DETX and DETY for each event in the final _common_clean file
| Quadrant A | 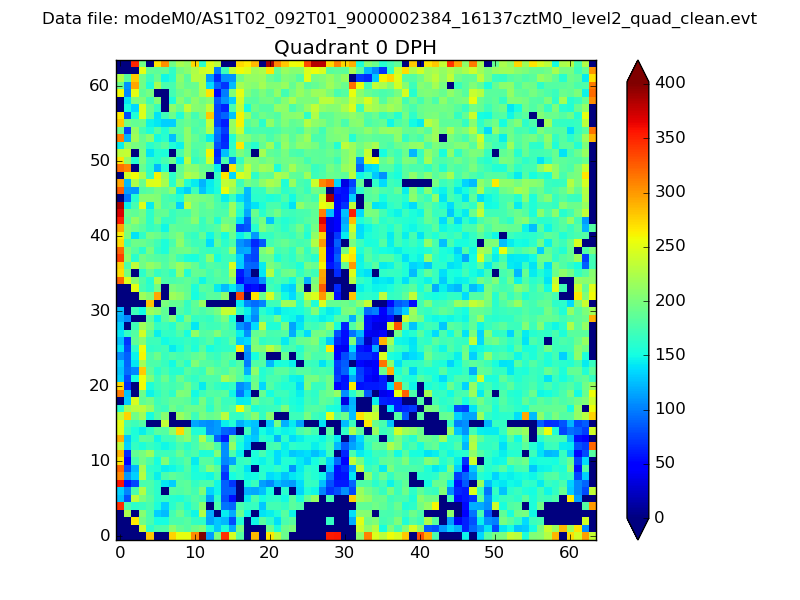 |
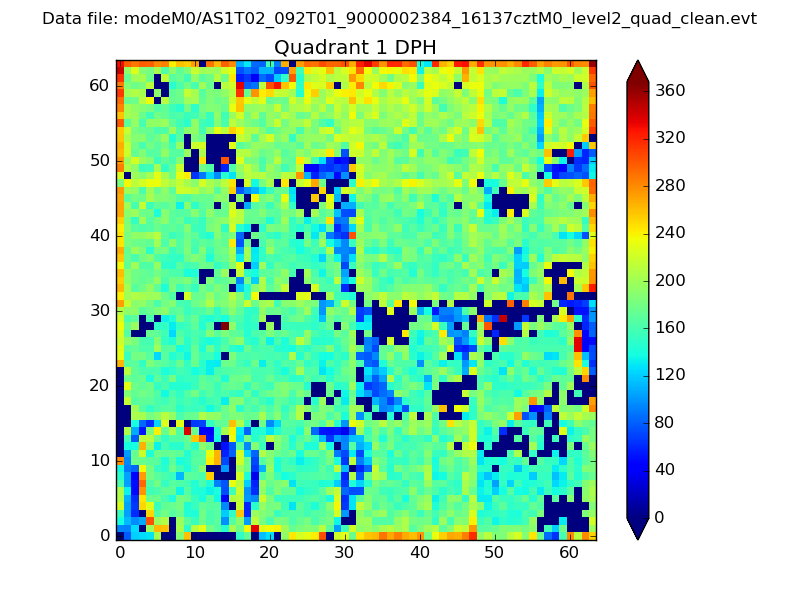 |
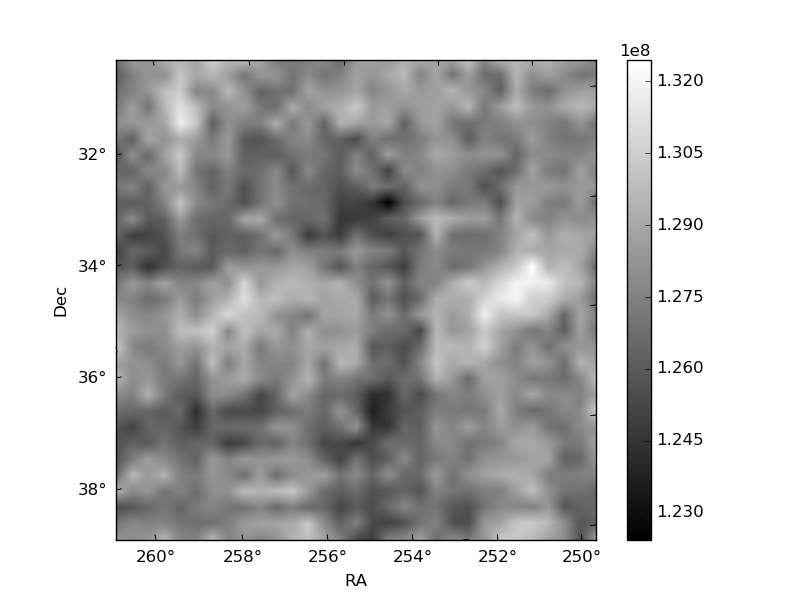
Quadrant B |
|---|---|---|---|
| Quadrant D | 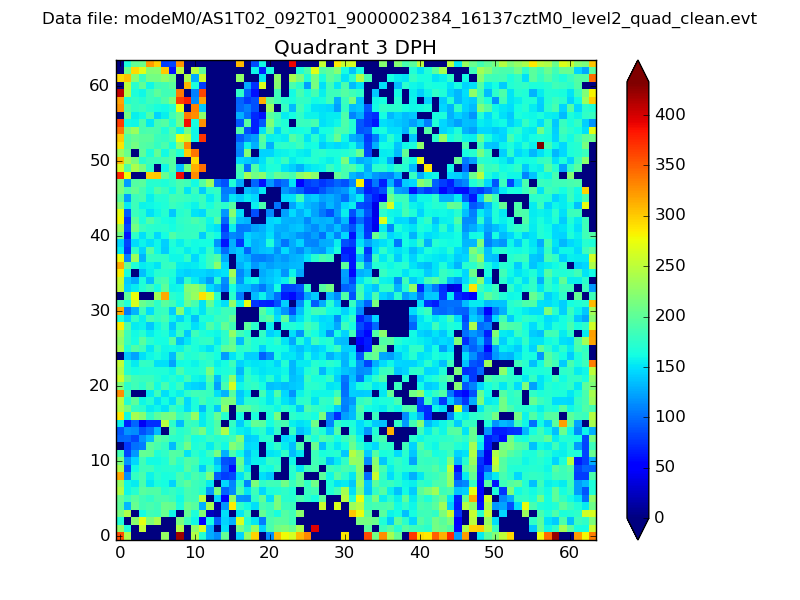 |
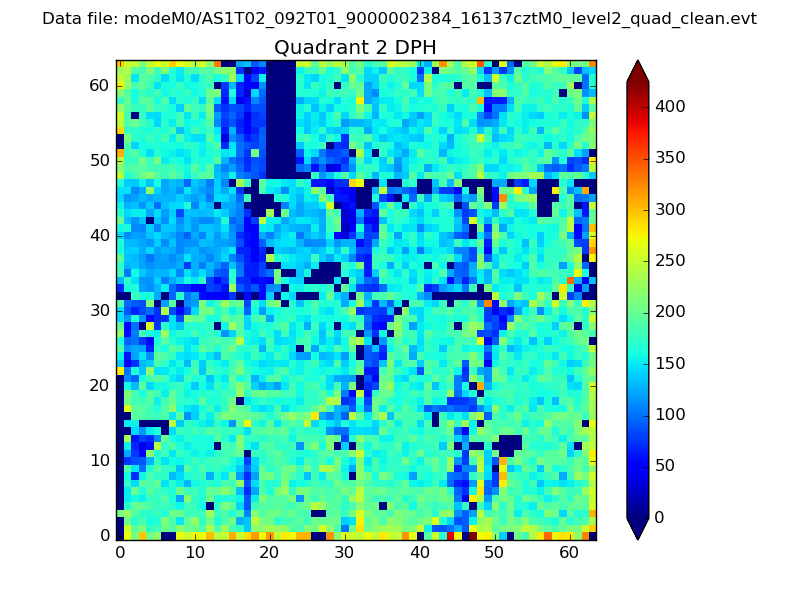 |
Quadrant C |
| Plot type | Count rate plots | Images |
|---|---|---|
| Comparison with Poisson distribution Blue bars denote a histogram of data divided into 1 sec bins. Red curve is a Poisson curve with rate = median count rate of data. |
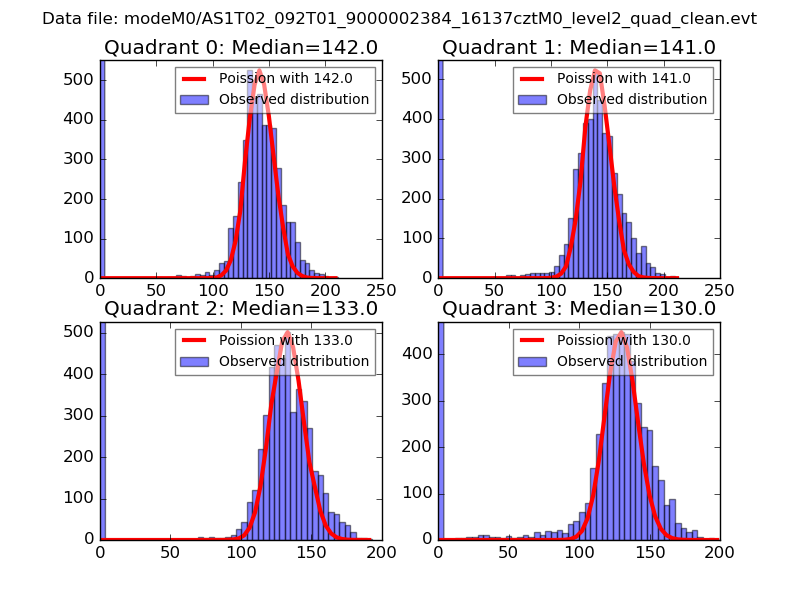 |
 |
| Quadrant-wise count rates Data is divided into 100 sec bins |
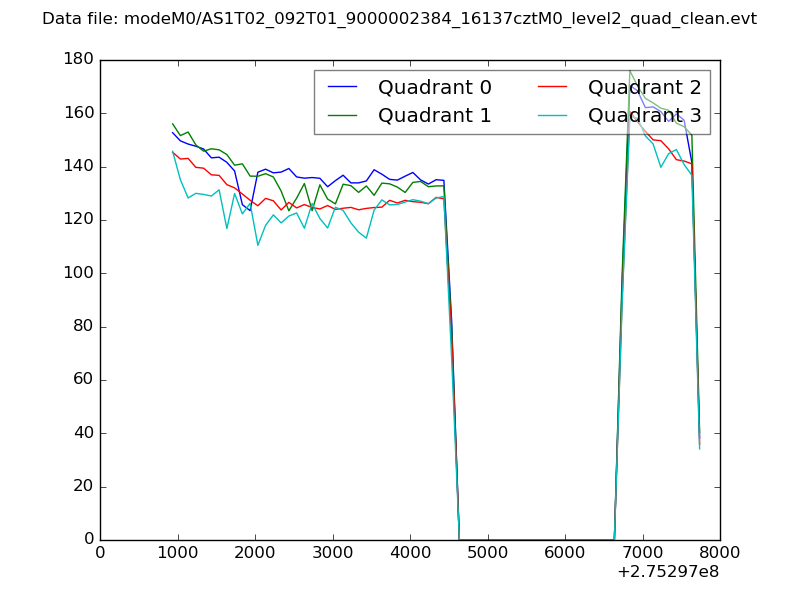 |
|
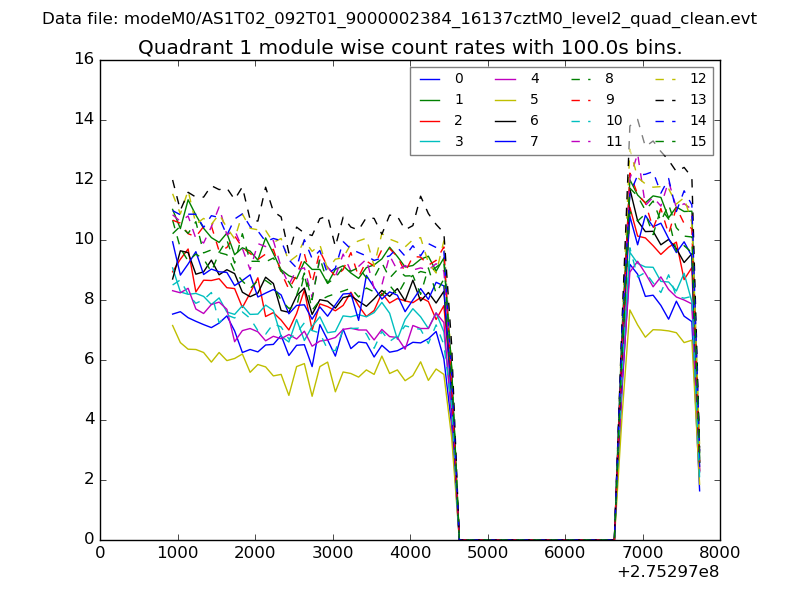
| Module-wise count rates for Quadrant A Data is divided into 100 sec bins |
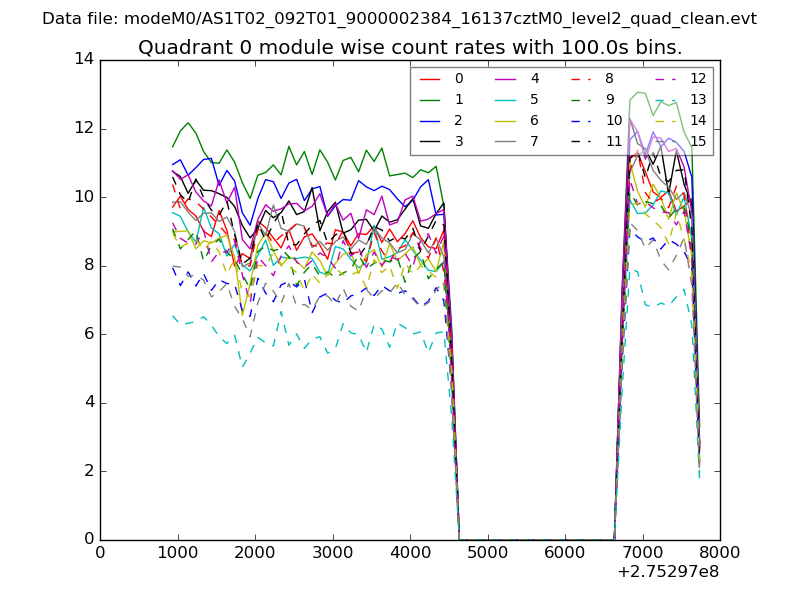 |
 |
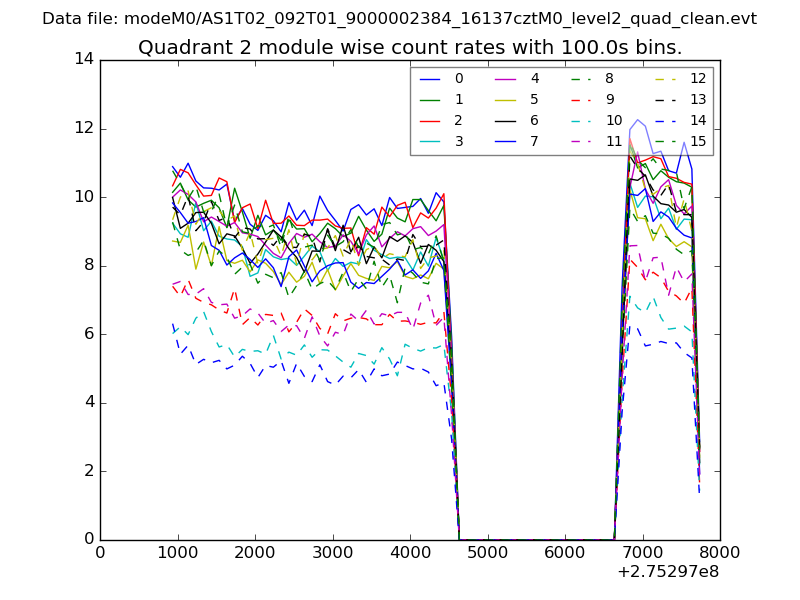
| Module-wise count rates for Quadrant B Data is divided into 100 sec bins |
 |
 |
| Module-wise count rates for Quadrant C Data is divided into 100 sec bins |
 |
 |
| Module-wise count rates for Quadrant D Data is divided into 100 sec bins |
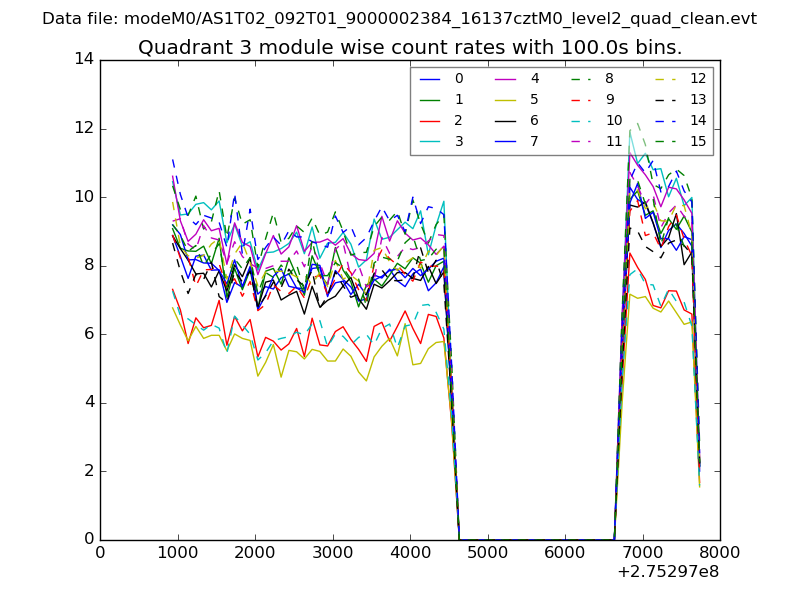 |
 |
| Parameter | Plot |
|---|---|
| CZT HV Monitor | 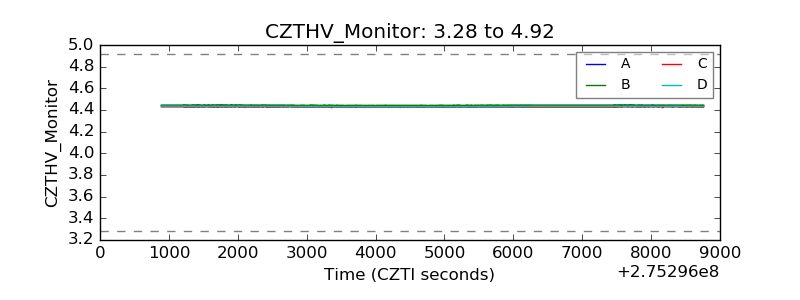 |
| D_VDD | 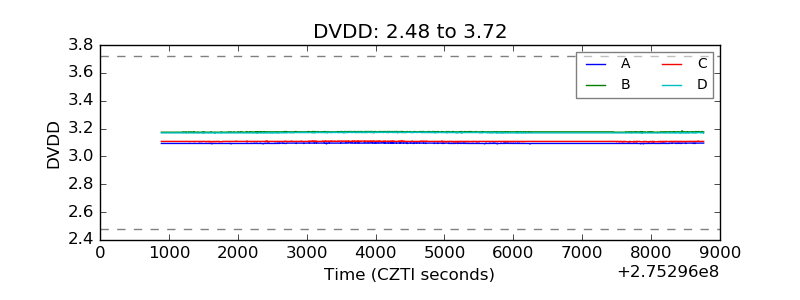 |
| Temperature 1 | 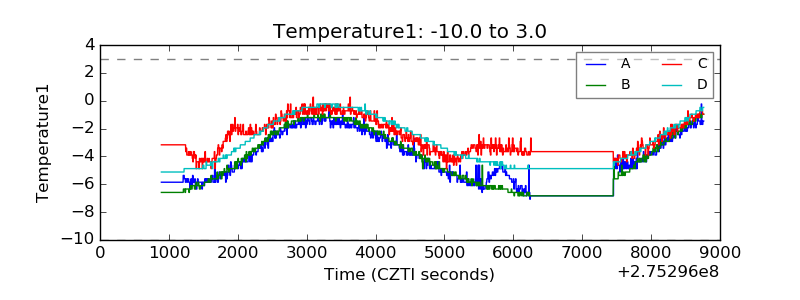 |
| Veto HV Monitor | 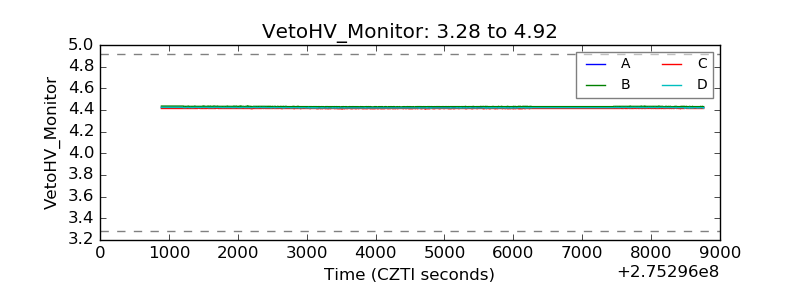 |
| Veto LLD | 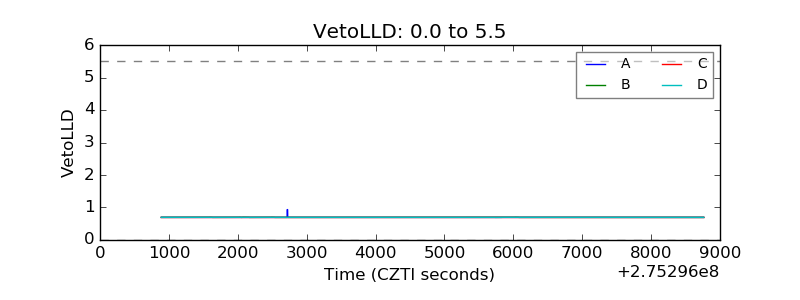 |
| Alpha Counter | 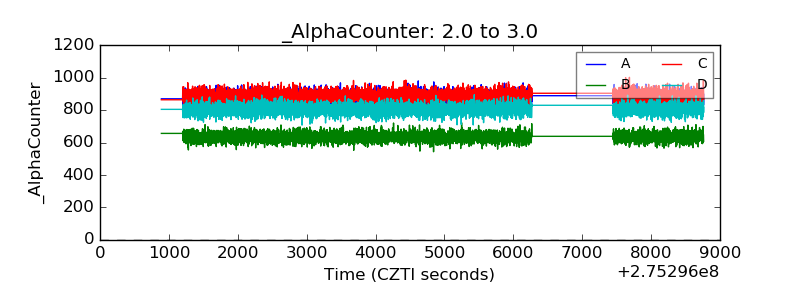 |
| _CPM_Rate | 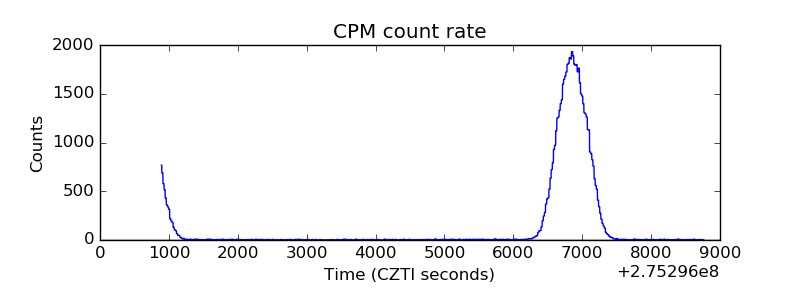 |
| CZT Counter | 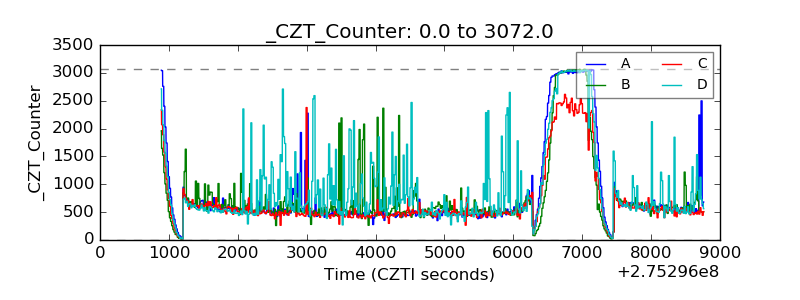 |
| +2.5 Volts monitor |  |
| +5 Volts monitor | 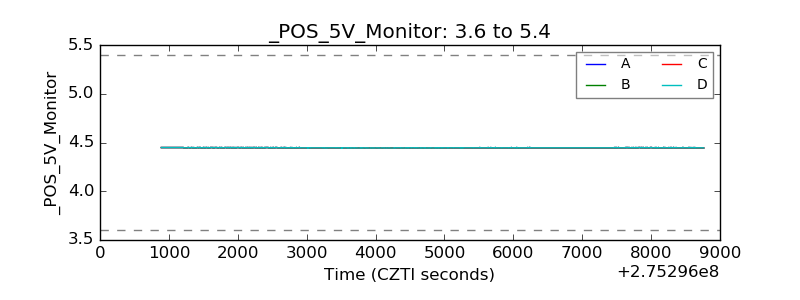 |
| _ROLL_ROT | 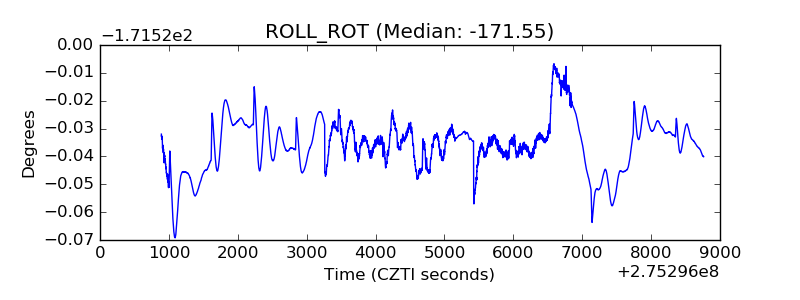 |
| _Roll_DEC | 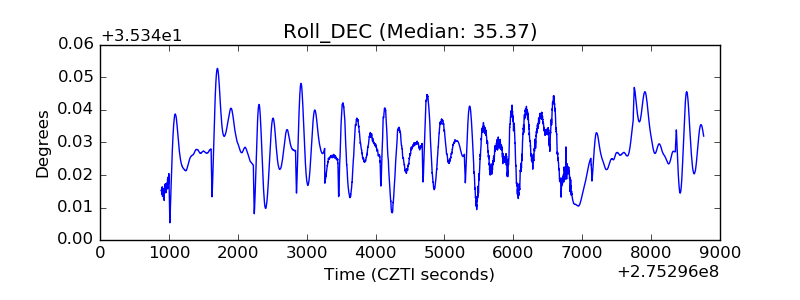 |
| _Roll_RA | 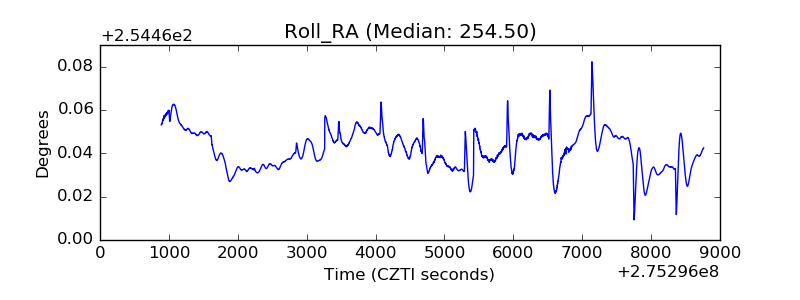 |
| Veto Counter | 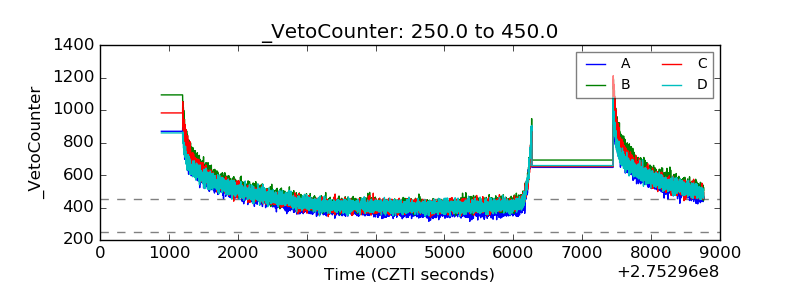 |