| Param | Original file | Final file |
|---|---|---|
| Filename | modeM0/AS1T02_092T01_9000002384_16138cztM0_level2.evt | modeM0/AS1T02_092T01_9000002384_16138cztM0_level2_quad_clean.evt |
| Size (bytes) | 555,624,000 | 108,345,600 |
| Size | 529.9 MB | 103.3 MB |
| Events in quadrant A | 3,809,128 | 748,687 |
| Events in quadrant B | 3,518,133 | 750,702 |
| Events in quadrant C | 3,209,757 | 696,279 |
| Events in quadrant D | 5,868,027 | 650,723 |
| Mode SS | |||
|---|---|---|---|
| Quadrant | BADHDUFLAG | Total packets | Discarded packets |
| A | 0 | 126 | 0 |
| B | 0 | 126 | 0 |
| C | 0 | 126 | 0 |
| D | 0 | 126 | 0 |
| Mode M0 | |||
|---|---|---|---|
| Quadrant | BADHDUFLAG | Total packets | Discarded packets |
| A | 0 | 15265 | 2 |
| B | 0 | 14340 | 1 |
| C | 0 | 13332 | 1 |
| D | 0 | 21573 | 1 |
| Mode M9 | |||
|---|---|---|---|
| Quadrant | BADHDUFLAG | Total packets | Discarded packets |
| A | 0 | 13 | 0 |
| B | 0 | 13 | 0 |
| C | 0 | 13 | 0 |
| D | 0 | 13 | 0 |
| Quadrant | Total seconds | Saturated seconds | Saturation percentage |
|---|---|---|---|
| A | 6231 | 186 | 2.985075% |
| B | 6231 | 124 | 1.990050% |
| C | 6231 | 110 | 1.765367% |
| D | 6231 | 774 | 12.421762% |
Noise dominated data is calculated using 1-second bins in cleaned event files. If a bin has >2000 counts, and if more than 50% of those come from <1% of pixels, then it is considered to be noise-dominated and hence unusable.
| Quadrant | # 1 sec bins | Bins with >0 counts | Bins with >2000 counts | High rate bins dominated by noise | Noise dominated (total time) | Noise dominated (detector-on time) | Marked lightcurve |
|---|---|---|---|---|---|---|---|
| A | 7487 | 6233 | 85 | 85 | 1.14% | 1.36% | 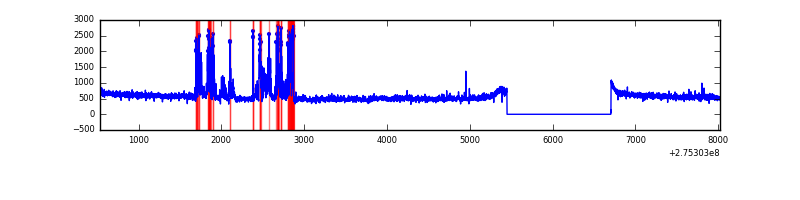 |
| B | 7487 | 6233 | 9 | 9 | 0.12% | 0.14% | 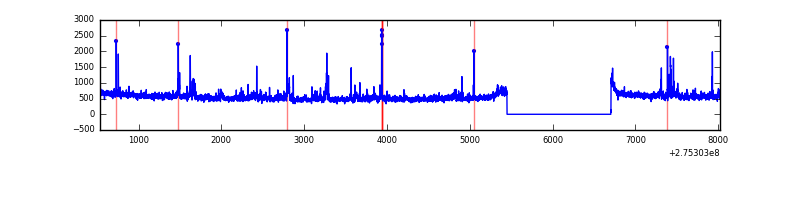 |
| C | 7487 | 6233 | 2 | 2 | 0.03% | 0.03% | 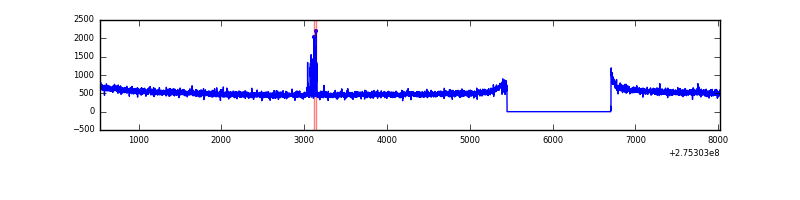 |
| D | 7487 | 6233 | 631 | 631 | 8.43% | 10.12% | 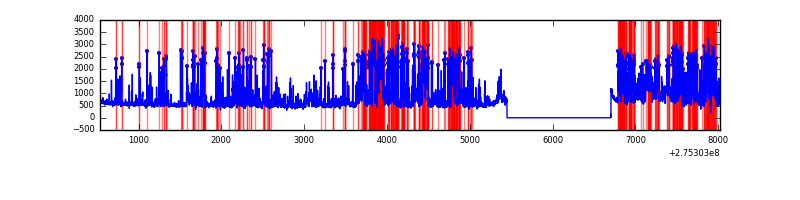 |
Top three noisy pixels from each quadrant. If the there are fewer than three noisy pixels in the level2.evt file, extra rows are filled as -1
| Pixel properties | Quadrant properties | ||||||
|---|---|---|---|---|---|---|---|
| Quadrant | DetID | PixID | Counts | Sigma | Mean | Median | Sigma |
| A | 9 | 143 | 299071 | 1796.36 | 838 | 825 | 166.0 |
| A | 15 | 174 | 181470 | 1088.04 | 838 | 825 | 166.0 |
| A | 0 | 253 | 58249 | 345.87 | 838 | 825 | 166.0 |
| B | 0 | 189 | 74868 | 476.12 | 828 | 810 | 155.5 |
| B | 5 | 65 | 53398 | 338.09 | 828 | 810 | 155.5 |
| B | 3 | 209 | 37513 | 235.97 | 828 | 810 | 155.5 |
| C | 14 | 238 | 124254 | 687.07 | 779 | 787 | 179.7 |
| C | 0 | 207 | 31682 | 171.92 | 779 | 787 | 179.7 |
| C | 3 | 9 | 10670 | 55.0 | 779 | 787 | 179.7 |
| D | 1 | 52 | 2800332 | 15043.05 | 772 | 750 | 186.1 |
| D | 7 | 38 | 70677 | 375.74 | 772 | 750 | 186.1 |
| D | 15 | 0 | 33253 | 174.65 | 772 | 750 | 186.1 |
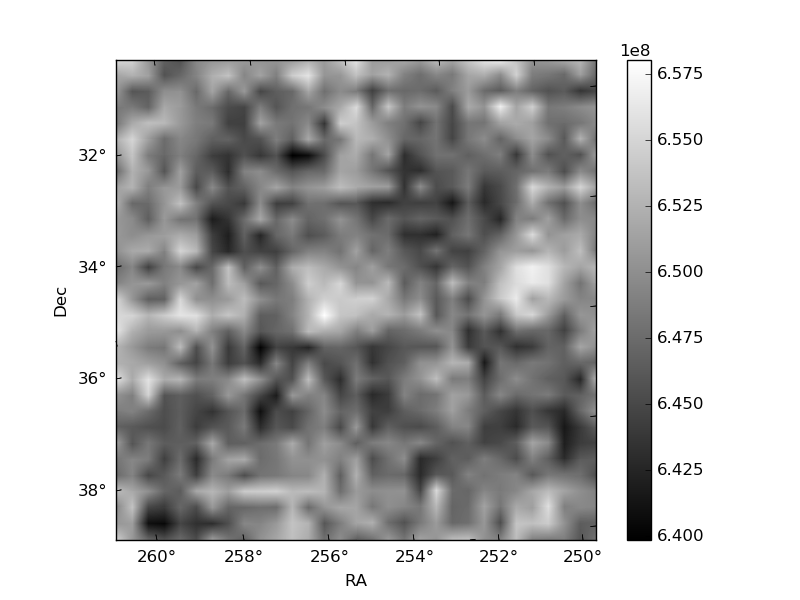
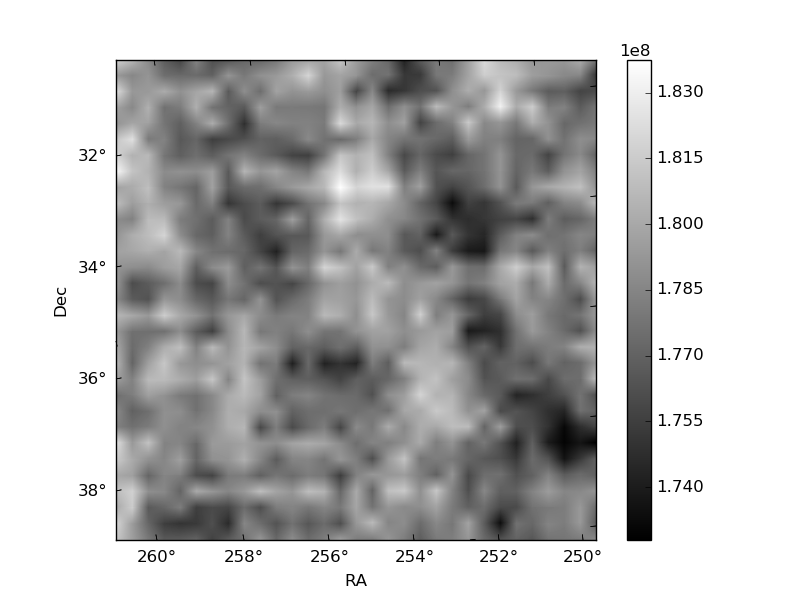
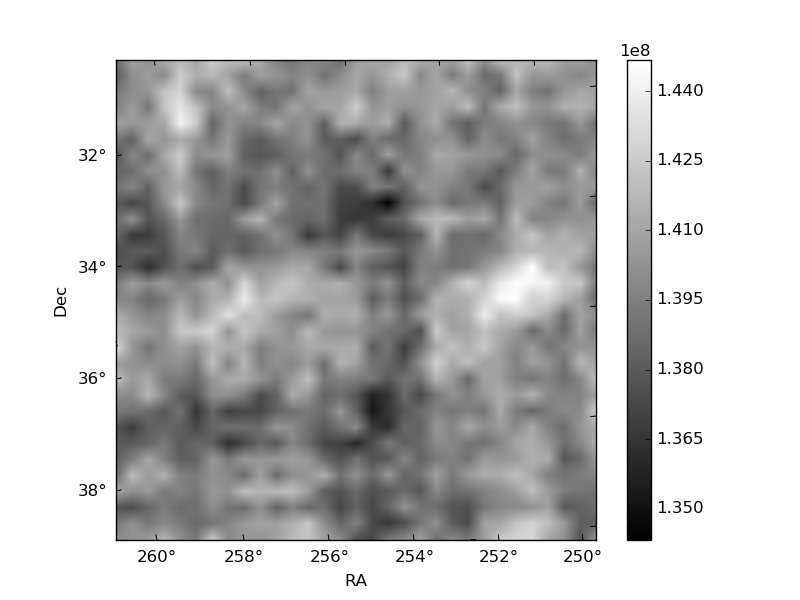
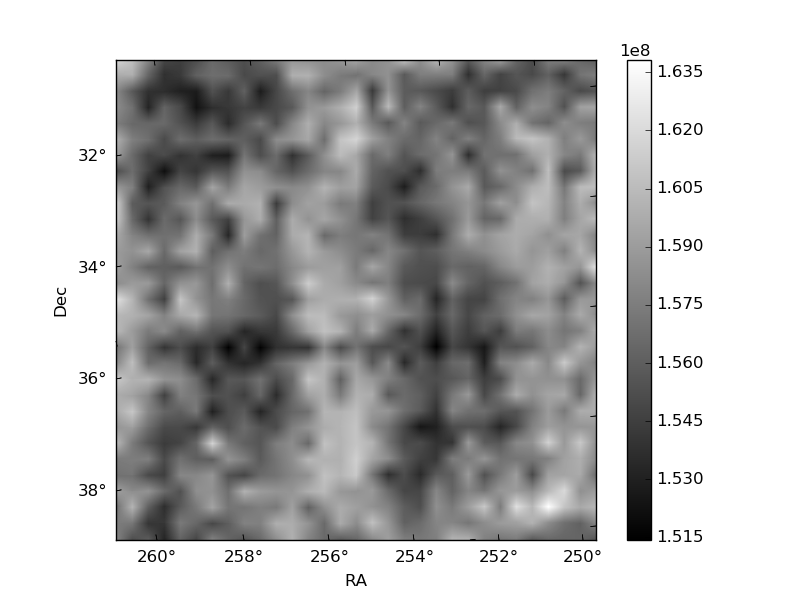
Histogram calculated using DETX and DETY for each event in the final _common_clean file
| Quadrant A |  |
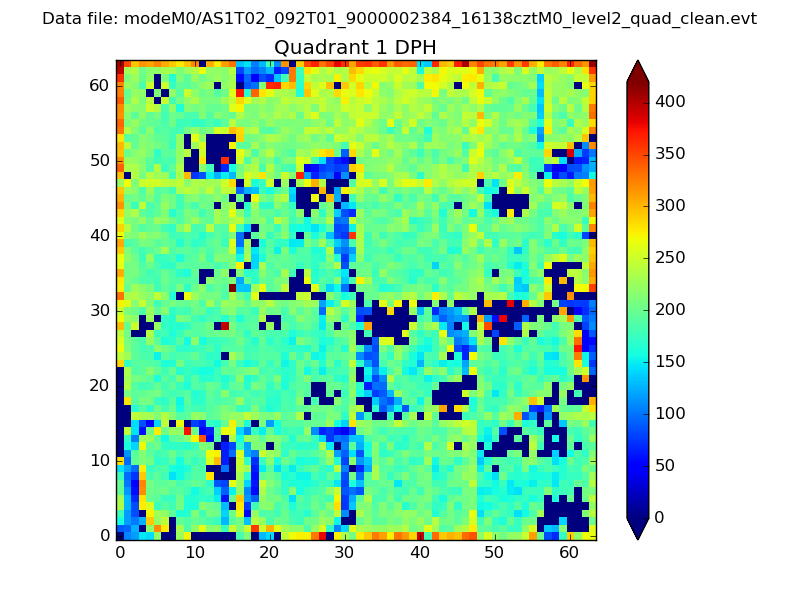 |
Quadrant B |
|---|---|---|---|
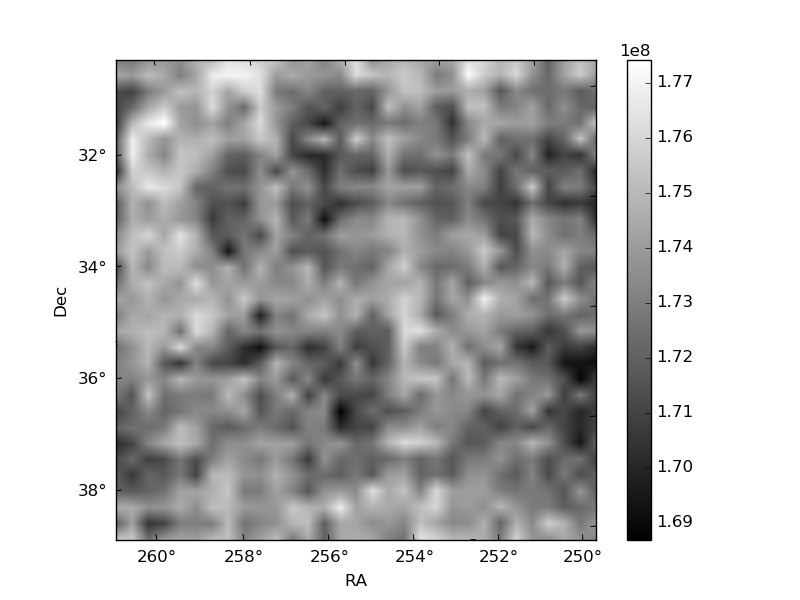
| Quadrant D | 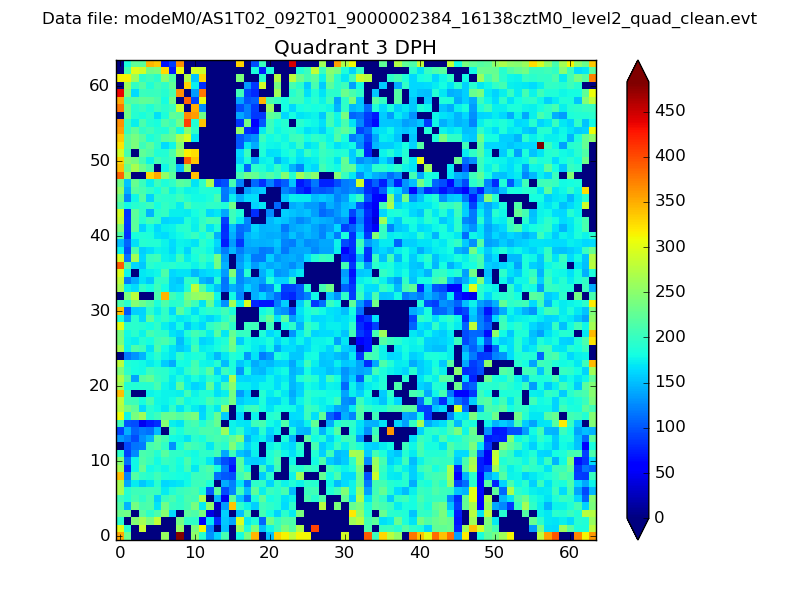 |
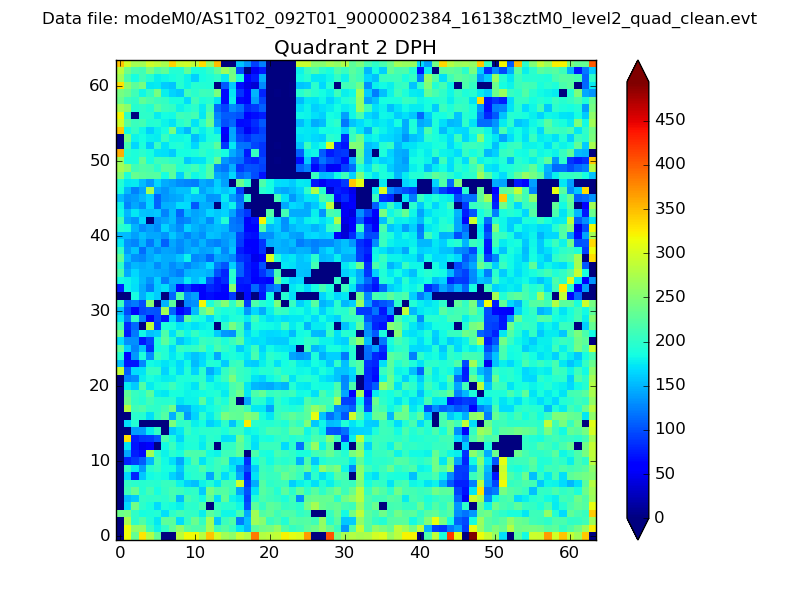 |
Quadrant C |
| Plot type | Count rate plots | Images |
|---|---|---|
| Comparison with Poisson distribution Blue bars denote a histogram of data divided into 1 sec bins. Red curve is a Poisson curve with rate = median count rate of data. |
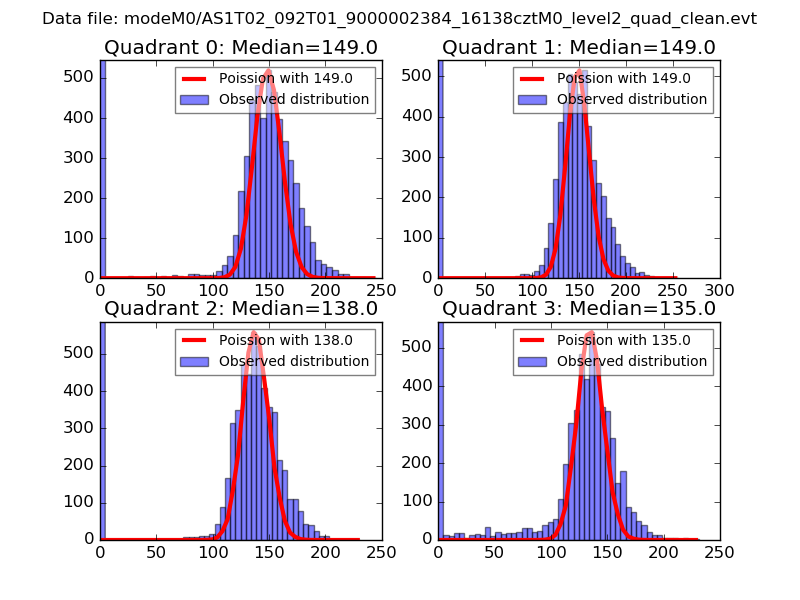 |
 |
| Quadrant-wise count rates Data is divided into 100 sec bins |
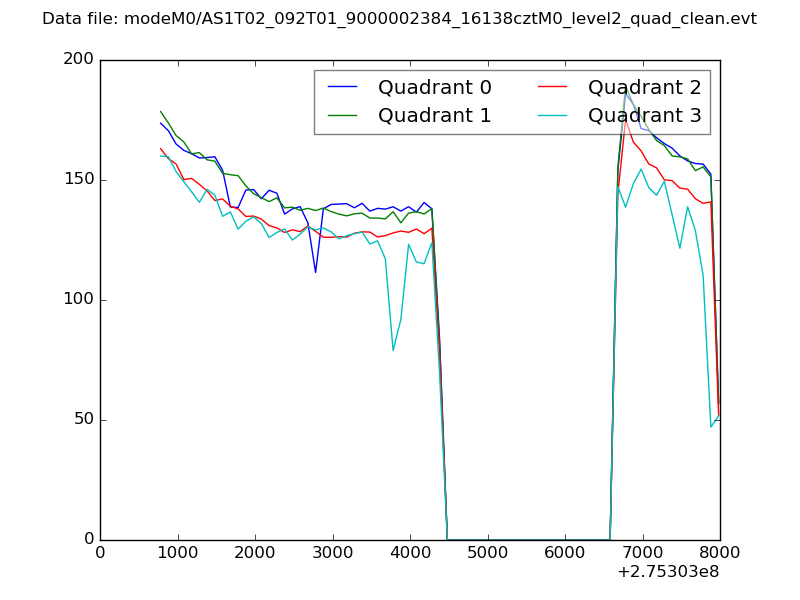 |
|
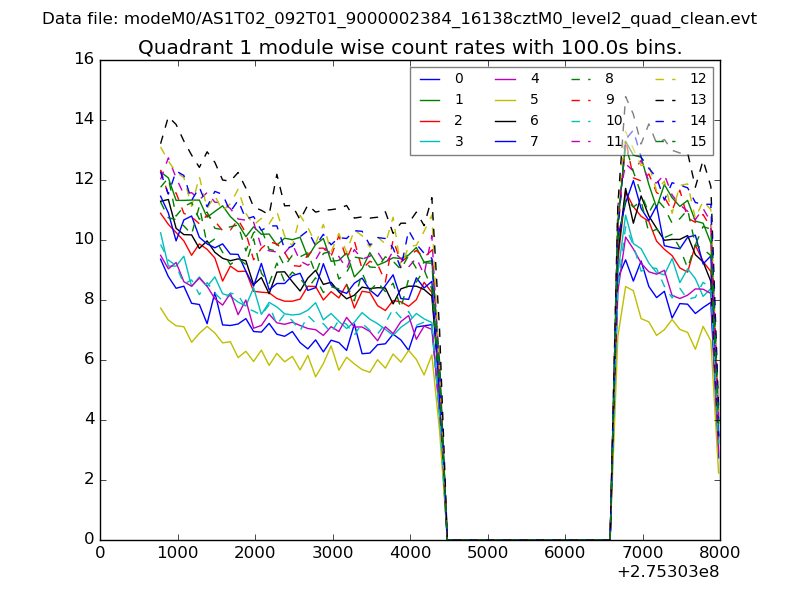
| Module-wise count rates for Quadrant A Data is divided into 100 sec bins |
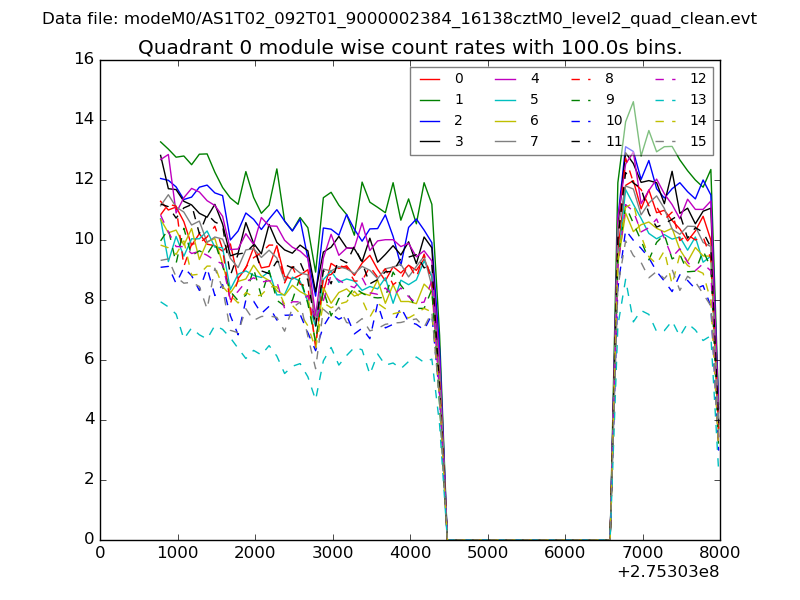 |
 |
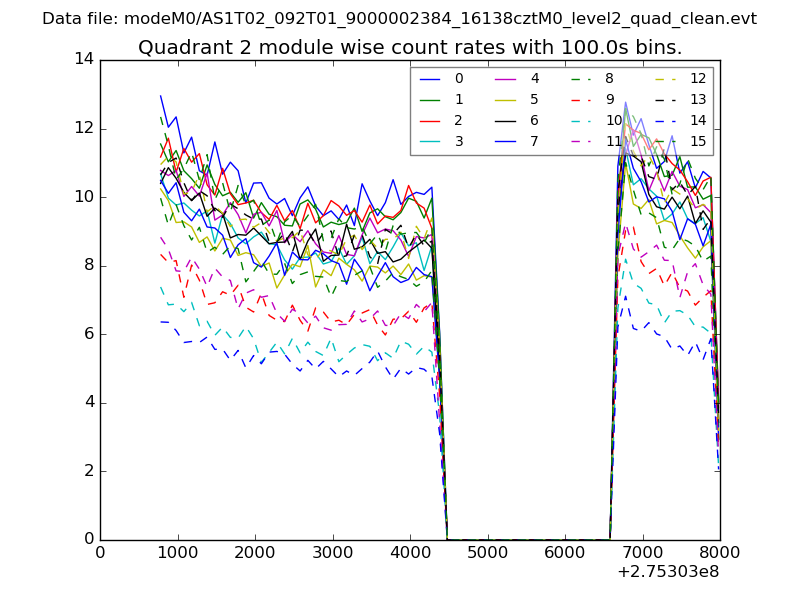
| Module-wise count rates for Quadrant B Data is divided into 100 sec bins |
 |
 |
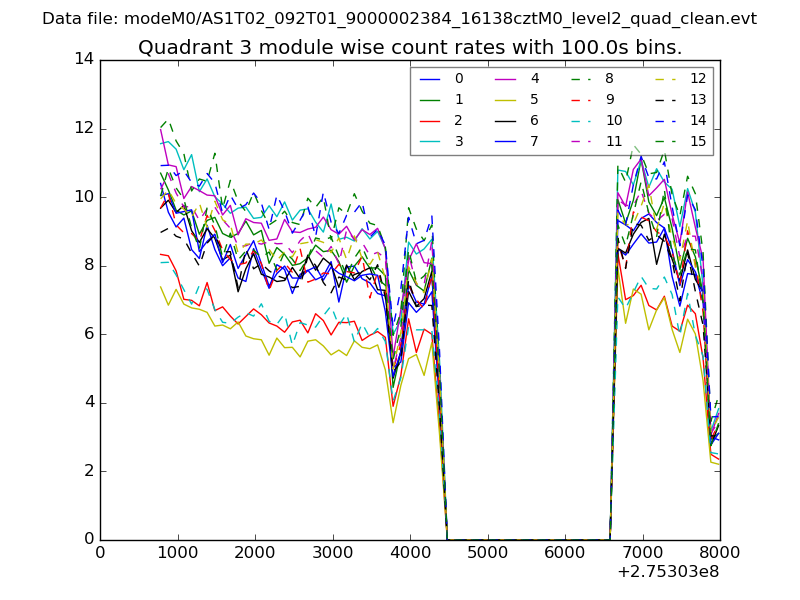
| Module-wise count rates for Quadrant C Data is divided into 100 sec bins |
 |
 |
| Module-wise count rates for Quadrant D Data is divided into 100 sec bins |
 |
 |
| Parameter | Plot |
|---|---|
| CZT HV Monitor | 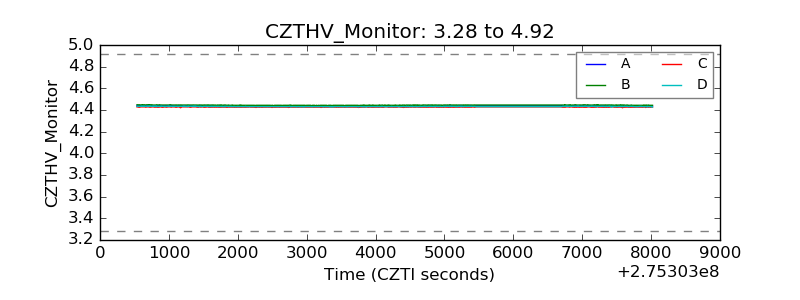 |
| D_VDD | 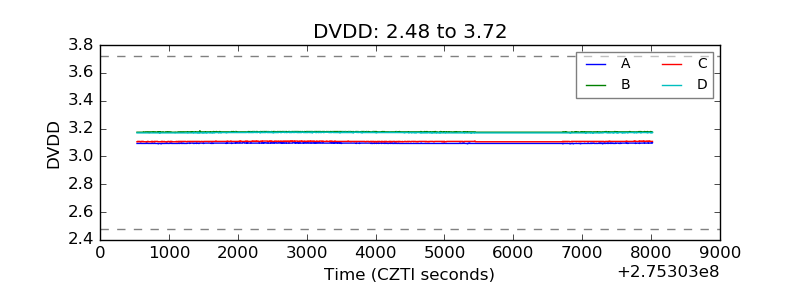 |
| Temperature 1 | 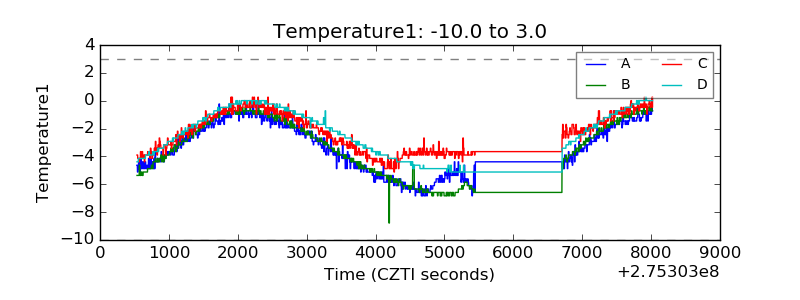 |
| Veto HV Monitor | 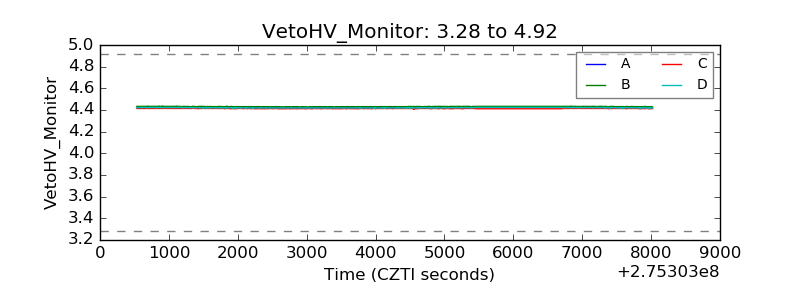 |
| Veto LLD | 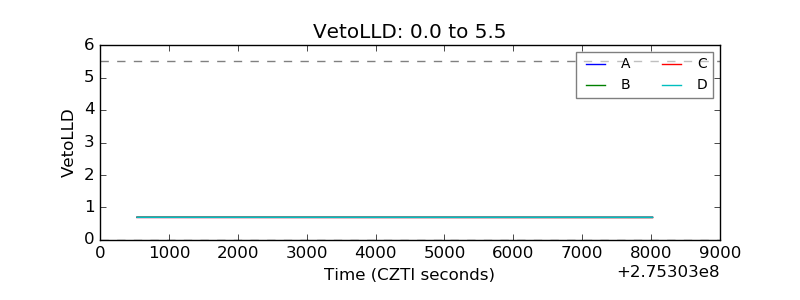 |
| Alpha Counter | 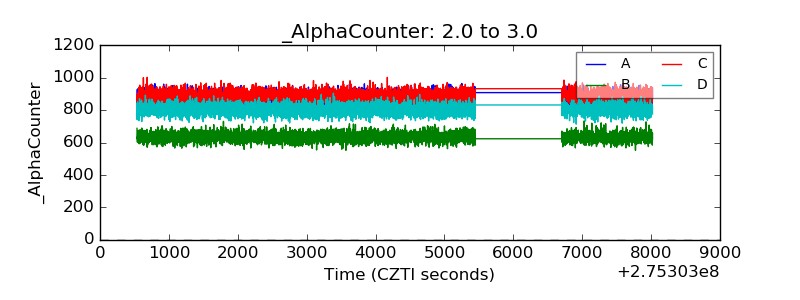 |
| _CPM_Rate | 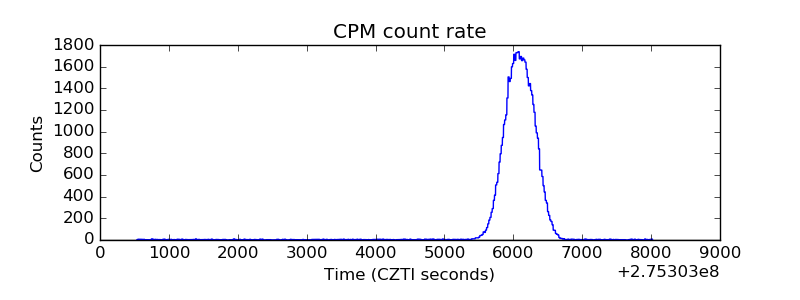 |
| CZT Counter | 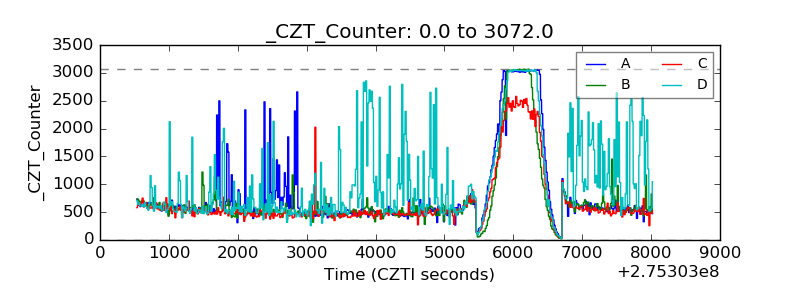 |
| +2.5 Volts monitor |  |
| +5 Volts monitor | 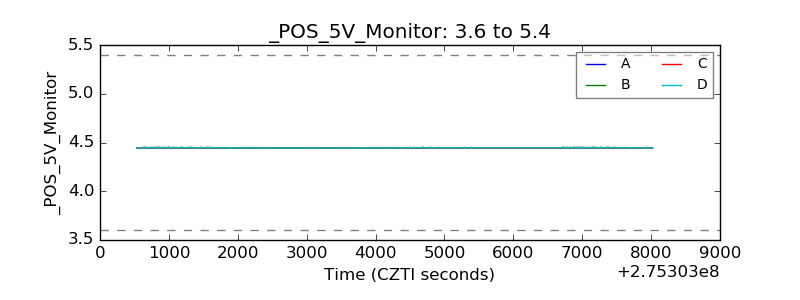 |
| _ROLL_ROT | 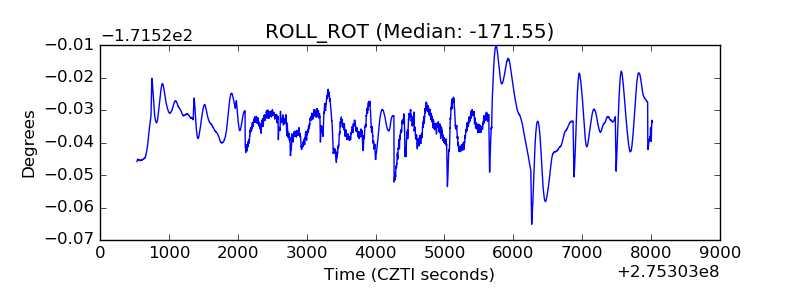 |
| _Roll_DEC | 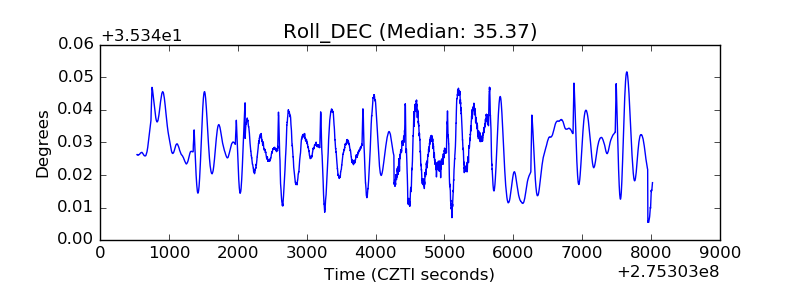 |
| _Roll_RA | 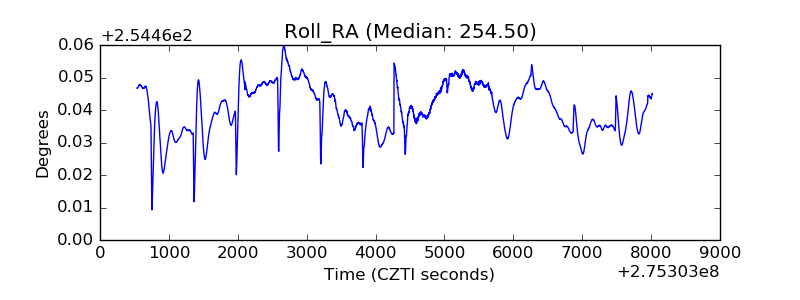 |
| Veto Counter | 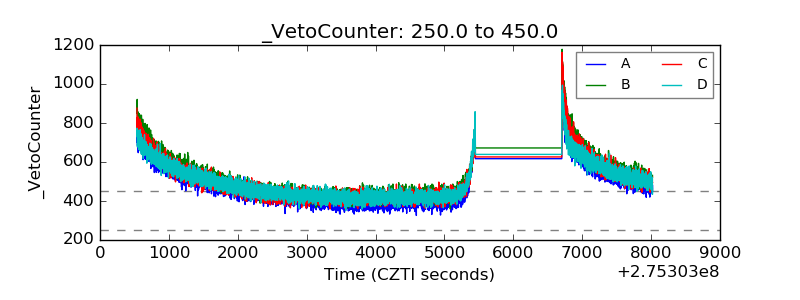 |