| Param | Original file | Final file |
|---|---|---|
| Filename | modeM0/AS1T02_092T01_9000002384_16139cztM0_level2.evt | modeM0/AS1T02_092T01_9000002384_16139cztM0_level2_quad_clean.evt |
| Size (bytes) | 646,925,760 | 101,301,120 |
| Size | 617.0 MB | 96.6 MB |
| Events in quadrant A | 3,440,283 | 721,228 |
| Events in quadrant B | 3,628,408 | 711,767 |
| Events in quadrant C | 3,162,801 | 666,535 |
| Events in quadrant D | 8,937,783 | 531,422 |
| Mode SS | |||
|---|---|---|---|
| Quadrant | BADHDUFLAG | Total packets | Discarded packets |
| A | 0 | 126 | 0 |
| B | 0 | 126 | 0 |
| C | 0 | 126 | 0 |
| D | 0 | 126 | 0 |
| Mode M0 | |||
|---|---|---|---|
| Quadrant | BADHDUFLAG | Total packets | Discarded packets |
| A | 0 | 13903 | 2 |
| B | 0 | 14643 | 1 |
| C | 0 | 13090 | 1 |
| D | 0 | 30839 | 1 |
| Mode M9 | |||
|---|---|---|---|
| Quadrant | BADHDUFLAG | Total packets | Discarded packets |
| A | 0 | 13 | 0 |
| B | 0 | 13 | 0 |
| C | 0 | 13 | 0 |
| D | 0 | 13 | 0 |
| Quadrant | Total seconds | Saturated seconds | Saturation percentage |
|---|---|---|---|
| A | 6252 | 126 | 2.015355% |
| B | 6252 | 123 | 1.967370% |
| C | 6252 | 92 | 1.471529% |
| D | 6252 | 1944 | 31.094050% |
Noise dominated data is calculated using 1-second bins in cleaned event files. If a bin has >2000 counts, and if more than 50% of those come from <1% of pixels, then it is considered to be noise-dominated and hence unusable.
| Quadrant | # 1 sec bins | Bins with >0 counts | Bins with >2000 counts | High rate bins dominated by noise | Noise dominated (total time) | Noise dominated (detector-on time) | Marked lightcurve |
|---|---|---|---|---|---|---|---|
| A | 7523 | 6254 | 38 | 38 | 0.51% | 0.61% | 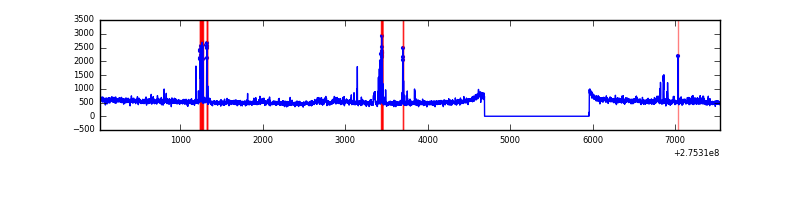 |
| B | 7523 | 6254 | 21 | 21 | 0.28% | 0.34% | 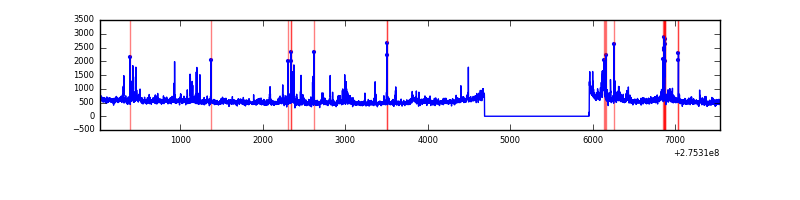 |
| C | 7523 | 6254 | 1 | 1 | 0.01% | 0.02% | 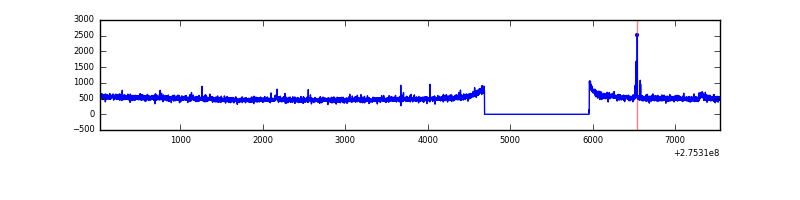 |
| D | 7523 | 6254 | 1883 | 1883 | 25.03% | 30.11% | 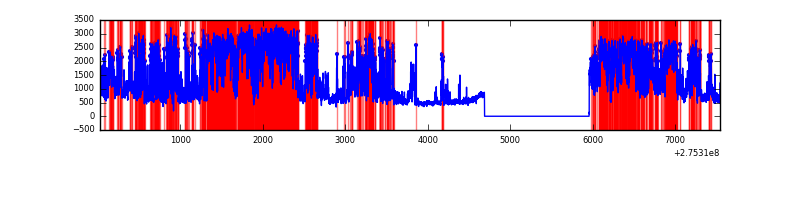 |
Top three noisy pixels from each quadrant. If the there are fewer than three noisy pixels in the level2.evt file, extra rows are filled as -1
| Pixel properties | Quadrant properties | ||||||
|---|---|---|---|---|---|---|---|
| Quadrant | DetID | PixID | Counts | Sigma | Mean | Median | Sigma |
| A | 15 | 174 | 175916 | 1083.31 | 816 | 801 | 161.6 |
| A | 15 | 223 | 89587 | 549.26 | 816 | 801 | 161.6 |
| A | 0 | 253 | 21485 | 127.96 | 816 | 801 | 161.6 |
| B | 0 | 189 | 136478 | 905.48 | 803 | 785 | 149.9 |
| B | 5 | 65 | 74169 | 489.69 | 803 | 785 | 149.9 |
| B | 7 | 220 | 63329 | 417.36 | 803 | 785 | 149.9 |
| C | 14 | 238 | 118822 | 666.32 | 763 | 769 | 177.2 |
| C | 3 | 233 | 40534 | 224.44 | 763 | 769 | 177.2 |
| C | 0 | 207 | 17253 | 93.04 | 763 | 769 | 177.2 |
| D | 1 | 52 | 5993737 | 35598.48 | 690 | 670 | 168.4 |
| D | 7 | 38 | 175726 | 1039.82 | 690 | 670 | 168.4 |
| D | 13 | 104 | 51396 | 301.31 | 690 | 670 | 168.4 |
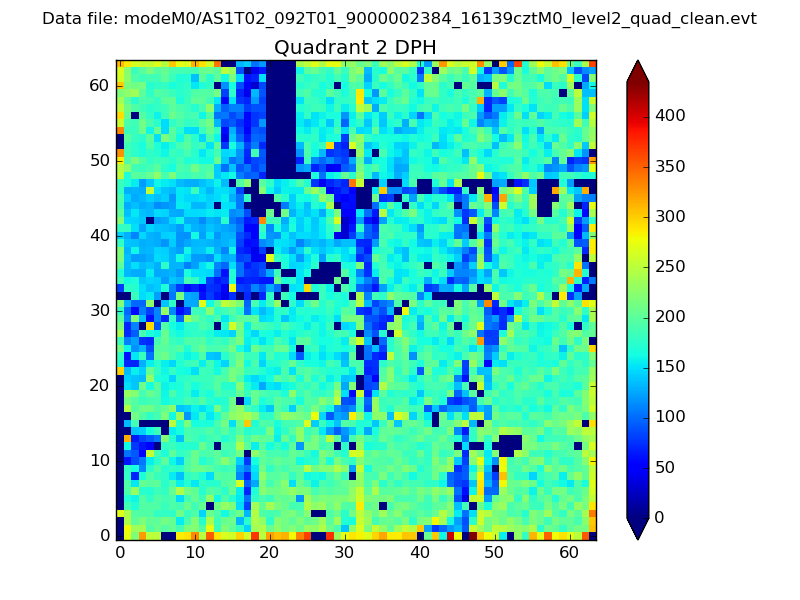
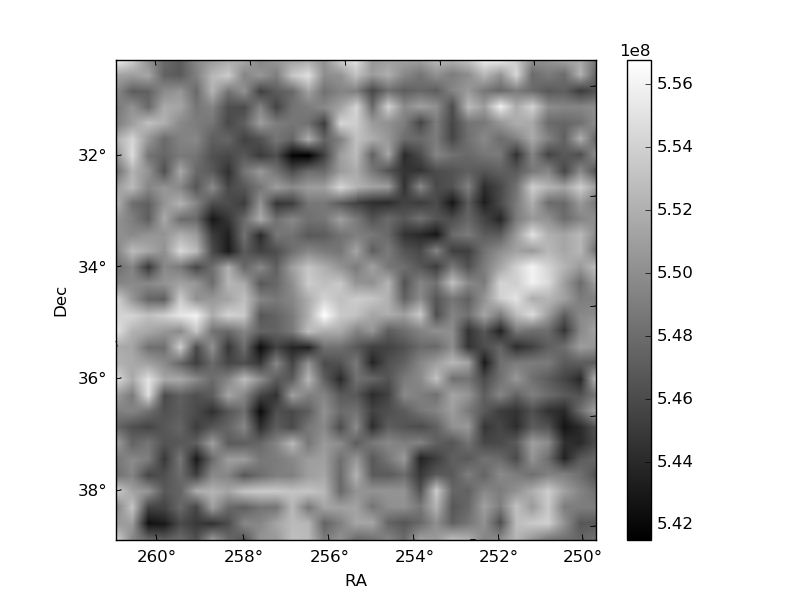
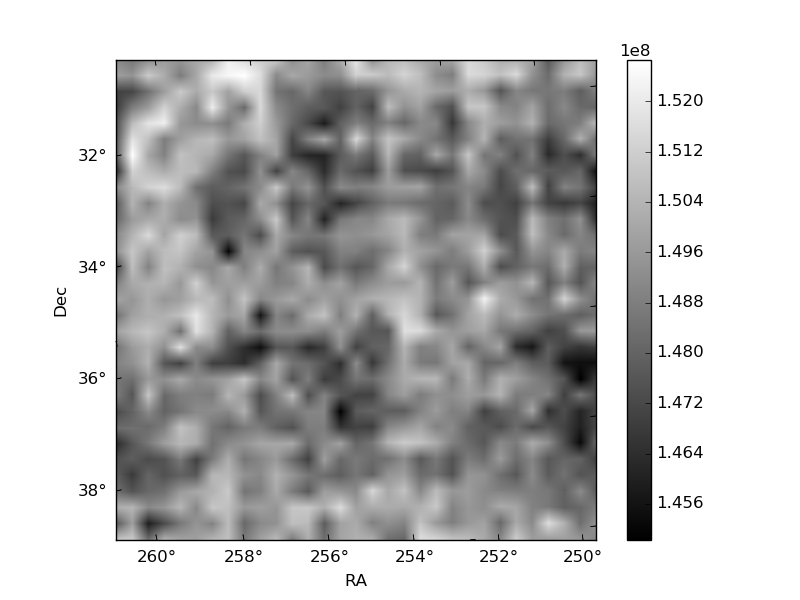
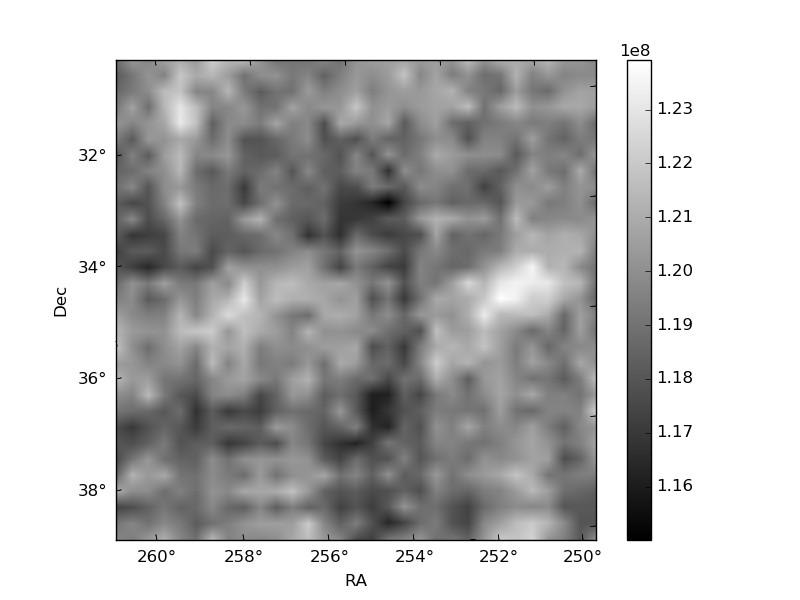
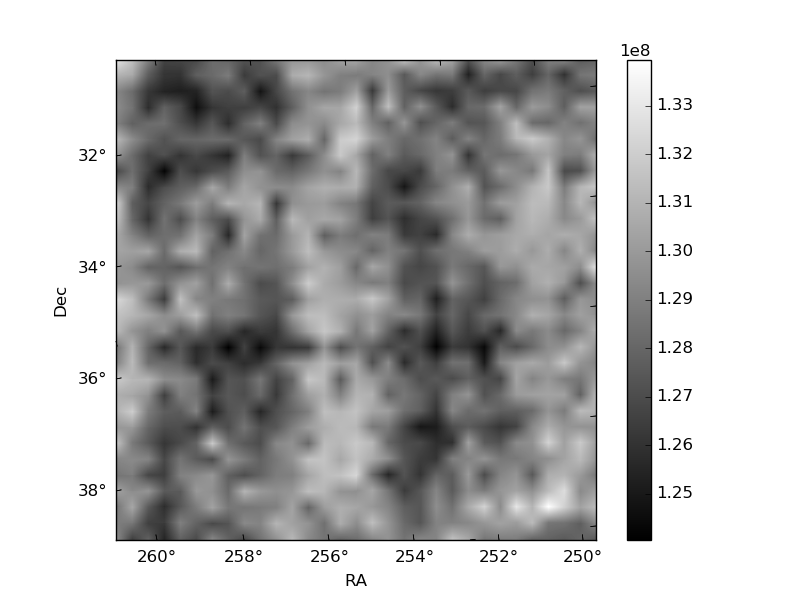
Histogram calculated using DETX and DETY for each event in the final _common_clean file
| Quadrant A | 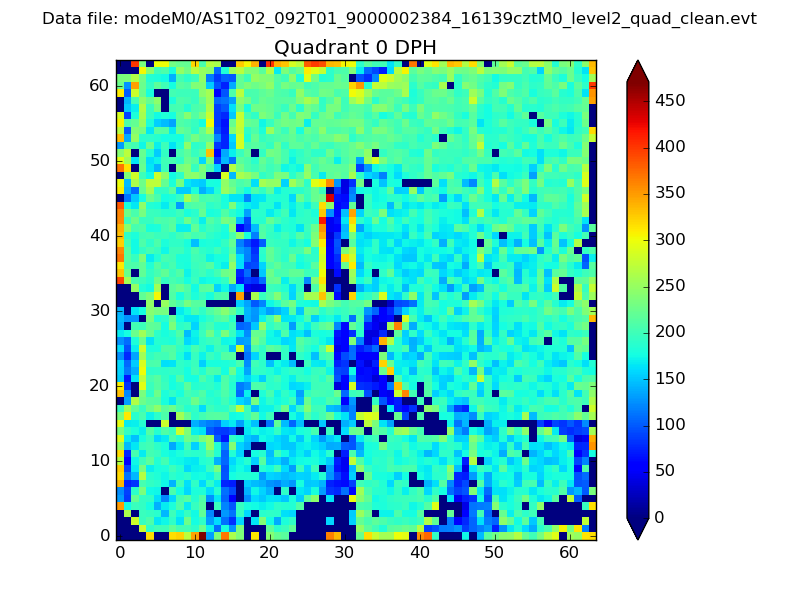 |
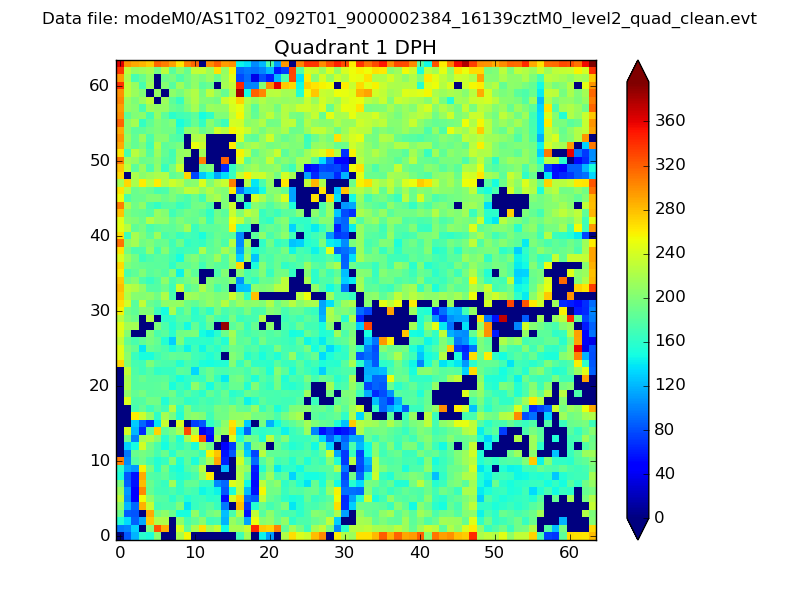 |
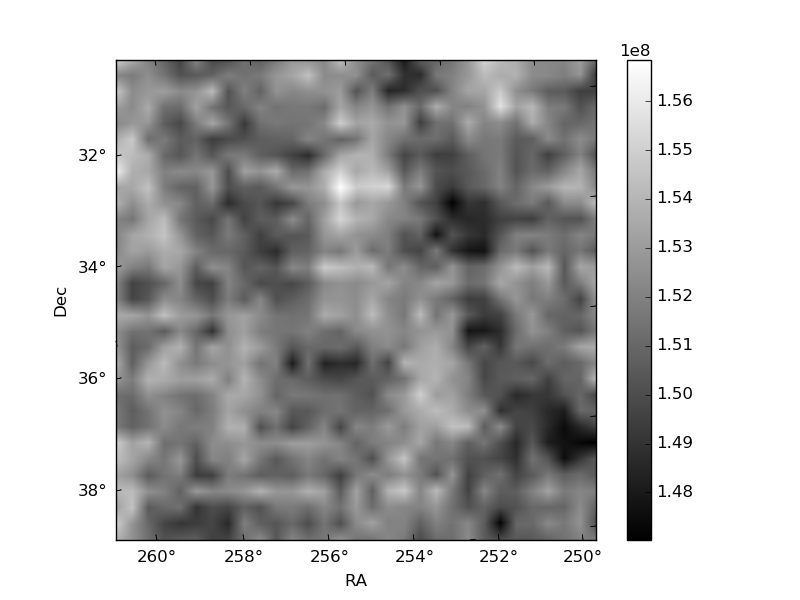
Quadrant B |
|---|---|---|---|
| Quadrant D | 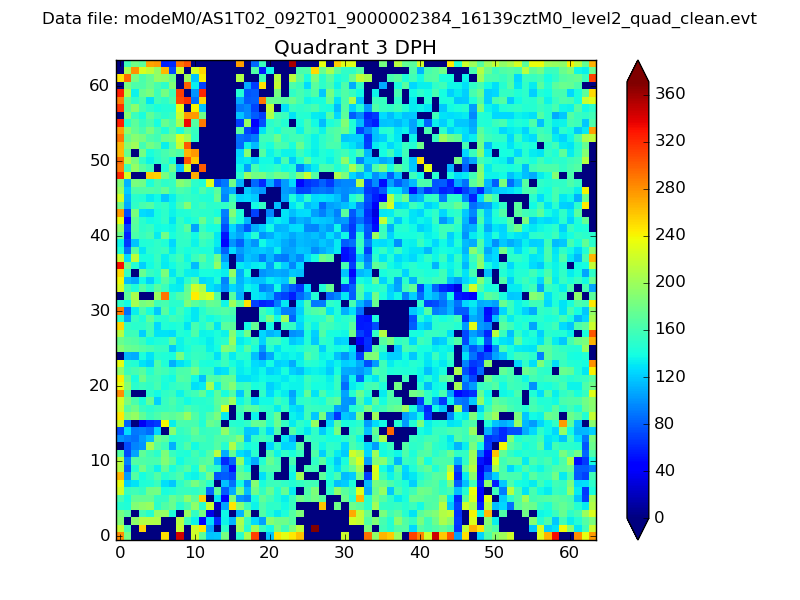 |
 |
Quadrant C |
| Plot type | Count rate plots | Images |
|---|---|---|
| Comparison with Poisson distribution Blue bars denote a histogram of data divided into 1 sec bins. Red curve is a Poisson curve with rate = median count rate of data. |
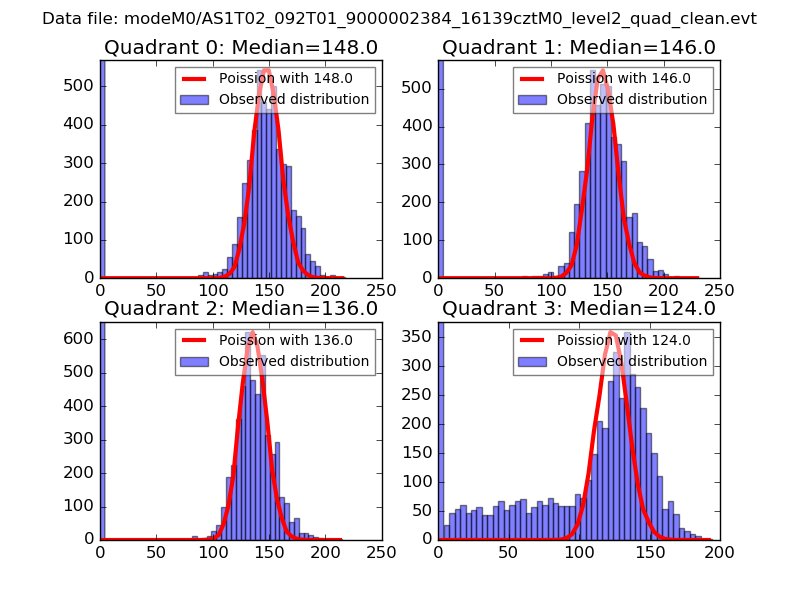 |
 |
| Quadrant-wise count rates Data is divided into 100 sec bins |
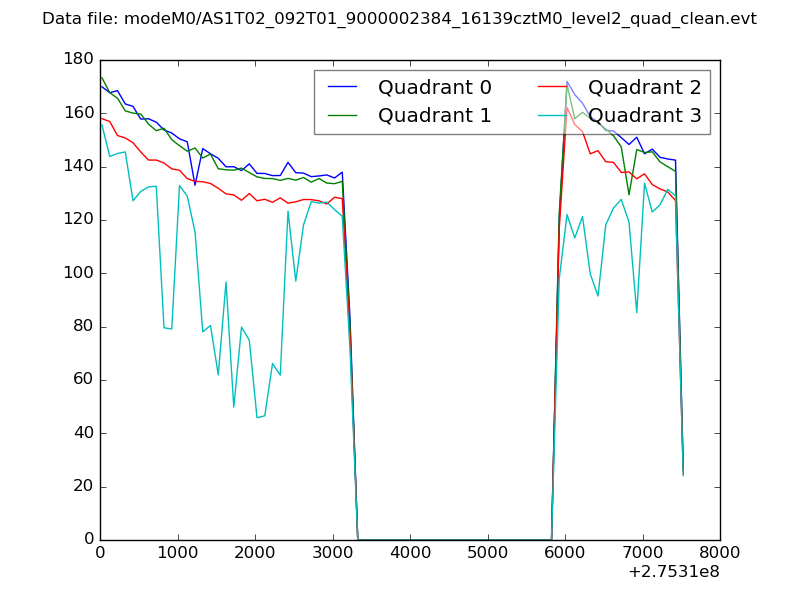 |
|
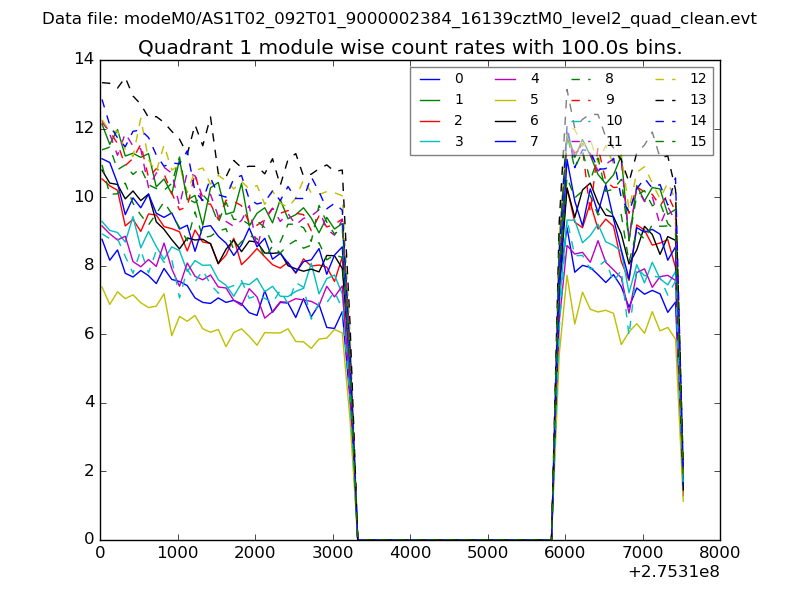
| Module-wise count rates for Quadrant A Data is divided into 100 sec bins |
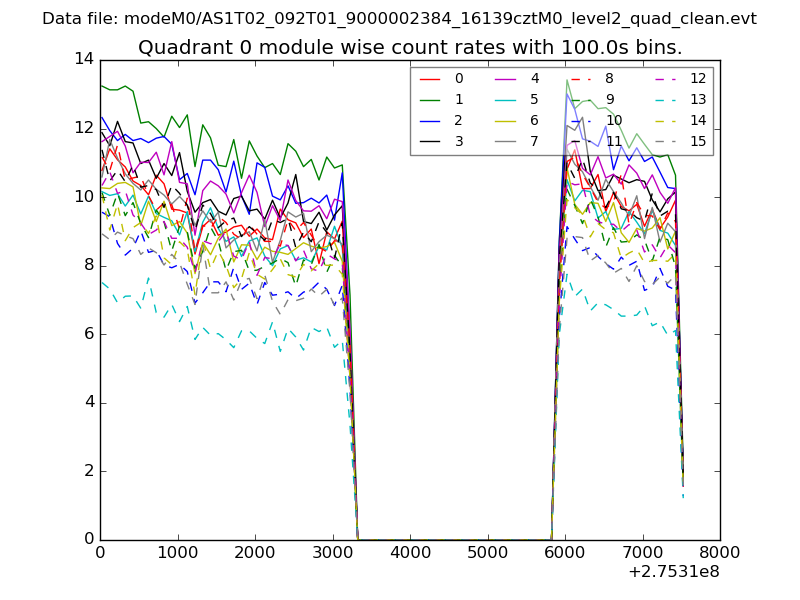 |
 |
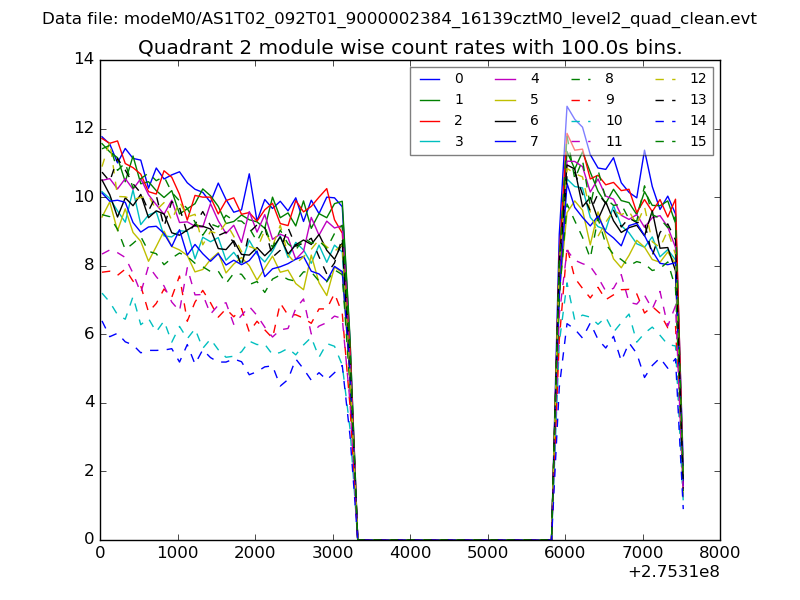
| Module-wise count rates for Quadrant B Data is divided into 100 sec bins |
 |
 |
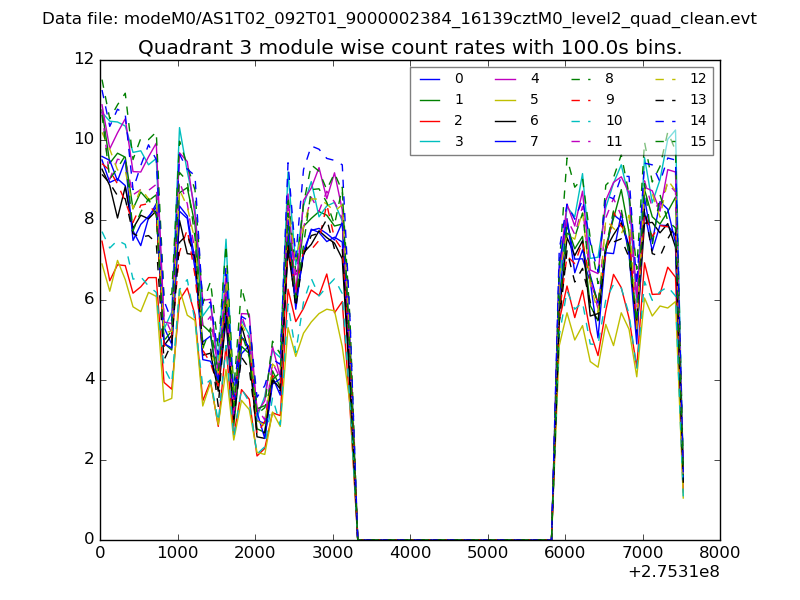
| Module-wise count rates for Quadrant C Data is divided into 100 sec bins |
 |
 |
| Module-wise count rates for Quadrant D Data is divided into 100 sec bins |
 |
 |
| Parameter | Plot |
|---|---|
| CZT HV Monitor | 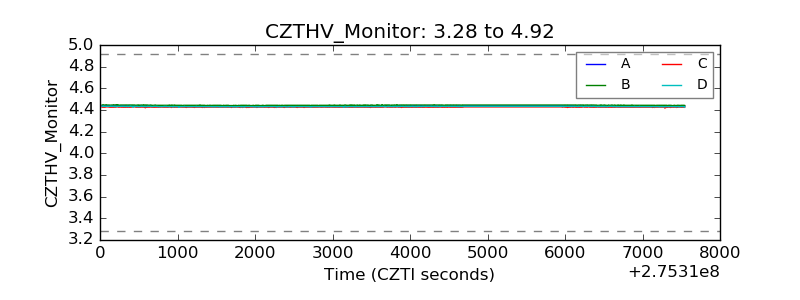 |
| D_VDD | 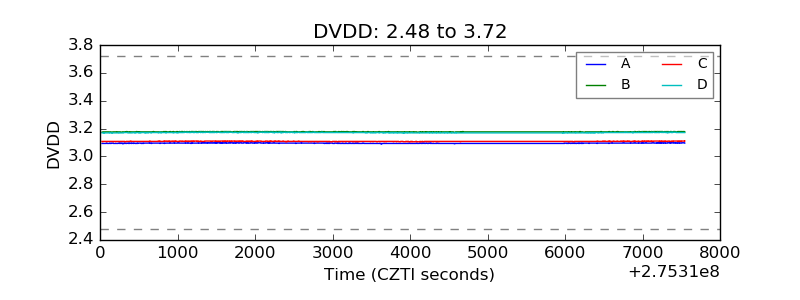 |
| Temperature 1 | 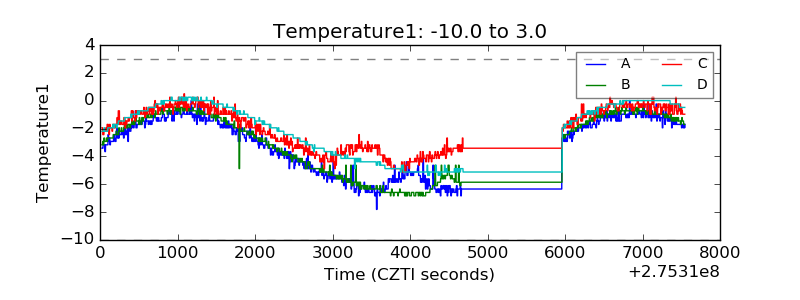 |
| Veto HV Monitor | 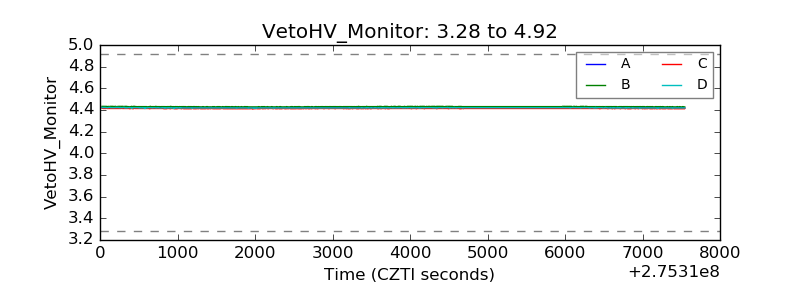 |
| Veto LLD | 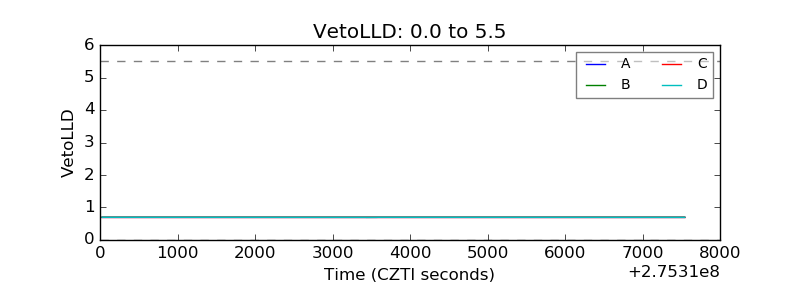 |
| Alpha Counter | 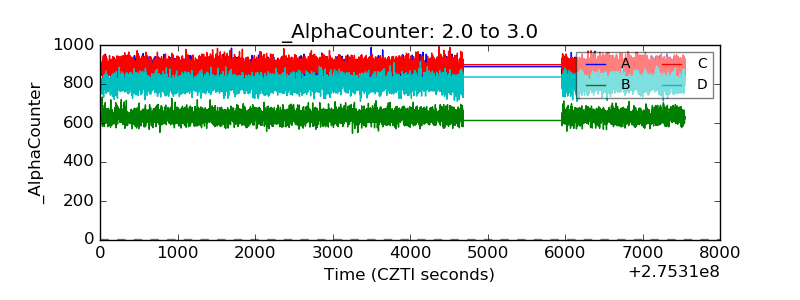 |
| _CPM_Rate | 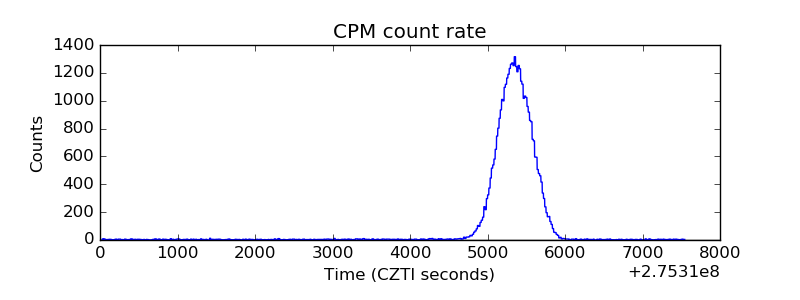 |
| CZT Counter | 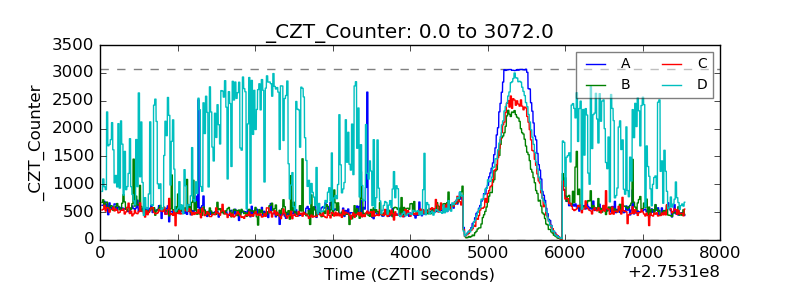 |
| +2.5 Volts monitor |  |
| +5 Volts monitor |  |
| _ROLL_ROT | 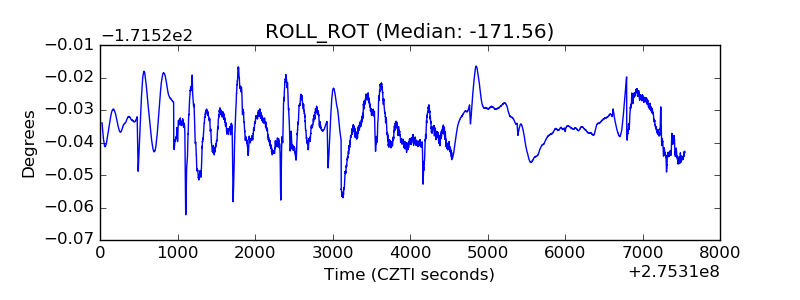 |
| _Roll_DEC | 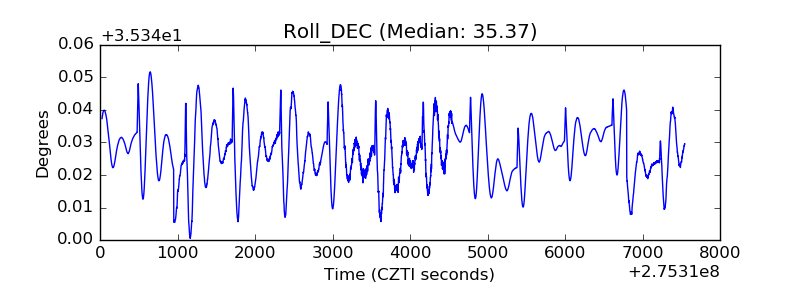 |
| _Roll_RA | 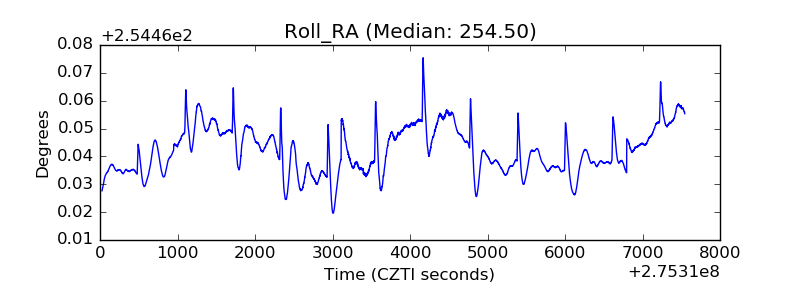 |
| Veto Counter | 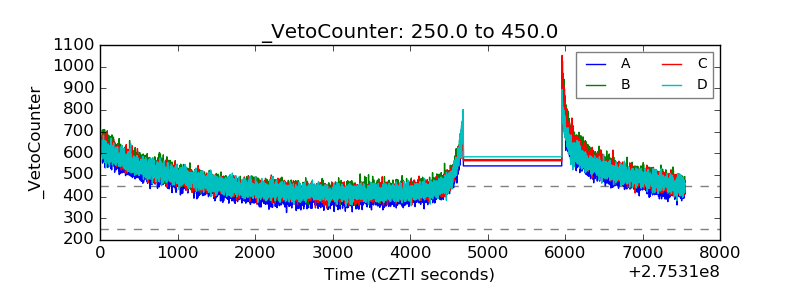 |