| Param | Original file | Final file |
|---|---|---|
| Filename | modeM0/AS1T02_092T01_9000002384_16140cztM0_level2.evt | modeM0/AS1T02_092T01_9000002384_16140cztM0_level2_quad_clean.evt |
| Size (bytes) | 537,592,320 | 92,868,480 |
| Size | 512.7 MB | 88.6 MB |
| Events in quadrant A | 3,165,987 | 627,165 |
| Events in quadrant B | 3,539,351 | 616,642 |
| Events in quadrant C | 3,621,358 | 578,760 |
| Events in quadrant D | 5,524,938 | 547,654 |
| Mode SS | |||
|---|---|---|---|
| Quadrant | BADHDUFLAG | Total packets | Discarded packets |
| A | 0 | 128 | 0 |
| B | 0 | 128 | 0 |
| C | 0 | 128 | 0 |
| D | 0 | 128 | 0 |
| Mode M0 | |||
|---|---|---|---|
| Quadrant | BADHDUFLAG | Total packets | Discarded packets |
| A | 0 | 13330 | 2 |
| B | 0 | 14450 | 1 |
| C | 0 | 14756 | 1 |
| D | 0 | 20583 | 1 |
| Mode M9 | |||
|---|---|---|---|
| Quadrant | BADHDUFLAG | Total packets | Discarded packets |
| A | 0 | 12 | 0 |
| B | 0 | 12 | 0 |
| C | 0 | 12 | 0 |
| D | 0 | 12 | 0 |
| Quadrant | Total seconds | Saturated seconds | Saturation percentage |
|---|---|---|---|
| A | 6335 | 96 | 1.515391% |
| B | 6335 | 132 | 2.083662% |
| C | 6335 | 134 | 2.115233% |
| D | 6335 | 637 | 10.055249% |
Noise dominated data is calculated using 1-second bins in cleaned event files. If a bin has >2000 counts, and if more than 50% of those come from <1% of pixels, then it is considered to be noise-dominated and hence unusable.
| Quadrant | # 1 sec bins | Bins with >0 counts | Bins with >2000 counts | High rate bins dominated by noise | Noise dominated (total time) | Noise dominated (detector-on time) | Marked lightcurve |
|---|---|---|---|---|---|---|---|
| A | 7516 | 6337 | 1 | 1 | 0.01% | 0.02% | 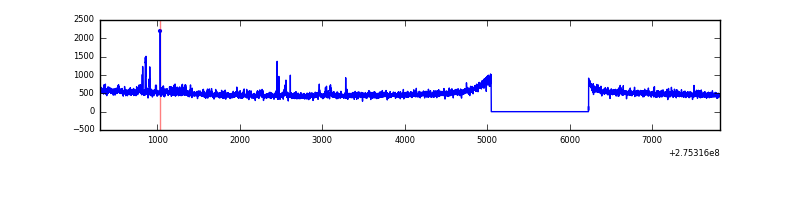 |
| B | 7516 | 6337 | 26 | 26 | 0.35% | 0.41% | 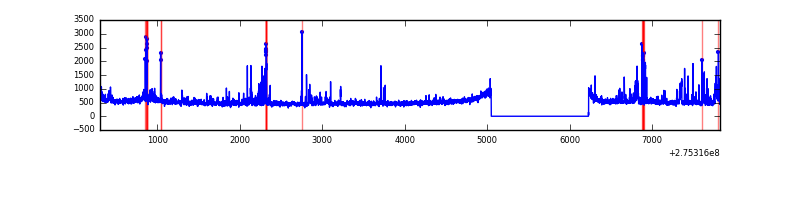 |
| C | 7516 | 6337 | 1 | 1 | 0.01% | 0.02% | 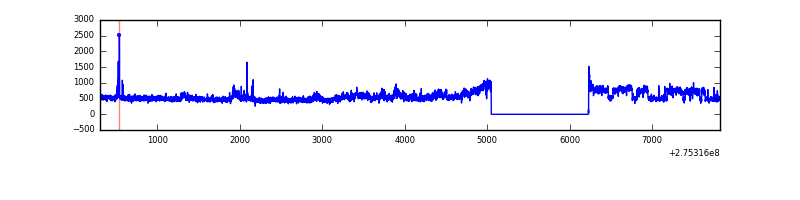 |
| D | 7516 | 6337 | 551 | 551 | 7.33% | 8.69% | 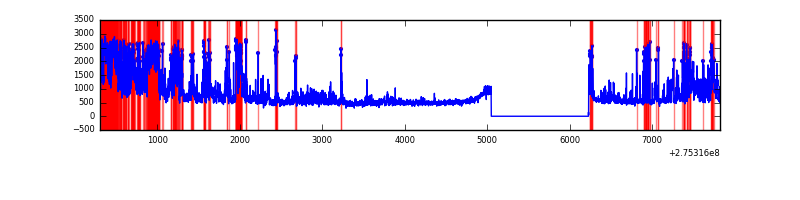 |
Top three noisy pixels from each quadrant. If the there are fewer than three noisy pixels in the level2.evt file, extra rows are filled as -1
| Pixel properties | Quadrant properties | ||||||
|---|---|---|---|---|---|---|---|
| Quadrant | DetID | PixID | Counts | Sigma | Mean | Median | Sigma |
| A | 0 | 253 | 34878 | 213.23 | 802 | 786 | 159.9 |
| A | 15 | 174 | 28004 | 170.23 | 802 | 786 | 159.9 |
| A | 13 | 248 | 11225 | 65.29 | 802 | 786 | 159.9 |
| B | 5 | 65 | 157208 | 1047.03 | 789 | 771 | 149.4 |
| B | 7 | 220 | 86686 | 575.03 | 789 | 771 | 149.4 |
| B | 0 | 189 | 43847 | 288.31 | 789 | 771 | 149.4 |
| C | 3 | 233 | 526475 | 3002.77 | 754 | 762 | 175.1 |
| C | 14 | 238 | 116242 | 659.6 | 754 | 762 | 175.1 |
| C | 0 | 207 | 22729 | 125.47 | 754 | 762 | 175.1 |
| D | 1 | 52 | 2520701 | 13717.45 | 758 | 738 | 183.7 |
| D | 13 | 11 | 63629 | 342.35 | 758 | 738 | 183.7 |
| D | 2 | 234 | 26873 | 142.27 | 758 | 738 | 183.7 |
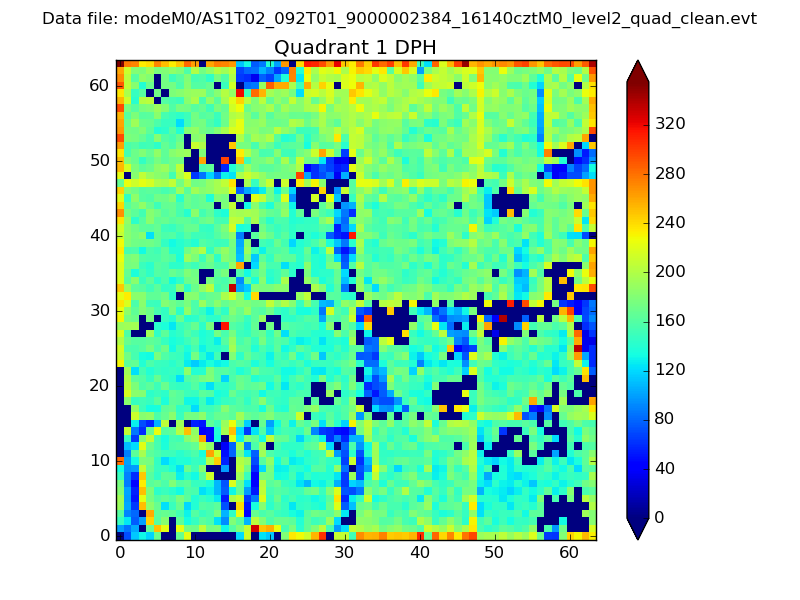
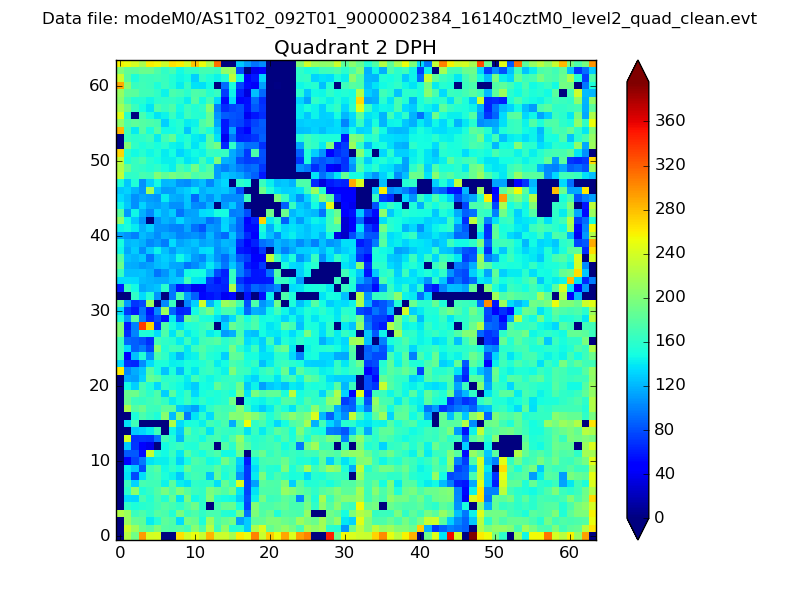
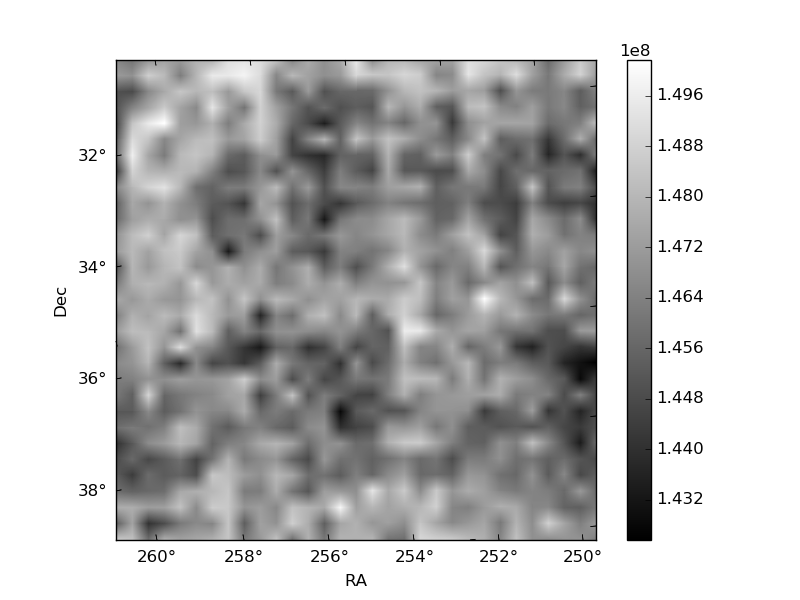
Histogram calculated using DETX and DETY for each event in the final _common_clean file
| Quadrant A |  |
 |
Quadrant B |
|---|---|---|---|
| Quadrant D |  |
 |
Quadrant C |
| Plot type | Count rate plots | Images |
|---|---|---|
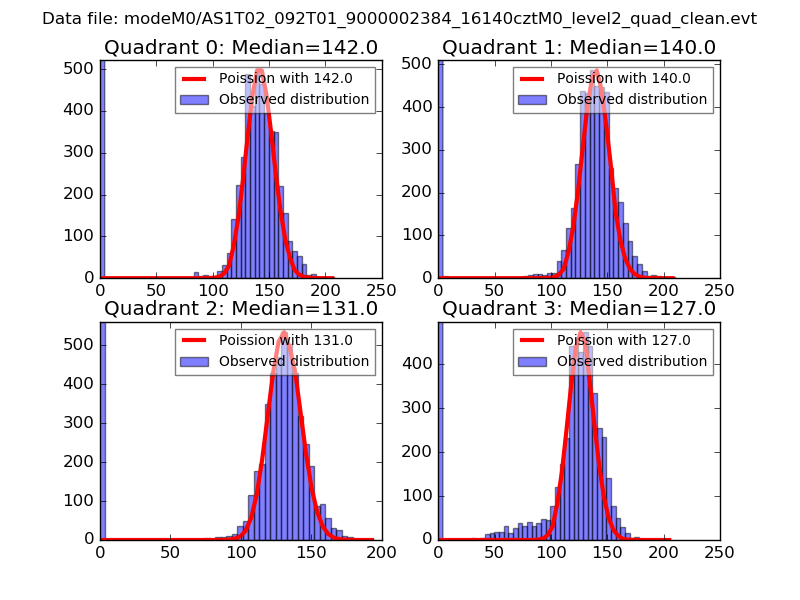
| Comparison with Poisson distribution Blue bars denote a histogram of data divided into 1 sec bins. Red curve is a Poisson curve with rate = median count rate of data. |
 |
 |
| Quadrant-wise count rates Data is divided into 100 sec bins |
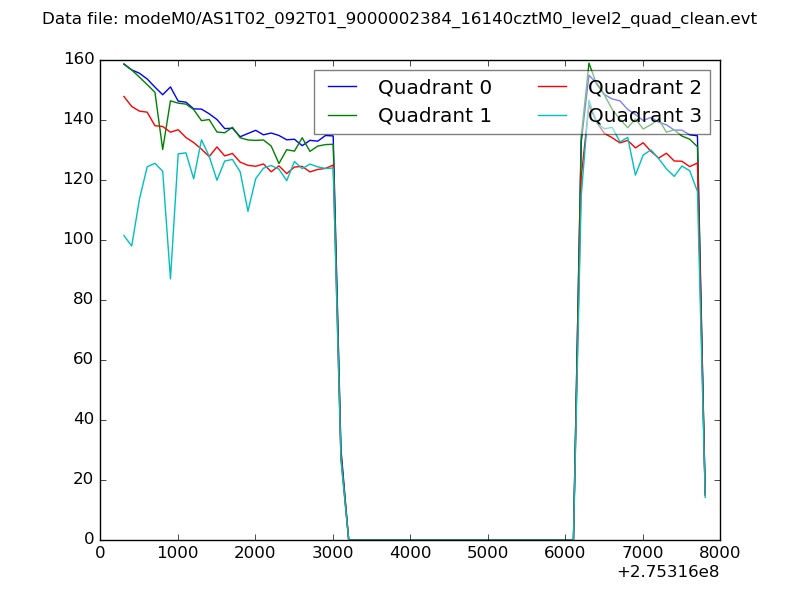 |
|
| Module-wise count rates for Quadrant A Data is divided into 100 sec bins |
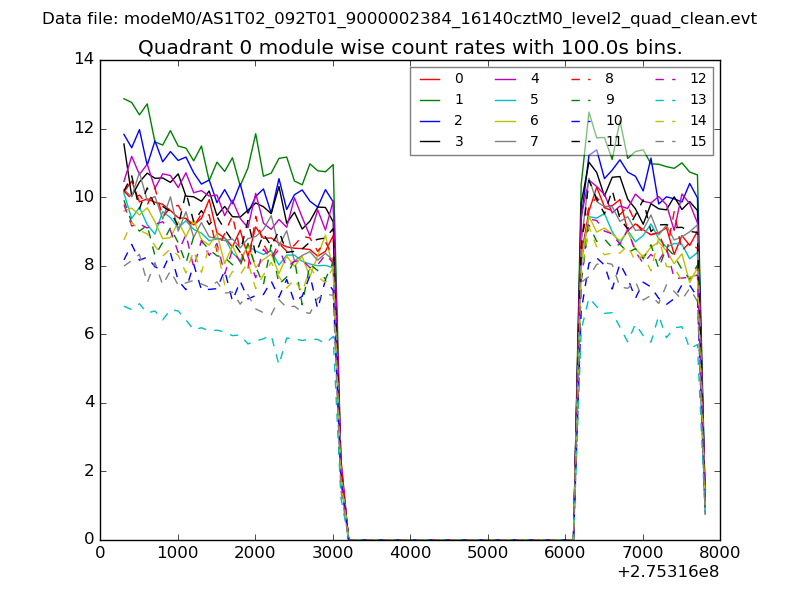 |
 |
| Module-wise count rates for Quadrant B Data is divided into 100 sec bins |
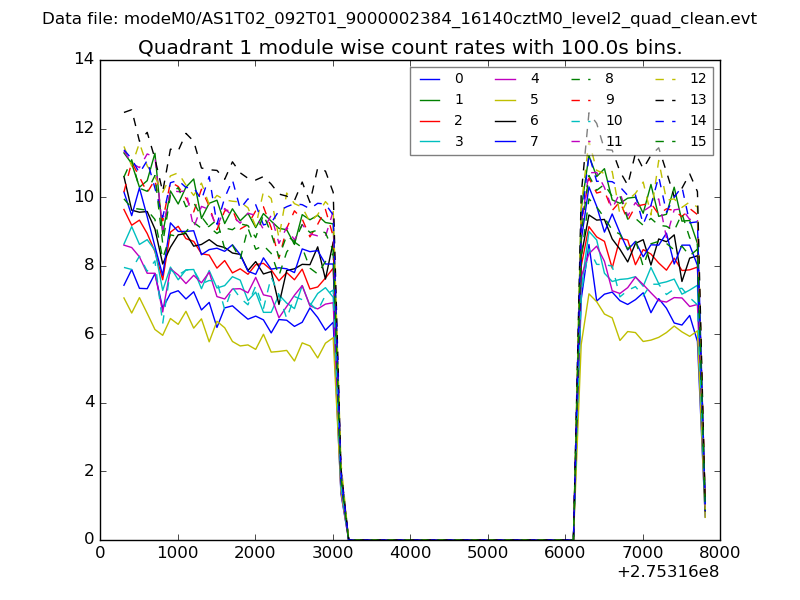 |
 |
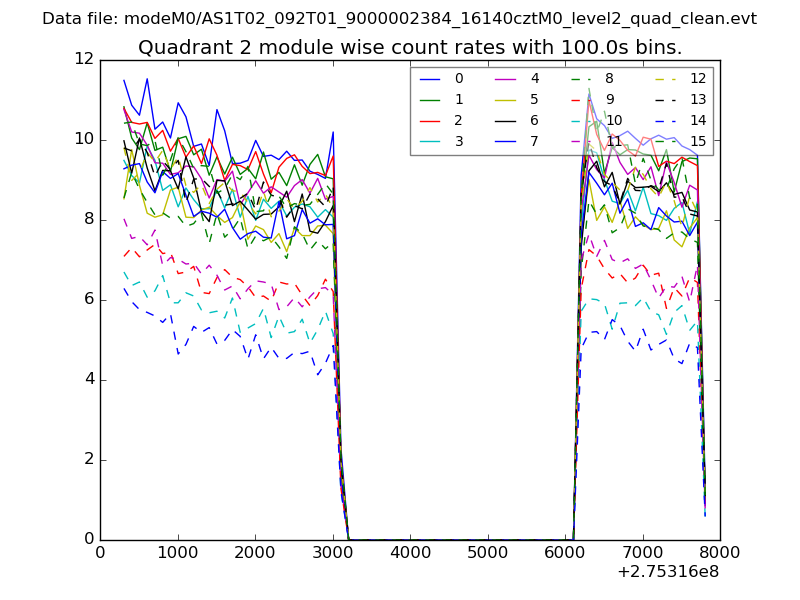
| Module-wise count rates for Quadrant C Data is divided into 100 sec bins |
 |
 |
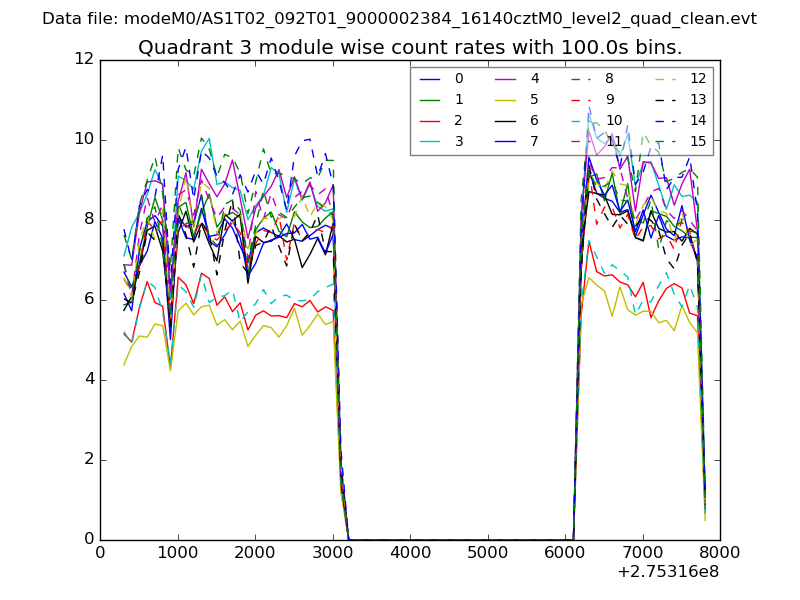
| Module-wise count rates for Quadrant D Data is divided into 100 sec bins |
 |
 |
| Parameter | Plot |
|---|---|
| CZT HV Monitor | 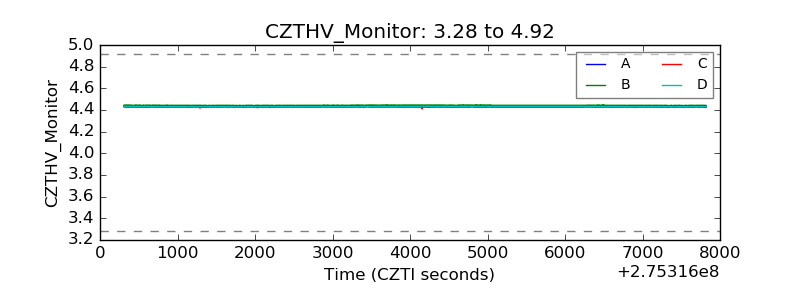 |
| D_VDD | 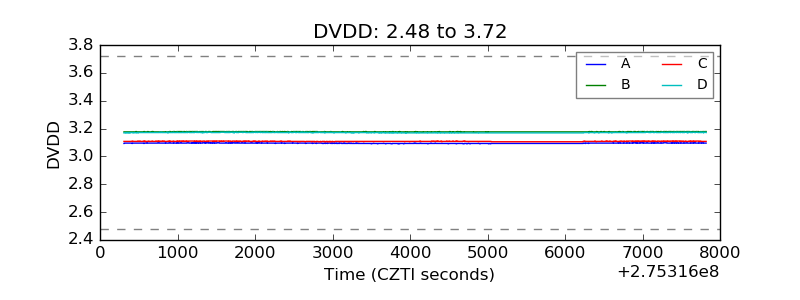 |
| Temperature 1 | 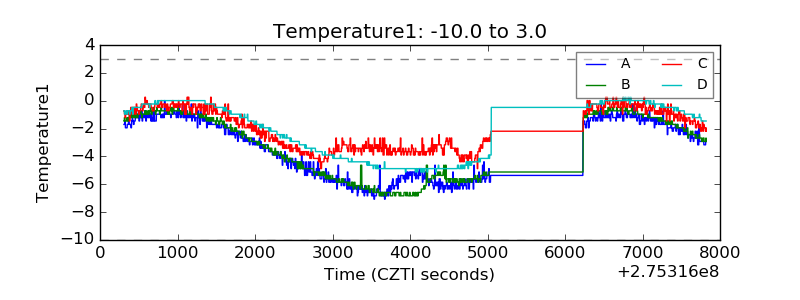 |
| Veto HV Monitor | 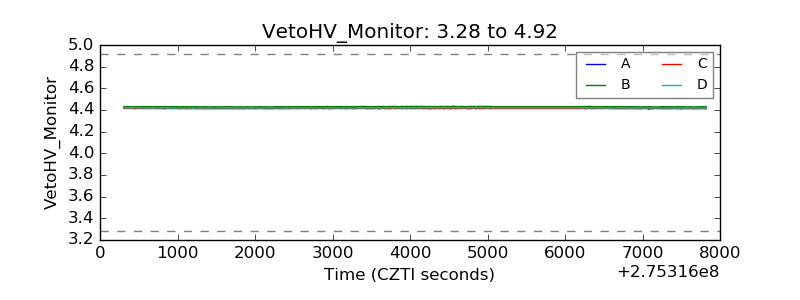 |
| Veto LLD | 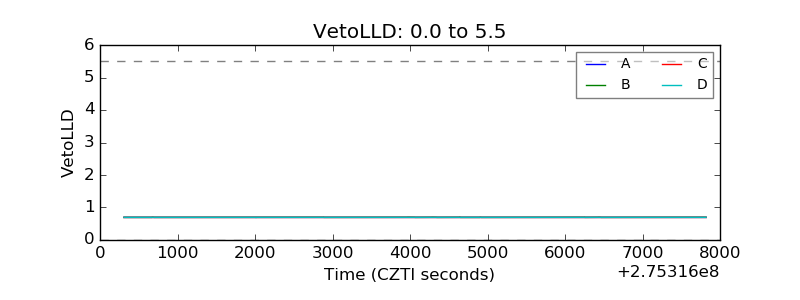 |
| Alpha Counter | 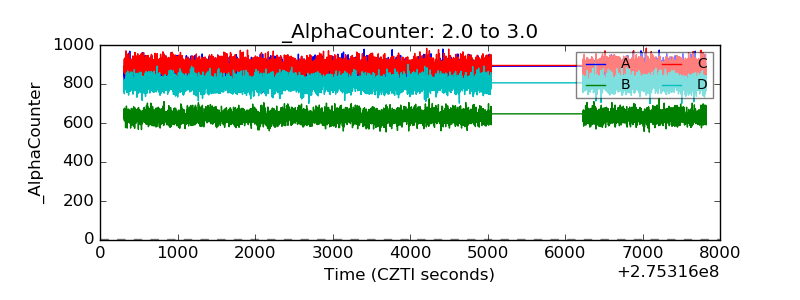 |
| _CPM_Rate | 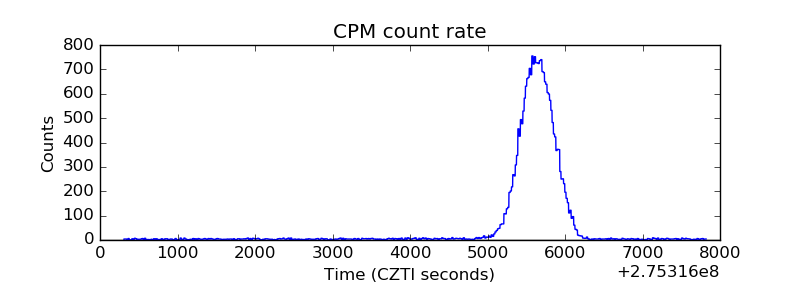 |
| CZT Counter |  |
| +2.5 Volts monitor |  |
| +5 Volts monitor |  |
| _ROLL_ROT | 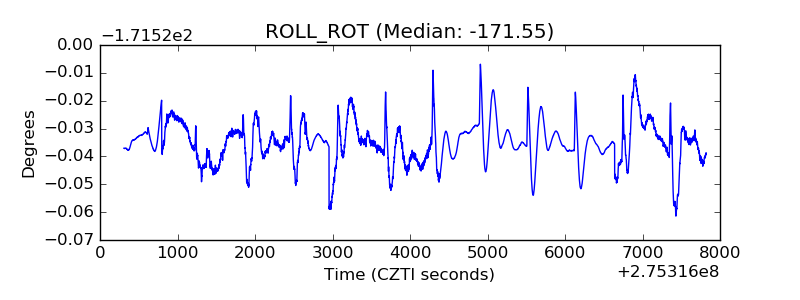 |
| _Roll_DEC | 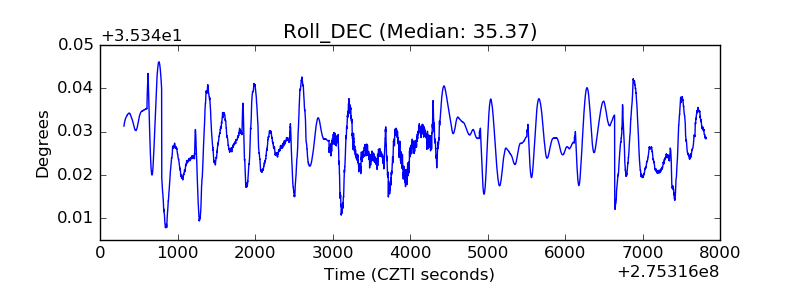 |
| _Roll_RA | 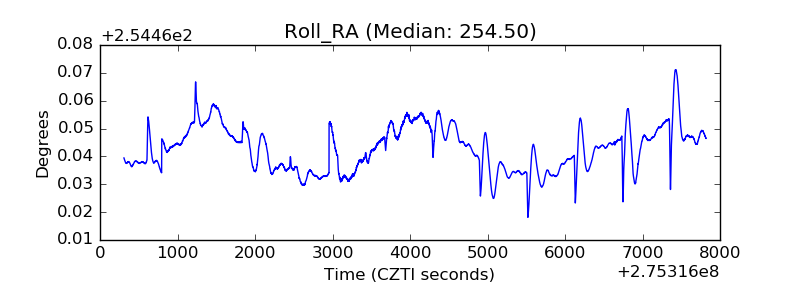 |
| Veto Counter | 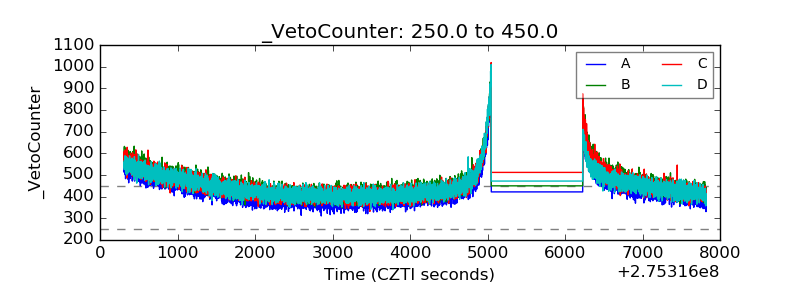 |