| Param | Original file | Final file |
|---|---|---|
| Filename | modeM0/AS1T02_092T01_9000002384_16141cztM0_level2.evt | modeM0/AS1T02_092T01_9000002384_16141cztM0_level2_quad_clean.evt |
| Size (bytes) | 507,945,600 | 83,793,600 |
| Size | 484.4 MB | 79.9 MB |
| Events in quadrant A | 3,470,074 | 546,766 |
| Events in quadrant B | 3,426,302 | 537,054 |
| Events in quadrant C | 3,613,341 | 509,355 |
| Events in quadrant D | 4,450,497 | 508,848 |
| Mode SS | |||
|---|---|---|---|
| Quadrant | BADHDUFLAG | Total packets | Discarded packets |
| A | 0 | 128 | 0 |
| B | 0 | 128 | 0 |
| C | 0 | 128 | 0 |
| D | 0 | 128 | 0 |
| Mode M0 | |||
|---|---|---|---|
| Quadrant | BADHDUFLAG | Total packets | Discarded packets |
| A | 0 | 14359 | 2 |
| B | 0 | 14149 | 1 |
| C | 0 | 15049 | 1 |
| D | 0 | 17343 | 1 |
| Mode M9 | |||
|---|---|---|---|
| Quadrant | BADHDUFLAG | Total packets | Discarded packets |
| A | 0 | 9 | 0 |
| B | 0 | 9 | 0 |
| C | 0 | 9 | 0 |
| D | 0 | 9 | 0 |
| Quadrant | Total seconds | Saturated seconds | Saturation percentage |
|---|---|---|---|
| A | 6231 | 173 | 2.776440% |
| B | 6231 | 96 | 1.540684% |
| C | 6231 | 83 | 1.332049% |
| D | 6231 | 248 | 3.980100% |
Noise dominated data is calculated using 1-second bins in cleaned event files. If a bin has >2000 counts, and if more than 50% of those come from <1% of pixels, then it is considered to be noise-dominated and hence unusable.
| Quadrant | # 1 sec bins | Bins with >0 counts | Bins with >2000 counts | High rate bins dominated by noise | Noise dominated (total time) | Noise dominated (detector-on time) | Marked lightcurve |
|---|---|---|---|---|---|---|---|
| A | 7217 | 6233 | 88 | 88 | 1.22% | 1.41% | 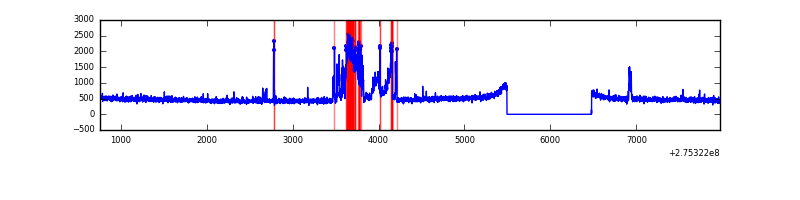 |
| B | 7217 | 6233 | 41 | 41 | 0.57% | 0.66% | 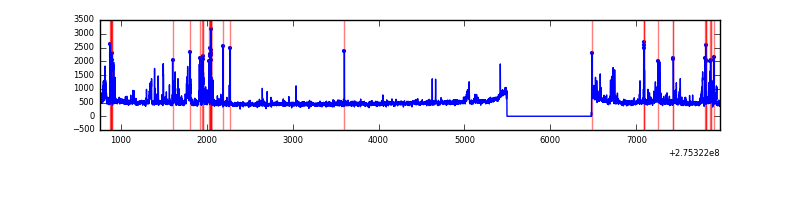 |
| C | 7217 | 6233 | 0 | 0 | 0.00% | 0.00% | 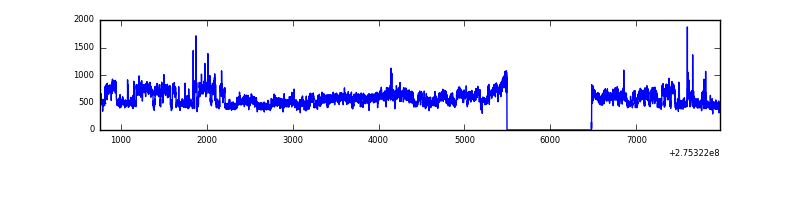 |
| D | 7217 | 6233 | 223 | 223 | 3.09% | 3.58% | 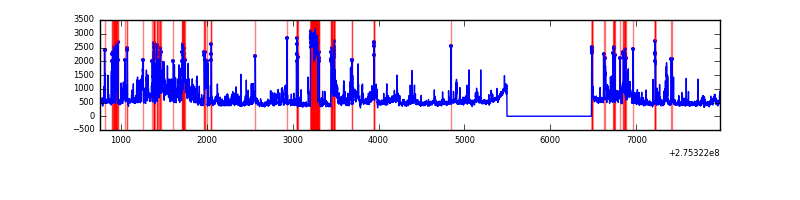 |
Top three noisy pixels from each quadrant. If the there are fewer than three noisy pixels in the level2.evt file, extra rows are filled as -1
| Pixel properties | Quadrant properties | ||||||
|---|---|---|---|---|---|---|---|
| Quadrant | DetID | PixID | Counts | Sigma | Mean | Median | Sigma |
| A | 15 | 174 | 548672 | 3604.57 | 752 | 738 | 152.0 |
| A | 13 | 248 | 21125 | 134.12 | 752 | 738 | 152.0 |
| A | 0 | 226 | 6799 | 39.87 | 752 | 738 | 152.0 |
| B | 7 | 220 | 166597 | 1156.92 | 750 | 733 | 143.4 |
| B | 5 | 65 | 163798 | 1137.39 | 750 | 733 | 143.4 |
| B | 0 | 189 | 42758 | 293.13 | 750 | 733 | 143.4 |
| C | 3 | 233 | 665098 | 3952.64 | 719 | 724 | 168.1 |
| C | 14 | 238 | 110329 | 652.09 | 719 | 724 | 168.1 |
| C | 0 | 207 | 22690 | 130.69 | 719 | 724 | 168.1 |
| D | 1 | 52 | 1364445 | 7036.89 | 720 | 705 | 193.8 |
| D | 7 | 38 | 137306 | 704.86 | 720 | 705 | 193.8 |
| D | 10 | 70 | 77324 | 395.35 | 720 | 705 | 193.8 |
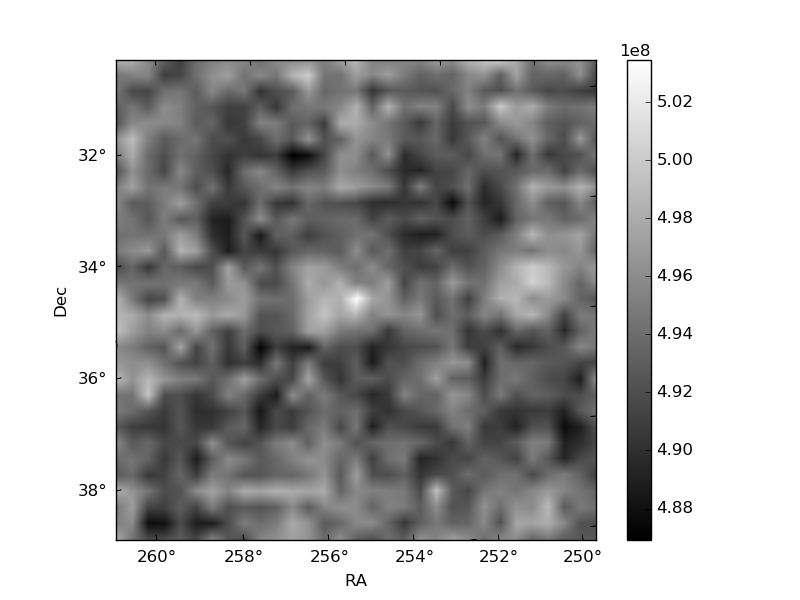
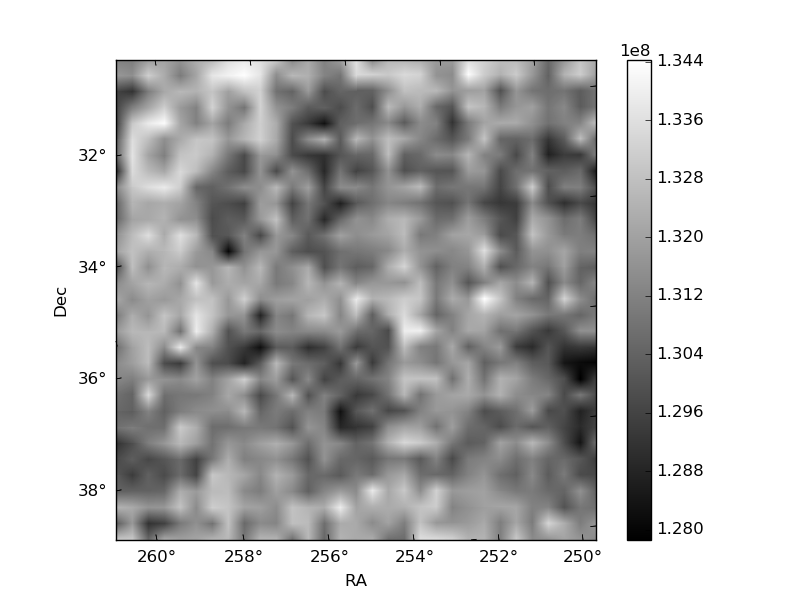
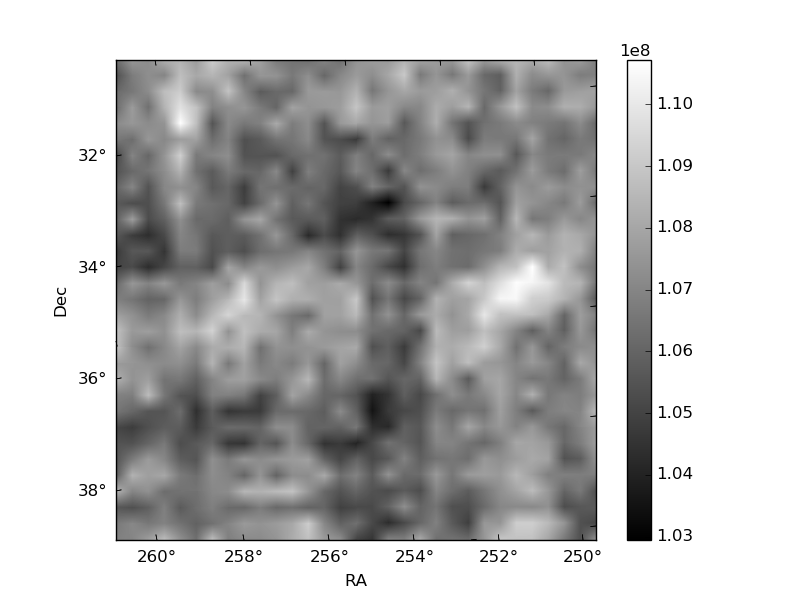
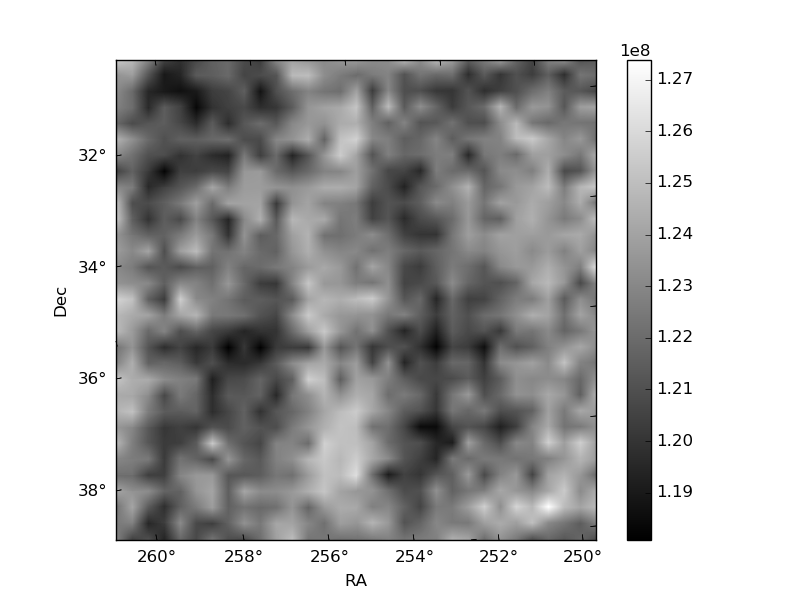
Histogram calculated using DETX and DETY for each event in the final _common_clean file
| Quadrant A | 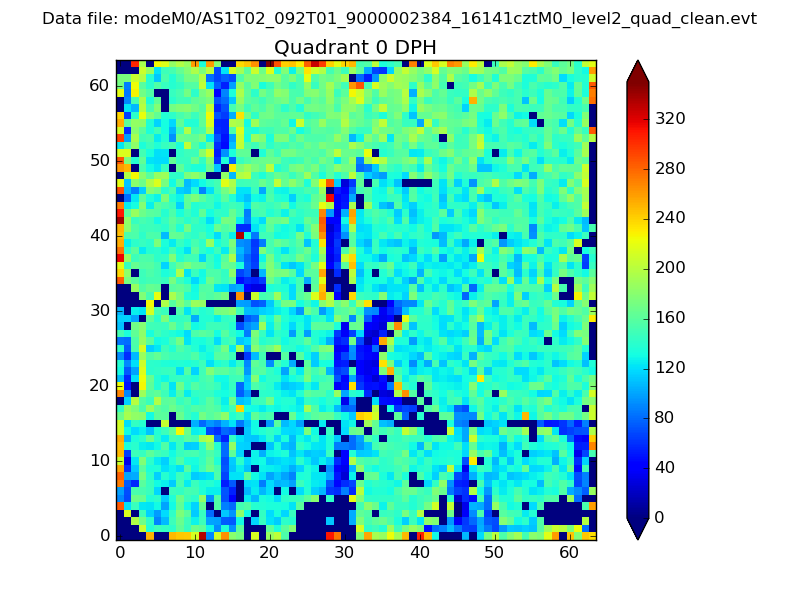 |
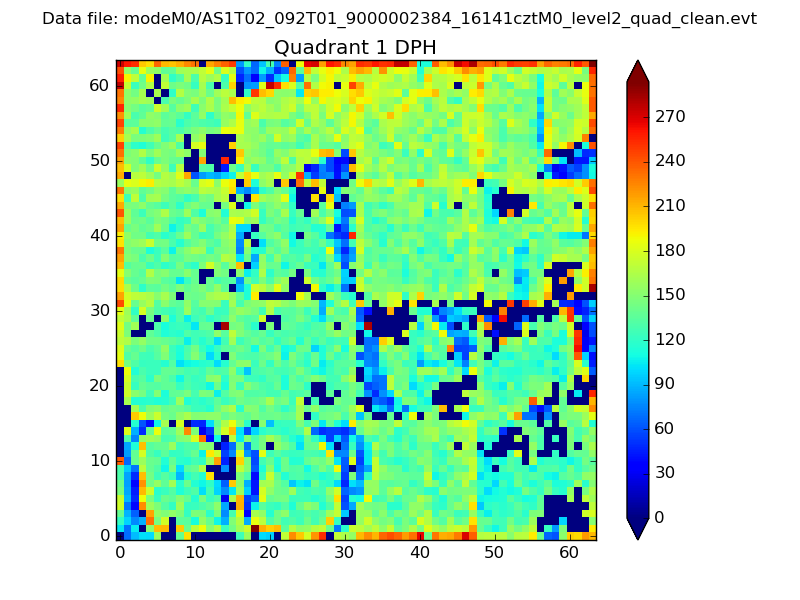 |
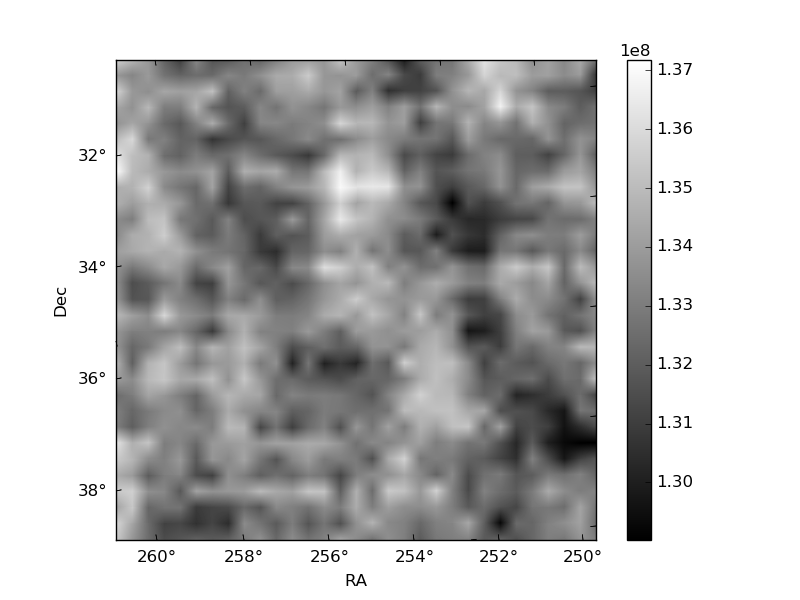
Quadrant B |
|---|---|---|---|
| Quadrant D | 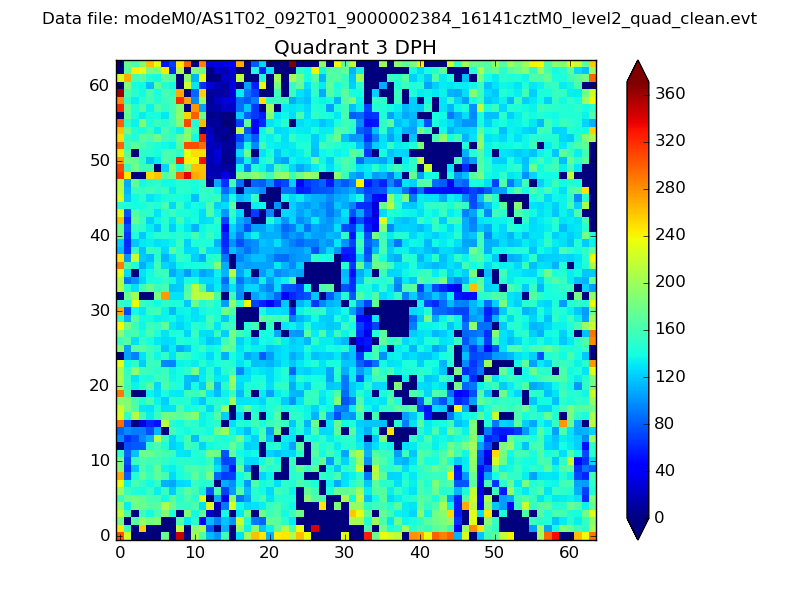 |
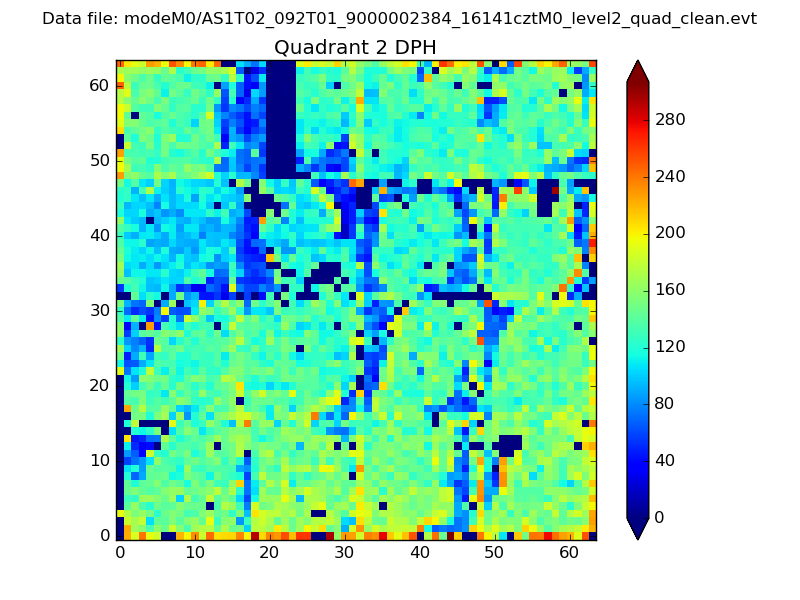 |
Quadrant C |
| Plot type | Count rate plots | Images |
|---|---|---|
| Comparison with Poisson distribution Blue bars denote a histogram of data divided into 1 sec bins. Red curve is a Poisson curve with rate = median count rate of data. |
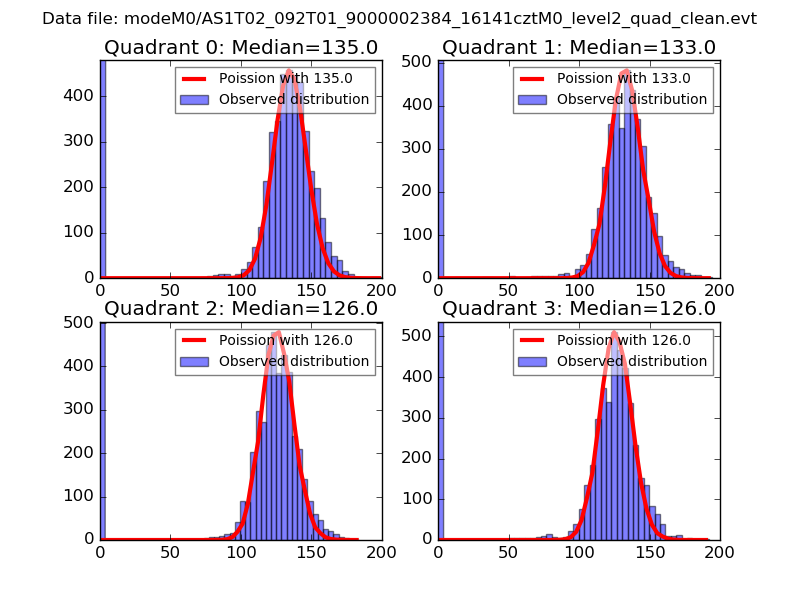 |
 |
| Quadrant-wise count rates Data is divided into 100 sec bins |
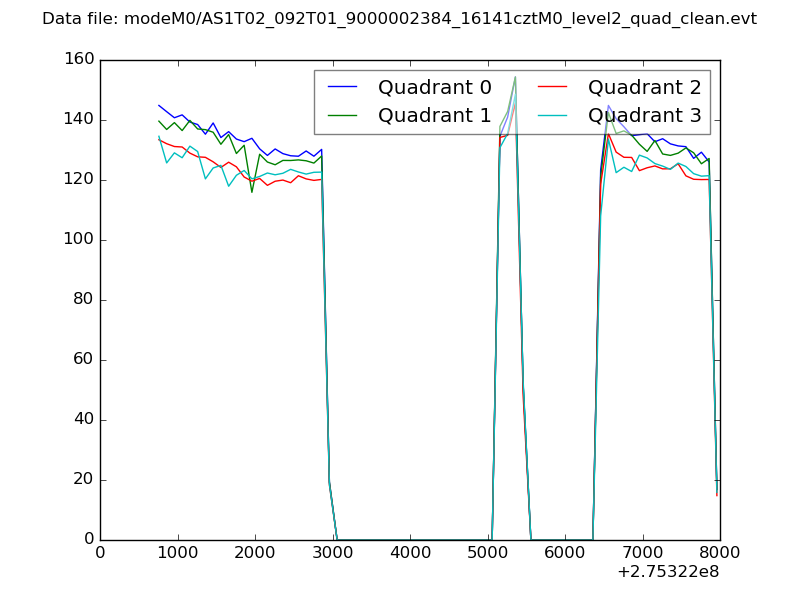 |
|
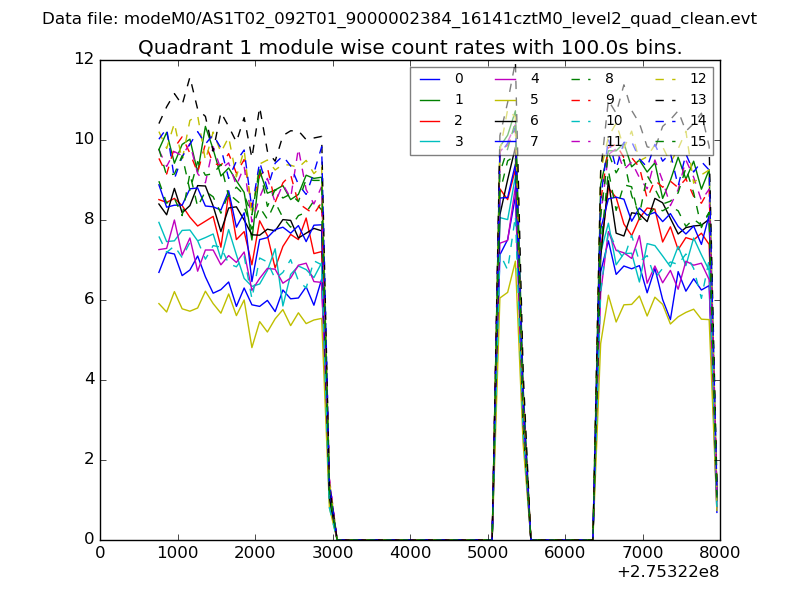
| Module-wise count rates for Quadrant A Data is divided into 100 sec bins |
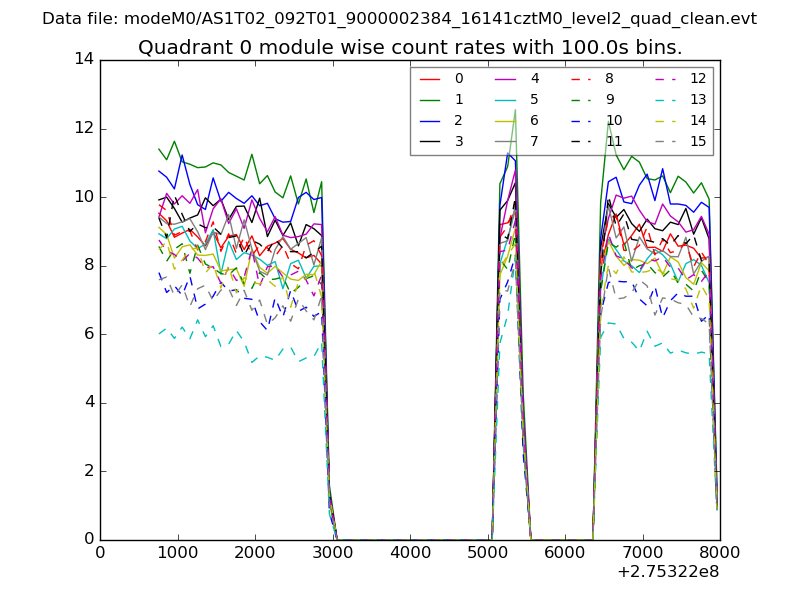 |
 |
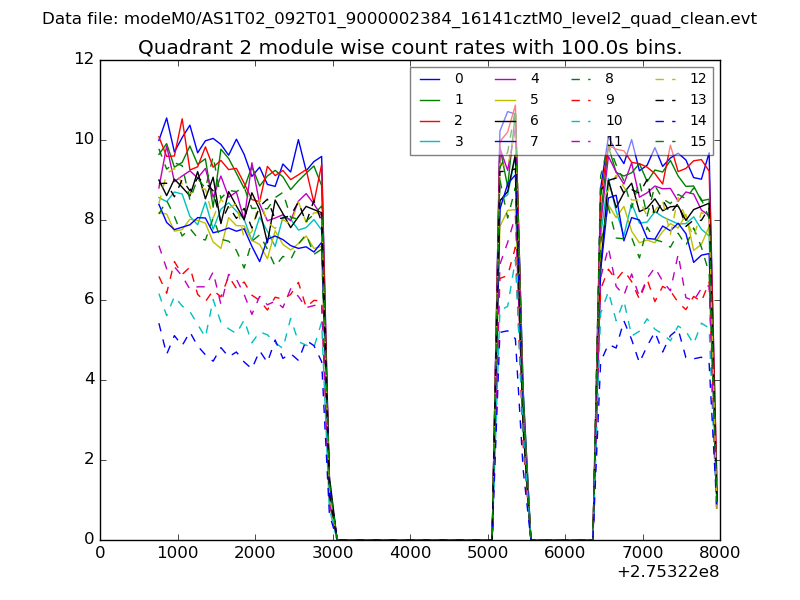
| Module-wise count rates for Quadrant B Data is divided into 100 sec bins |
 |
 |
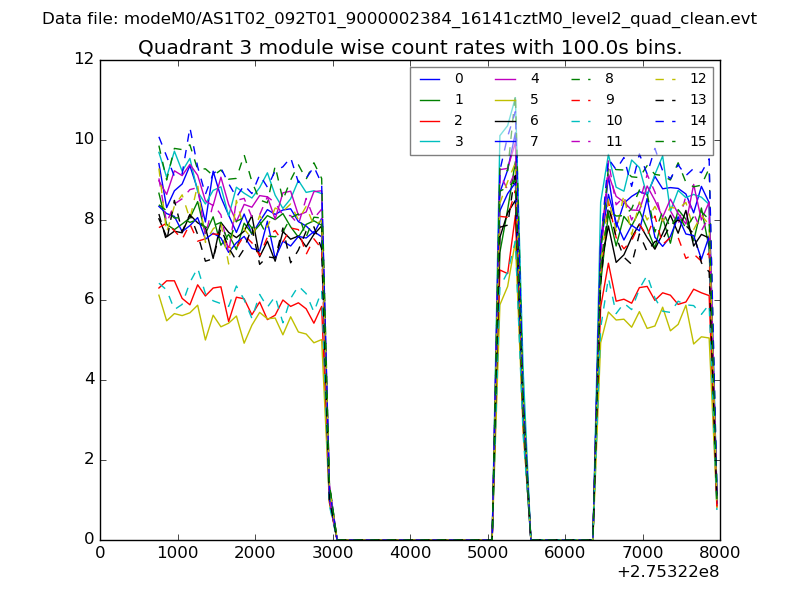
| Module-wise count rates for Quadrant C Data is divided into 100 sec bins |
 |
 |
| Module-wise count rates for Quadrant D Data is divided into 100 sec bins |
 |
 |
| Parameter | Plot |
|---|---|
| CZT HV Monitor | 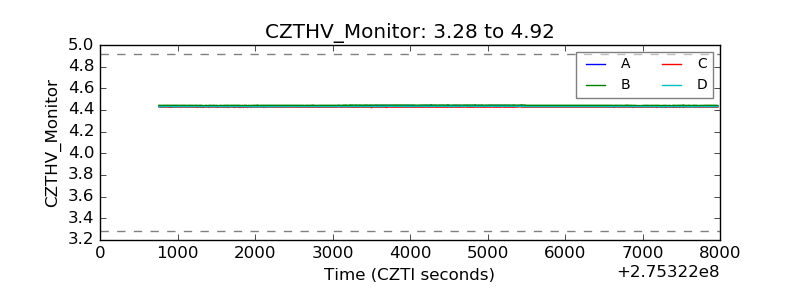 |
| D_VDD | 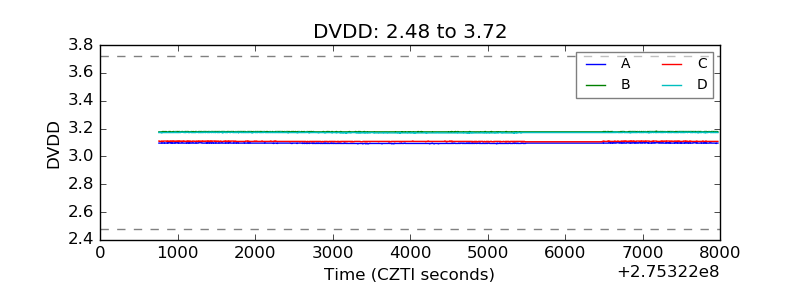 |
| Temperature 1 | 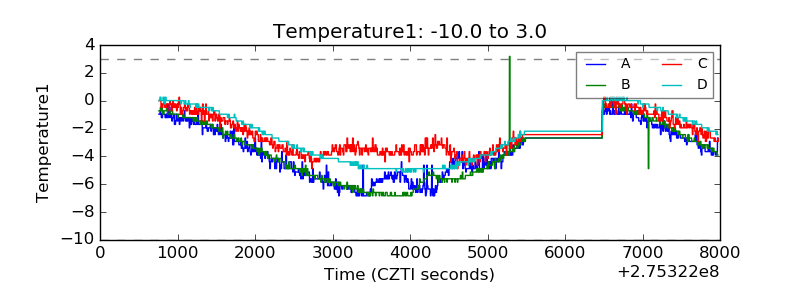 |
| Veto HV Monitor | 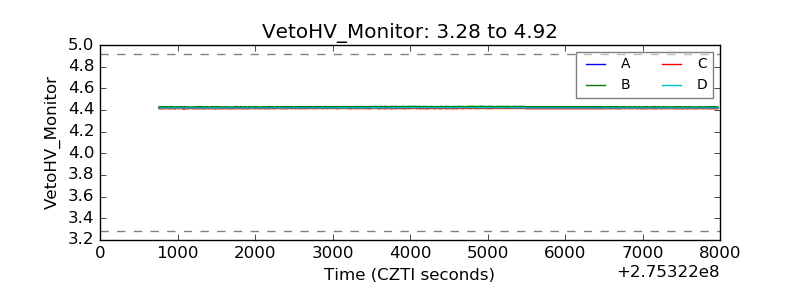 |
| Veto LLD | 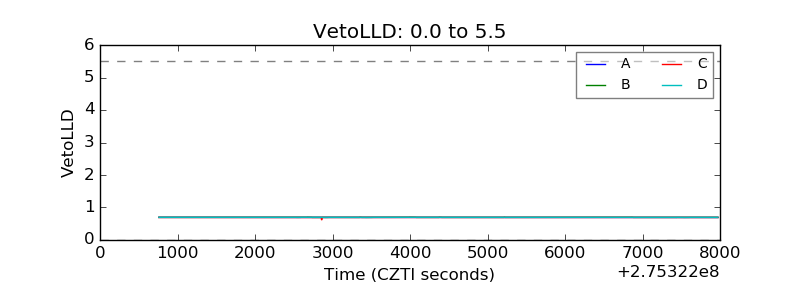 |
| Alpha Counter | 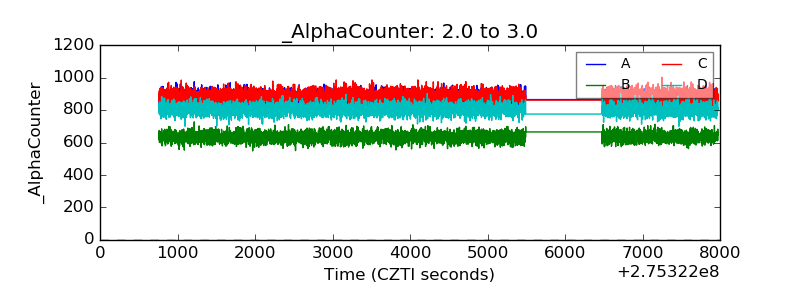 |
| _CPM_Rate | 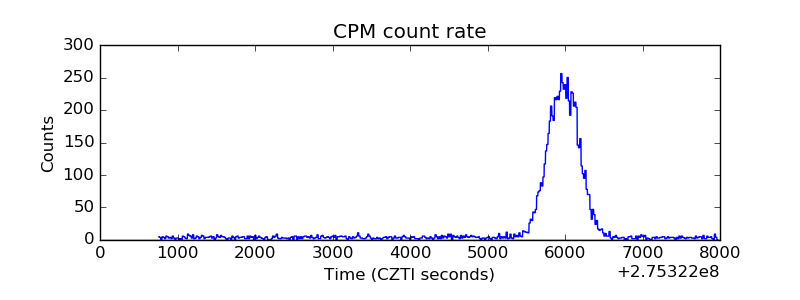 |
| CZT Counter | 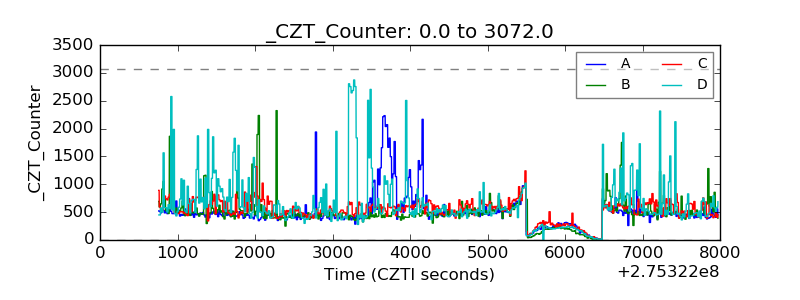 |
| +2.5 Volts monitor |  |
| +5 Volts monitor | 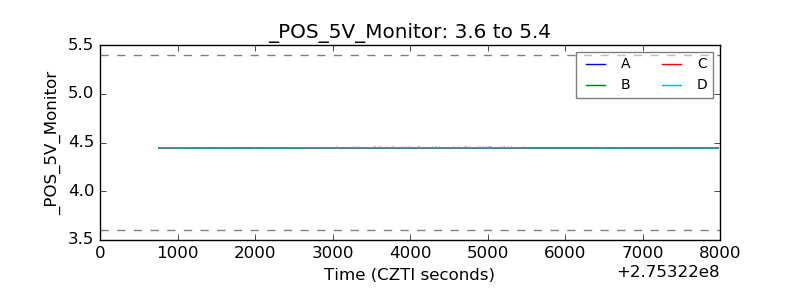 |
| _ROLL_ROT | 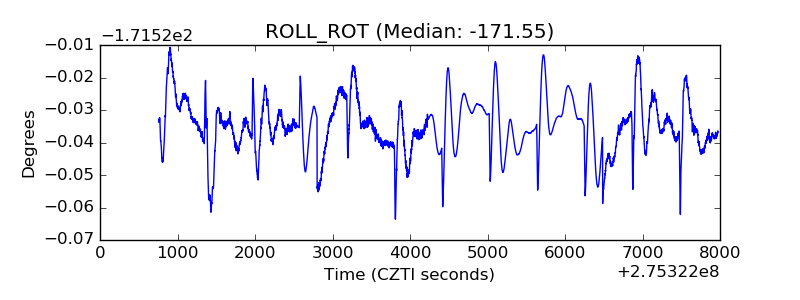 |
| _Roll_DEC | 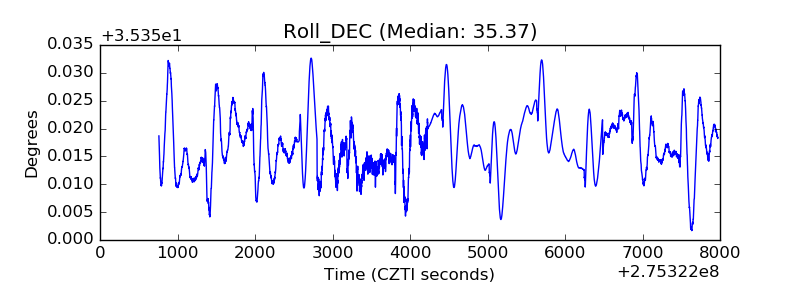 |
| _Roll_RA | 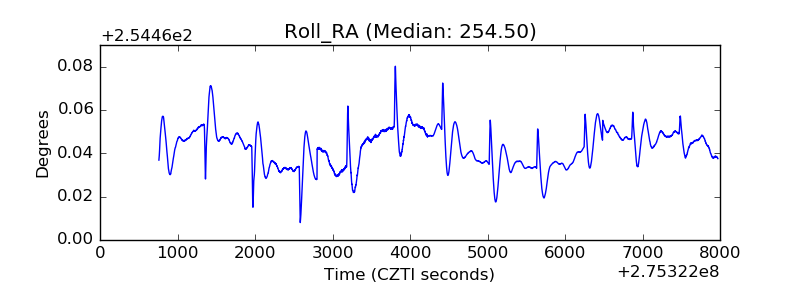 |
| Veto Counter | 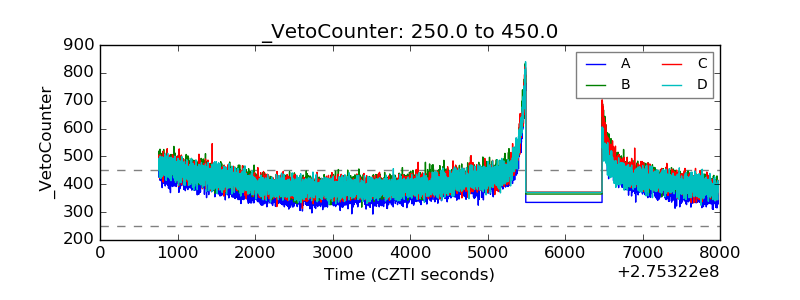 |