| Param | Original file | Final file |
|---|---|---|
| Filename | modeM0/AS1T02_092T01_9000002384_16142cztM0_level2.evt | modeM0/AS1T02_092T01_9000002384_16142cztM0_level2_quad_clean.evt |
| Size (bytes) | 591,891,840 | 97,272,000 |
| Size | 564.5 MB | 92.8 MB |
| Events in quadrant A | 4,050,131 | 644,446 |
| Events in quadrant B | 3,891,085 | 637,662 |
| Events in quadrant C | 3,682,241 | 609,325 |
| Events in quadrant D | 5,824,326 | 563,091 |
| Mode SS | |||
|---|---|---|---|
| Quadrant | BADHDUFLAG | Total packets | Discarded packets |
| A | 0 | 144 | 0 |
| B | 0 | 144 | 0 |
| C | 0 | 144 | 0 |
| D | 0 | 144 | 0 |
| Mode M0 | |||
|---|---|---|---|
| Quadrant | BADHDUFLAG | Total packets | Discarded packets |
| A | 0 | 16670 | 3 |
| B | 0 | 16157 | 2 |
| C | 0 | 15495 | 2 |
| D | 0 | 22048 | 2 |
| Mode M9 | |||
|---|---|---|---|
| Quadrant | BADHDUFLAG | Total packets | Discarded packets |
| A | 0 | 8 | 0 |
| B | 0 | 8 | 0 |
| C | 0 | 8 | 0 |
| D | 0 | 9 | 0 |
| Quadrant | Total seconds | Saturated seconds | Saturation percentage |
|---|---|---|---|
| A | 7046 | 205 | 2.909452% |
| B | 7046 | 88 | 1.248936% |
| C | 7046 | 87 | 1.234743% |
| D | 7046 | 829 | 11.765541% |
Noise dominated data is calculated using 1-second bins in cleaned event files. If a bin has >2000 counts, and if more than 50% of those come from <1% of pixels, then it is considered to be noise-dominated and hence unusable.
| Quadrant | # 1 sec bins | Bins with >0 counts | Bins with >2000 counts | High rate bins dominated by noise | Noise dominated (total time) | Noise dominated (detector-on time) | Marked lightcurve |
|---|---|---|---|---|---|---|---|
| A | 7632 | 7048 | 152 | 152 | 1.99% | 2.16% | 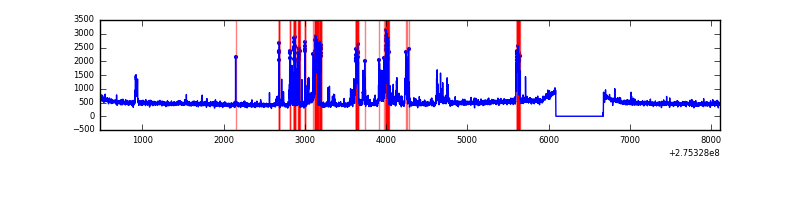 |
| B | 7632 | 7048 | 41 | 41 | 0.54% | 0.58% | 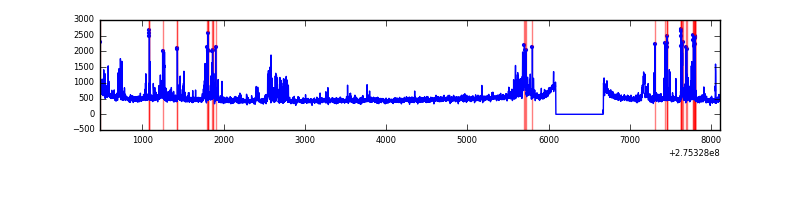 |
| C | 7632 | 7048 | 12 | 12 | 0.16% | 0.17% | 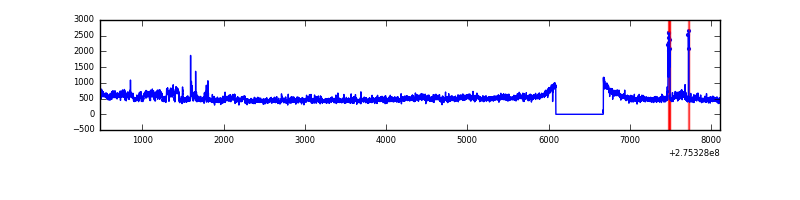 |
| D | 7632 | 7048 | 685 | 685 | 8.98% | 9.72% | 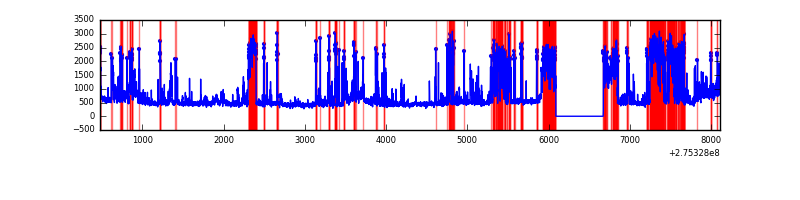 |
Top three noisy pixels from each quadrant. If the there are fewer than three noisy pixels in the level2.evt file, extra rows are filled as -1
| Pixel properties | Quadrant properties | ||||||
|---|---|---|---|---|---|---|---|
| Quadrant | DetID | PixID | Counts | Sigma | Mean | Median | Sigma |
| A | 15 | 174 | 766487 | 4511.45 | 846 | 829 | 169.7 |
| A | 15 | 239 | 9307 | 49.95 | 846 | 829 | 169.7 |
| A | 0 | 226 | 7610 | 39.96 | 846 | 829 | 169.7 |
| B | 7 | 220 | 151069 | 925.06 | 849 | 831 | 162.4 |
| B | 0 | 189 | 138637 | 848.51 | 849 | 831 | 162.4 |
| B | 5 | 65 | 108407 | 662.38 | 849 | 831 | 162.4 |
| C | 3 | 233 | 308857 | 1611.19 | 813 | 818 | 191.2 |
| C | 14 | 238 | 124361 | 646.19 | 813 | 818 | 191.2 |
| C | 0 | 207 | 60995 | 314.75 | 813 | 818 | 191.2 |
| D | 1 | 52 | 1540715 | 7304.5 | 782 | 766 | 210.8 |
| D | 7 | 38 | 1075150 | 5096.17 | 782 | 766 | 210.8 |
| D | 10 | 70 | 97490 | 458.79 | 782 | 766 | 210.8 |
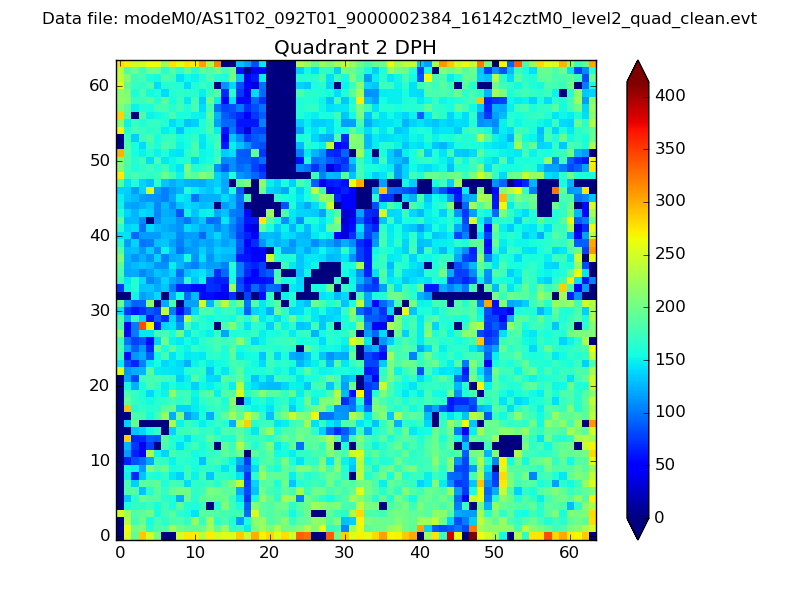
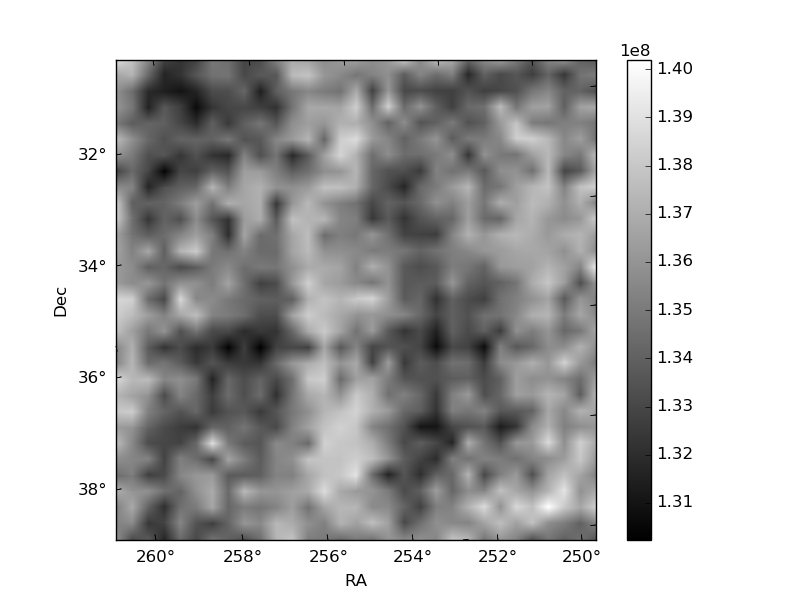
Histogram calculated using DETX and DETY for each event in the final _common_clean file
| Quadrant A | 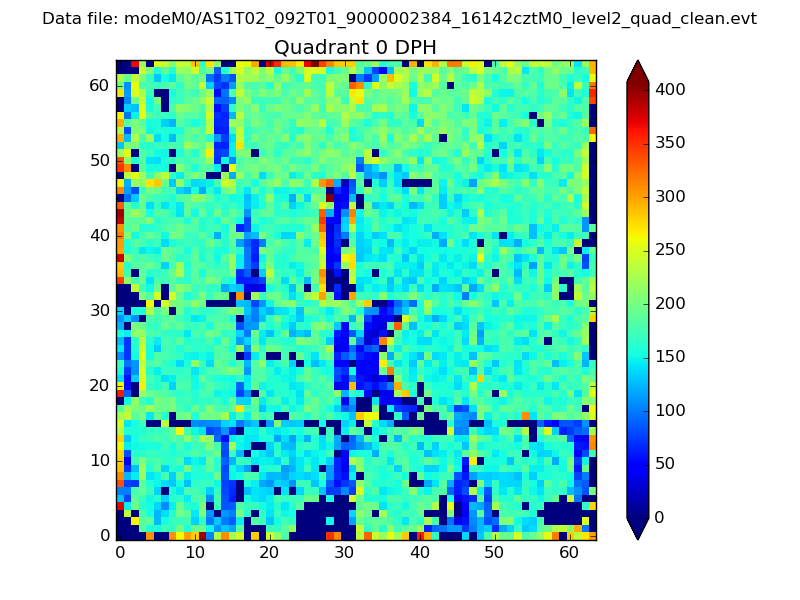 |
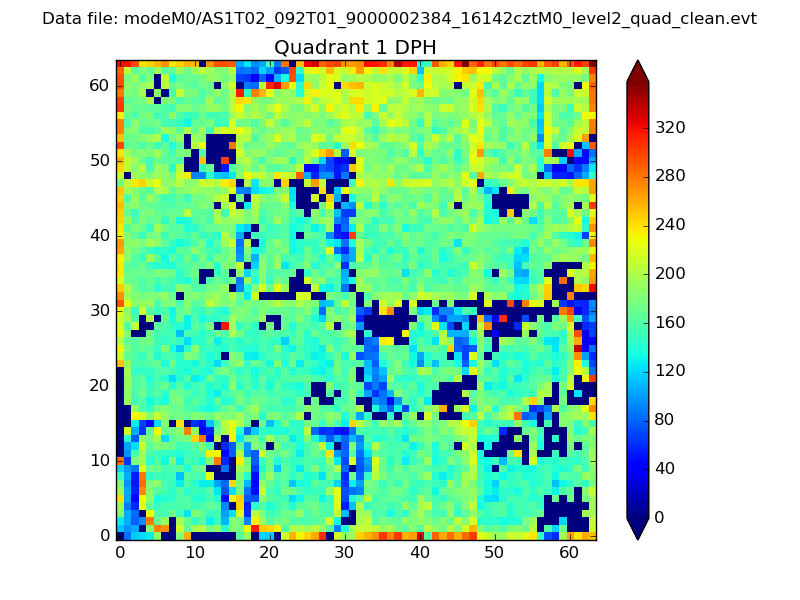 |
Quadrant B |
|---|---|---|---|
| Quadrant D | 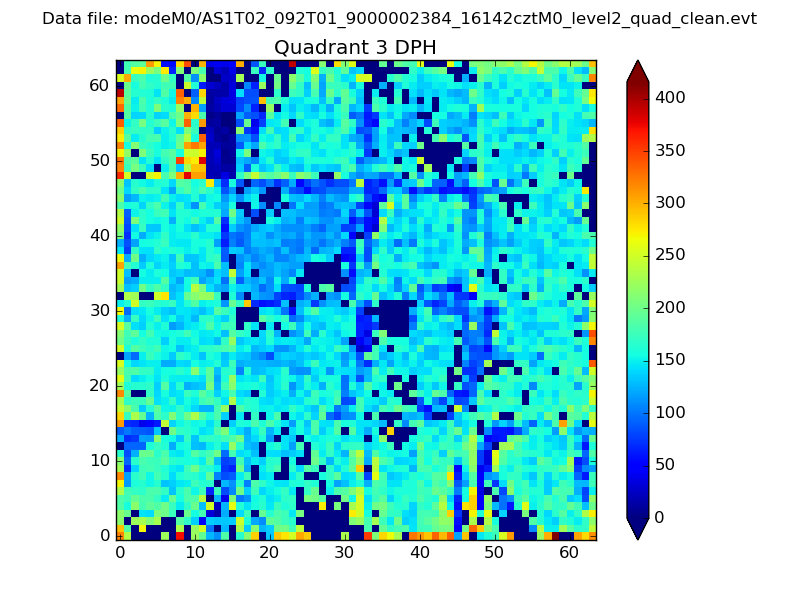 |
 |
Quadrant C |
| Plot type | Count rate plots | Images |
|---|---|---|
| Comparison with Poisson distribution Blue bars denote a histogram of data divided into 1 sec bins. Red curve is a Poisson curve with rate = median count rate of data. |
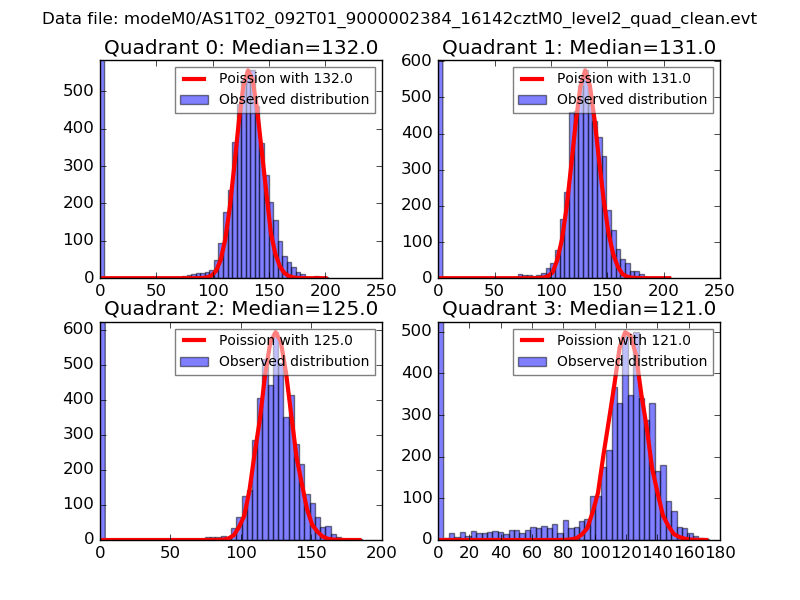 |
 |
| Quadrant-wise count rates Data is divided into 100 sec bins |
 |
|
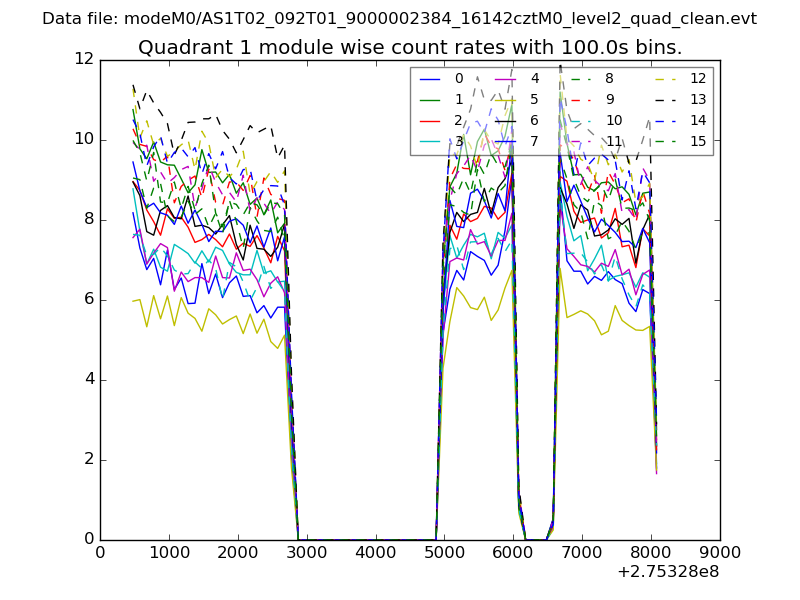
| Module-wise count rates for Quadrant A Data is divided into 100 sec bins |
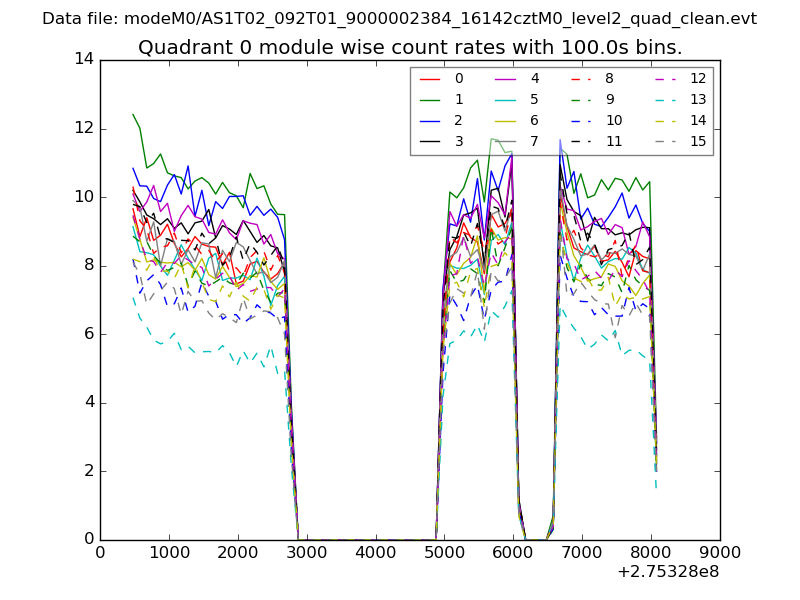 |
 |
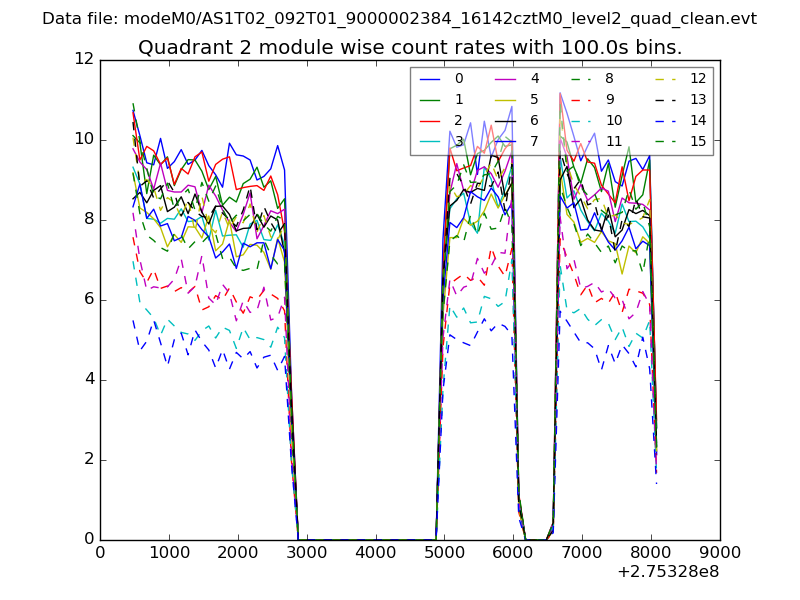
| Module-wise count rates for Quadrant B Data is divided into 100 sec bins |
 |
 |
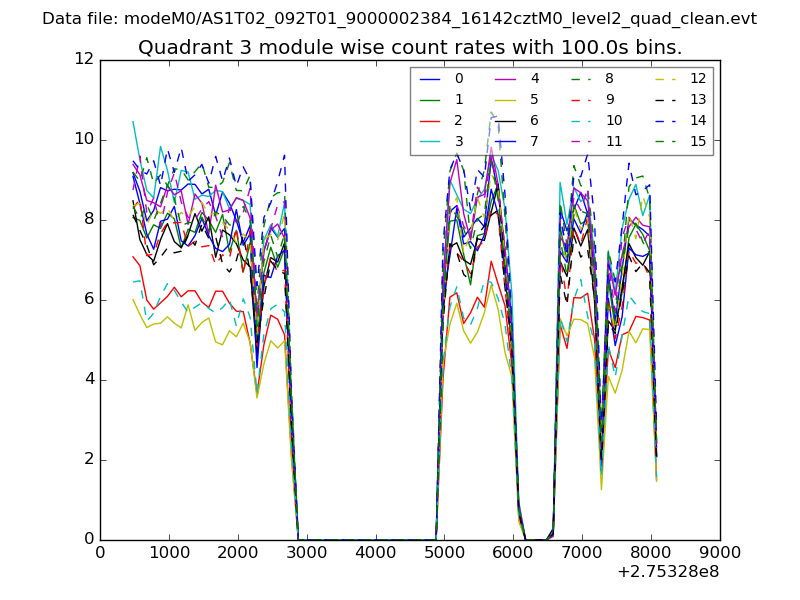
| Module-wise count rates for Quadrant C Data is divided into 100 sec bins |
 |
 |
| Module-wise count rates for Quadrant D Data is divided into 100 sec bins |
 |
 |
| Parameter | Plot |
|---|---|
| CZT HV Monitor | 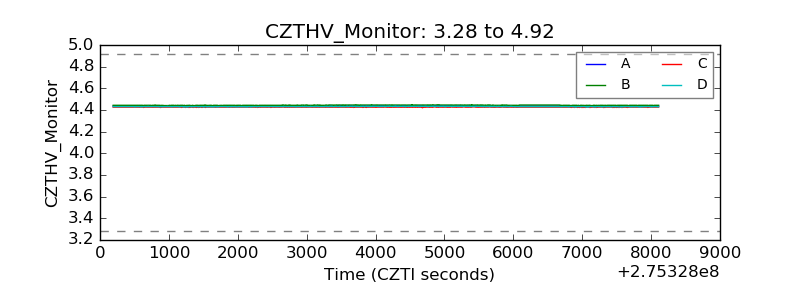 |
| D_VDD | 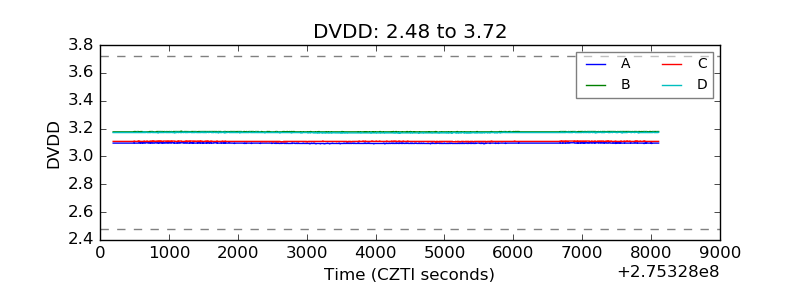 |
| Temperature 1 | 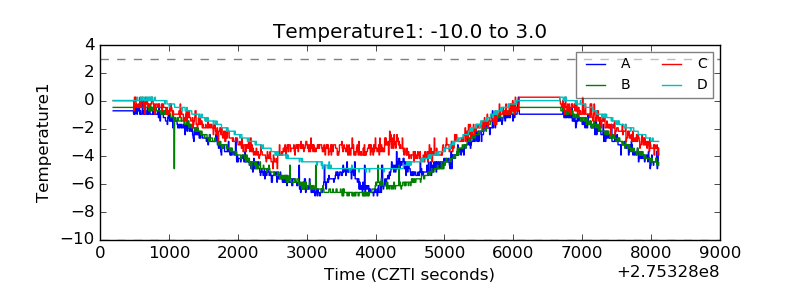 |
| Veto HV Monitor | 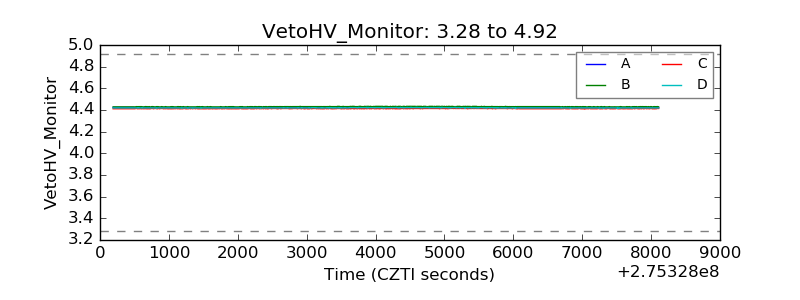 |
| Veto LLD | 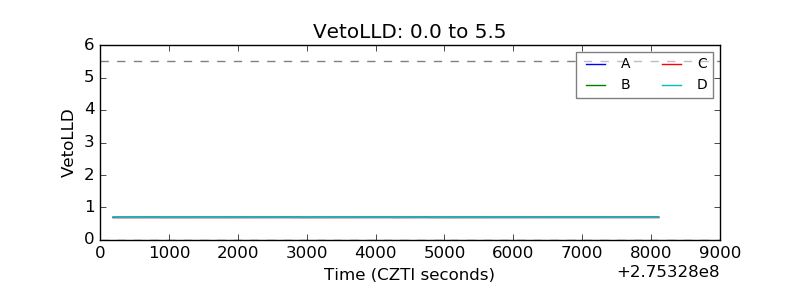 |
| Alpha Counter |  |
| _CPM_Rate | 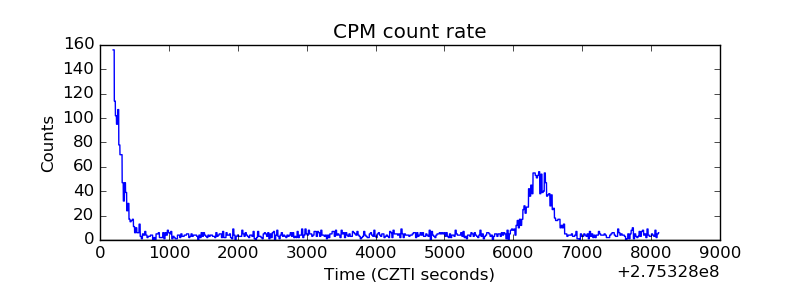 |
| CZT Counter | 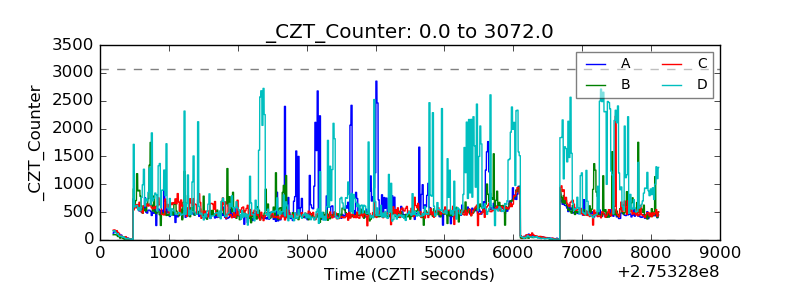 |
| +2.5 Volts monitor |  |
| +5 Volts monitor |  |
| _ROLL_ROT | 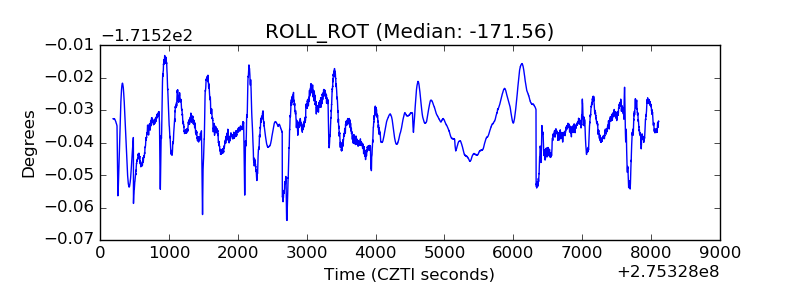 |
| _Roll_DEC | 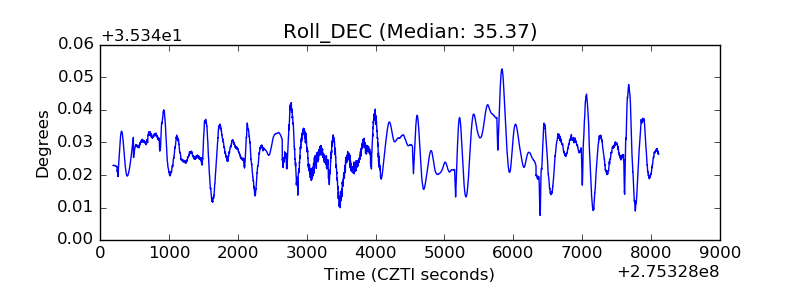 |
| _Roll_RA | 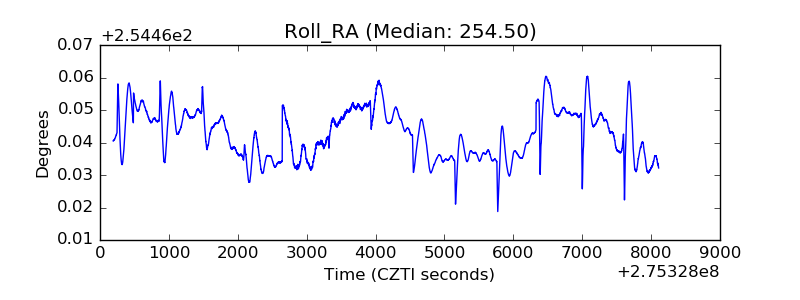 |
| Veto Counter | 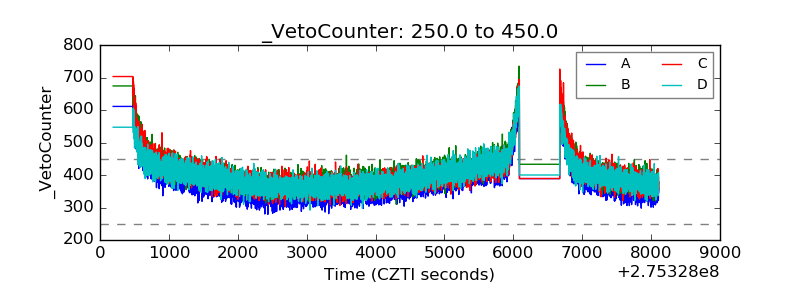 |