| Param | Original file | Final file |
|---|---|---|
| Filename | modeM0/AS1T02_092T01_9000002384_16143cztM0_level2.evt | modeM0/AS1T02_092T01_9000002384_16143cztM0_level2_quad_clean.evt |
| Size (bytes) | 558,256,320 | 103,150,080 |
| Size | 532.4 MB | 98.4 MB |
| Events in quadrant A | 3,647,361 | 680,236 |
| Events in quadrant B | 4,079,434 | 672,389 |
| Events in quadrant C | 3,748,557 | 643,790 |
| Events in quadrant D | 4,930,625 | 613,573 |
| Mode SS | |||
|---|---|---|---|
| Quadrant | BADHDUFLAG | Total packets | Discarded packets |
| A | 0 | 150 | 0 |
| B | 0 | 150 | 0 |
| C | 0 | 150 | 0 |
| D | 0 | 150 | 0 |
| Mode M0 | |||
|---|---|---|---|
| Quadrant | BADHDUFLAG | Total packets | Discarded packets |
| A | 0 | 15700 | 3 |
| B | 0 | 16953 | 2 |
| C | 0 | 15844 | 2 |
| D | 0 | 19704 | 2 |
| Mode M9 | |||
|---|---|---|---|
| Quadrant | BADHDUFLAG | Total packets | Discarded packets |
| A | 0 | 5 | 0 |
| B | 0 | 5 | 0 |
| C | 0 | 5 | 0 |
| D | 0 | 6 | 0 |
| Quadrant | Total seconds | Saturated seconds | Saturation percentage |
|---|---|---|---|
| A | 7380 | 85 | 1.151762% |
| B | 7380 | 131 | 1.775068% |
| C | 7380 | 111 | 1.504065% |
| D | 7380 | 457 | 6.192412% |
Noise dominated data is calculated using 1-second bins in cleaned event files. If a bin has >2000 counts, and if more than 50% of those come from <1% of pixels, then it is considered to be noise-dominated and hence unusable.
| Quadrant | # 1 sec bins | Bins with >0 counts | Bins with >2000 counts | High rate bins dominated by noise | Noise dominated (total time) | Noise dominated (detector-on time) | Marked lightcurve |
|---|---|---|---|---|---|---|---|
| A | 7696 | 7382 | 25 | 25 | 0.32% | 0.34% | 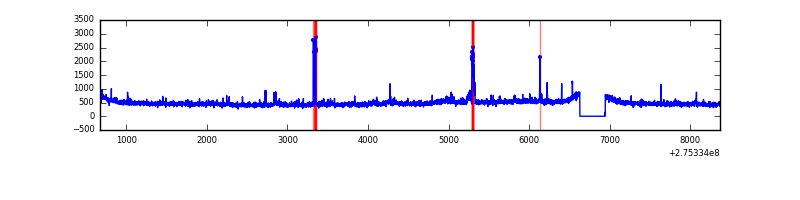 |
| B | 7696 | 7382 | 41 | 41 | 0.53% | 0.56% | 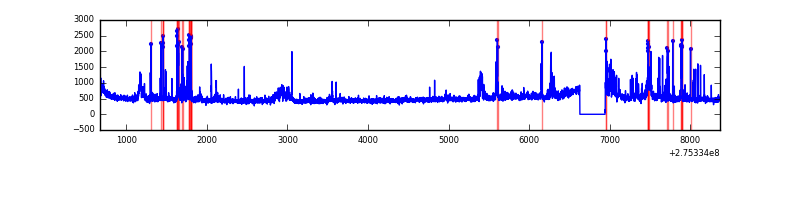 |
| C | 7696 | 7382 | 13 | 13 | 0.17% | 0.18% |  |
| D | 7696 | 7382 | 357 | 357 | 4.64% | 4.84% | 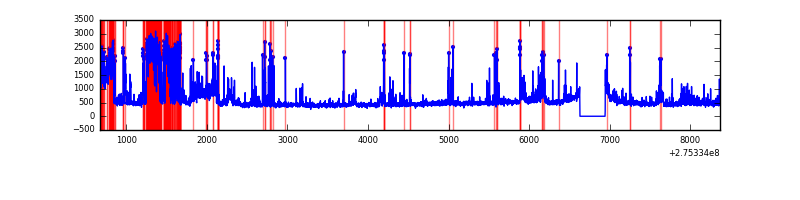 |
Top three noisy pixels from each quadrant. If the there are fewer than three noisy pixels in the level2.evt file, extra rows are filled as -1
| Pixel properties | Quadrant properties | ||||||
|---|---|---|---|---|---|---|---|
| Quadrant | DetID | PixID | Counts | Sigma | Mean | Median | Sigma |
| A | 15 | 174 | 182919 | 1021.12 | 887 | 870 | 178.3 |
| A | 0 | 253 | 16677 | 88.66 | 887 | 870 | 178.3 |
| A | 13 | 248 | 14850 | 78.41 | 887 | 870 | 178.3 |
| B | 5 | 65 | 164999 | 970.13 | 885 | 864 | 169.2 |
| B | 0 | 189 | 139829 | 821.36 | 885 | 864 | 169.2 |
| B | 7 | 220 | 79557 | 465.12 | 885 | 864 | 169.2 |
| C | 3 | 233 | 206696 | 1029.01 | 848 | 854 | 200.0 |
| C | 14 | 238 | 130464 | 647.92 | 848 | 854 | 200.0 |
| C | 0 | 207 | 82796 | 409.63 | 848 | 854 | 200.0 |
| D | 7 | 38 | 870575 | 4166.08 | 844 | 817 | 208.8 |
| D | 1 | 52 | 646771 | 3094.08 | 844 | 817 | 208.8 |
| D | 5 | 222 | 82149 | 389.57 | 844 | 817 | 208.8 |
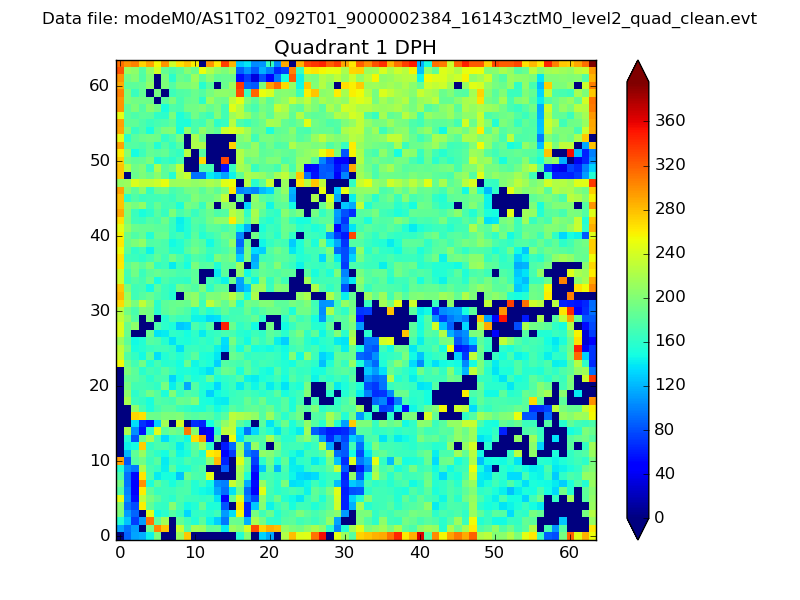
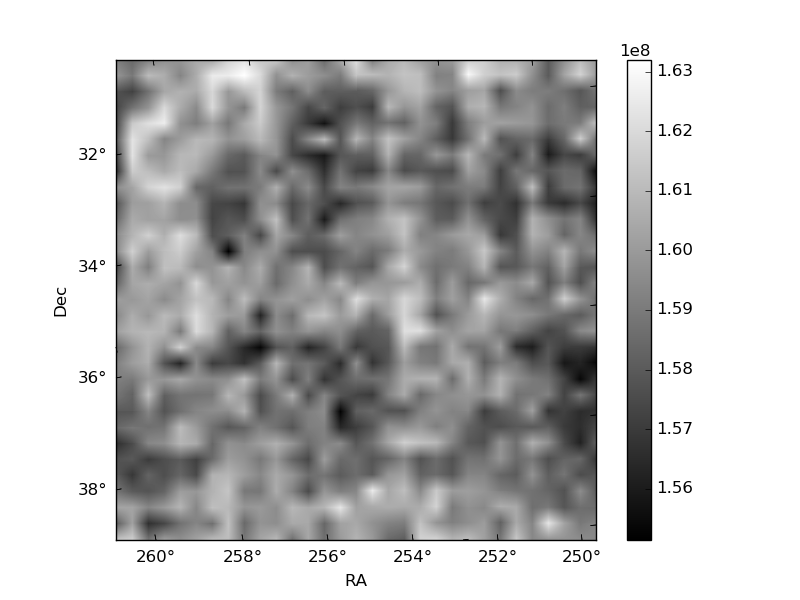
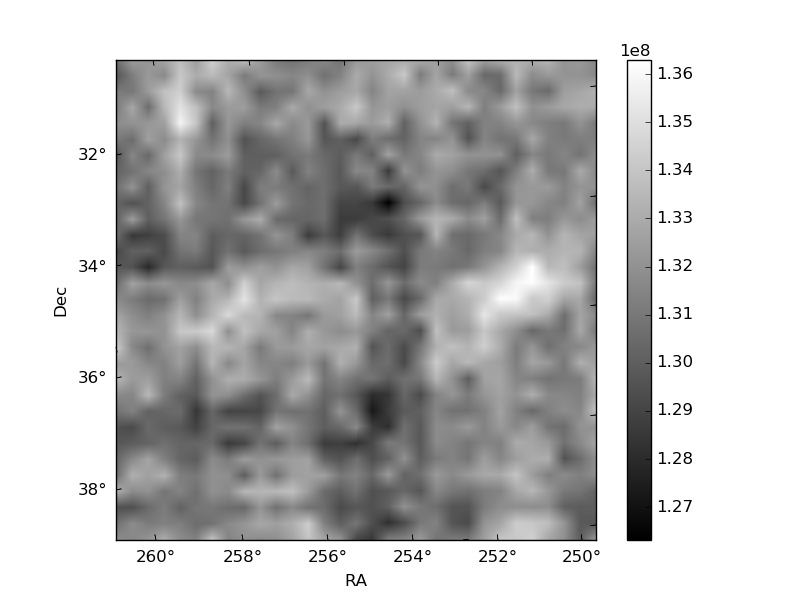
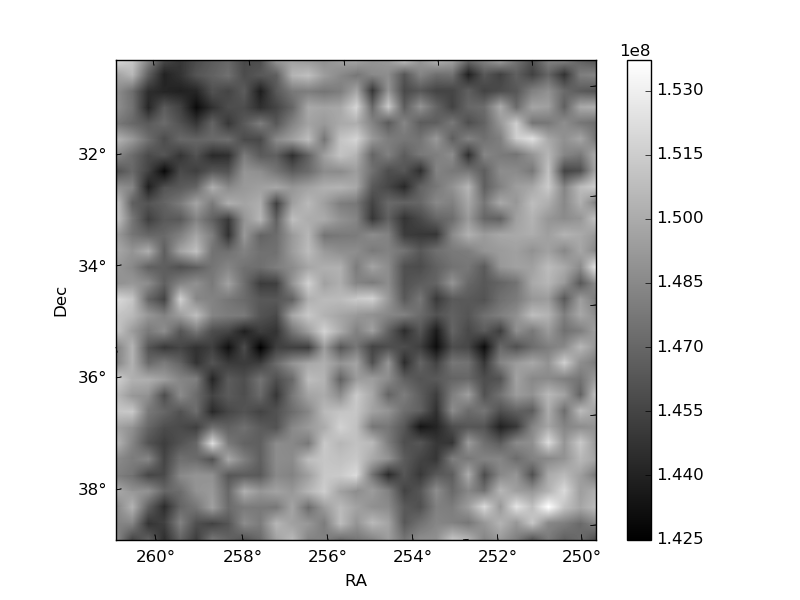
Histogram calculated using DETX and DETY for each event in the final _common_clean file
| Quadrant A | 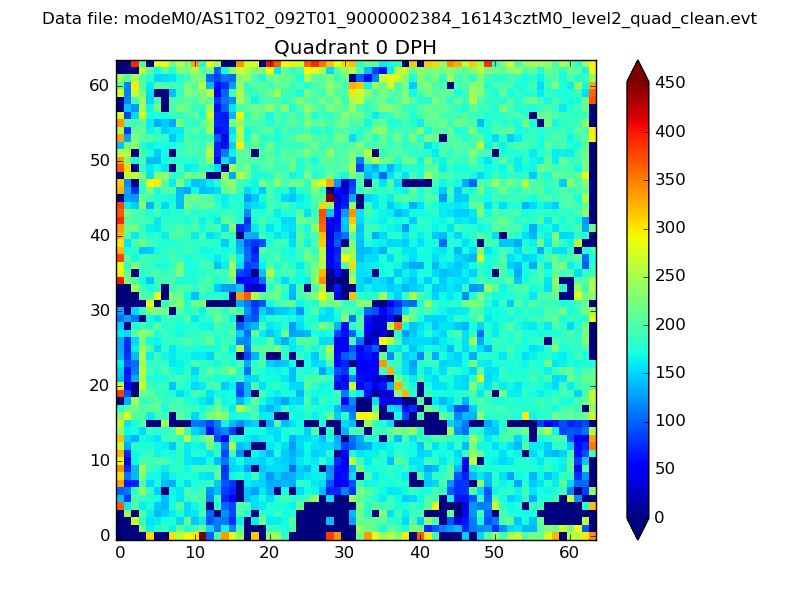 |
 |
Quadrant B |
|---|---|---|---|
| Quadrant D | 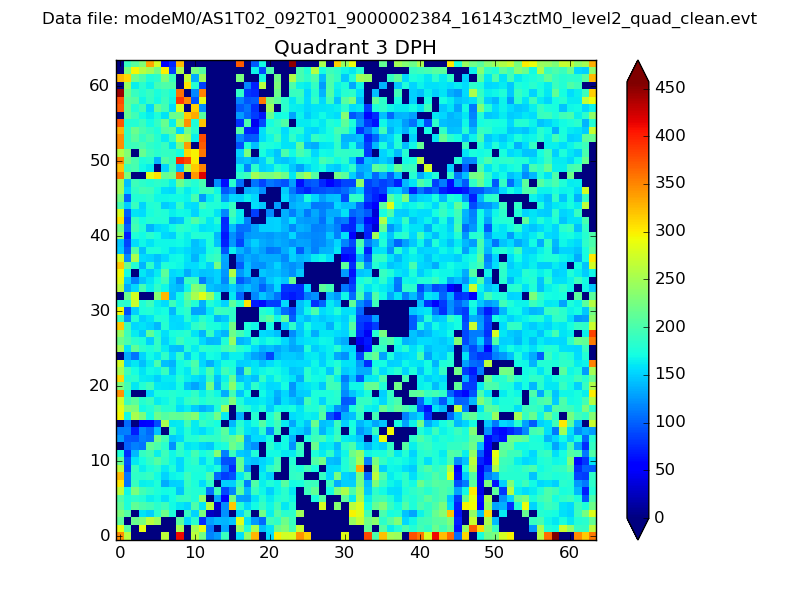 |
 |
Quadrant C |
| Plot type | Count rate plots | Images |
|---|---|---|
| Comparison with Poisson distribution Blue bars denote a histogram of data divided into 1 sec bins. Red curve is a Poisson curve with rate = median count rate of data. |
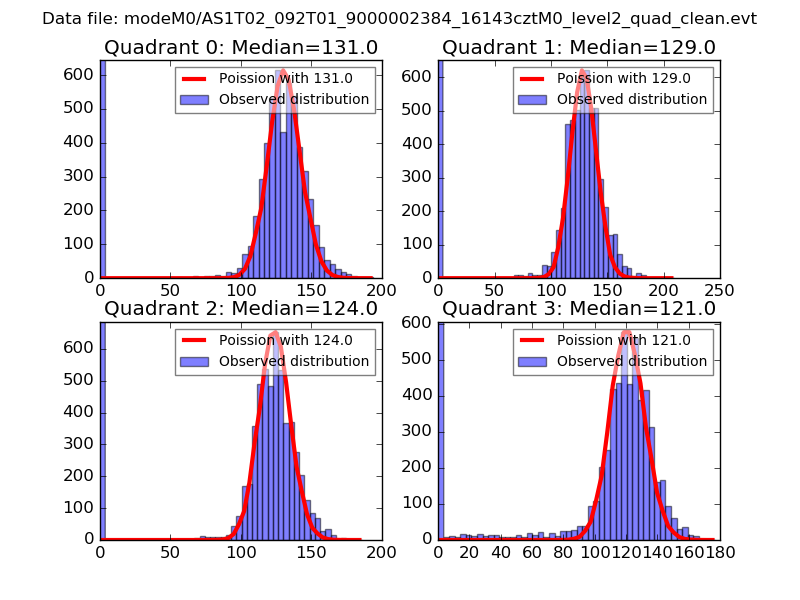 |
 |
| Quadrant-wise count rates Data is divided into 100 sec bins |
 |
|
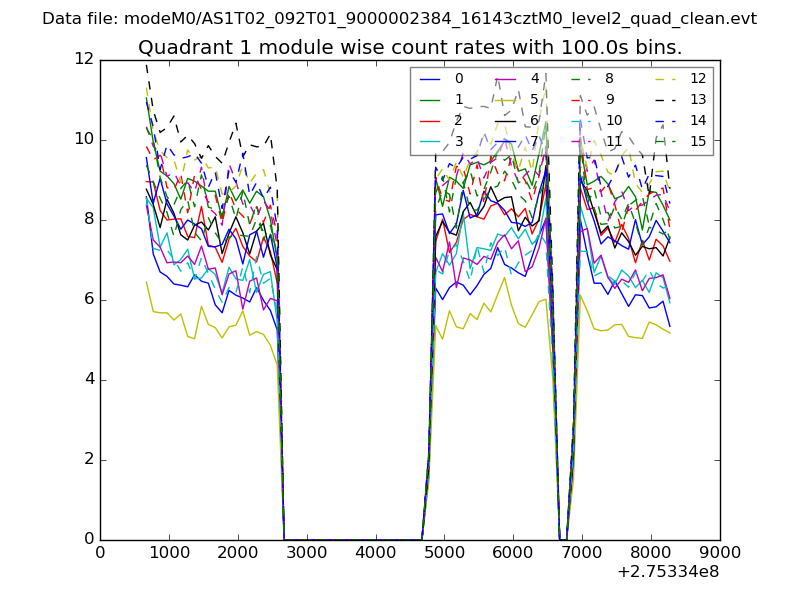
| Module-wise count rates for Quadrant A Data is divided into 100 sec bins |
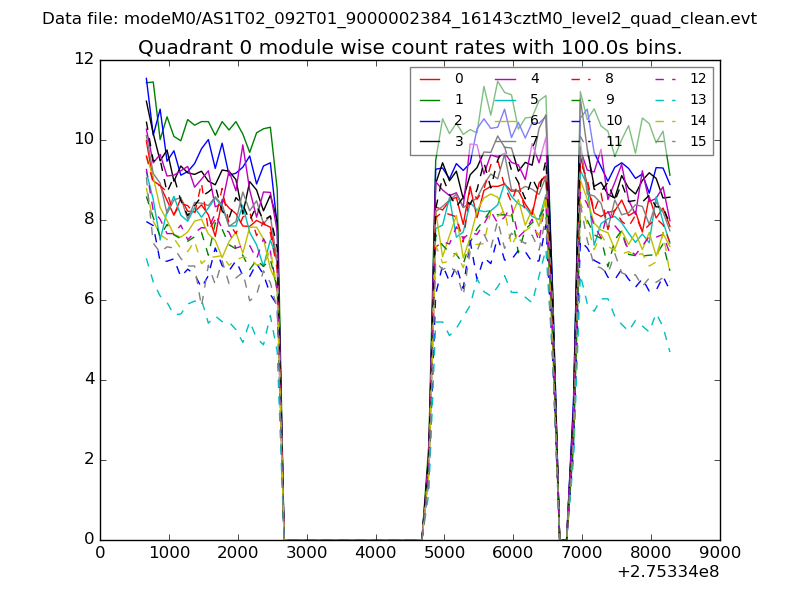 |
 |
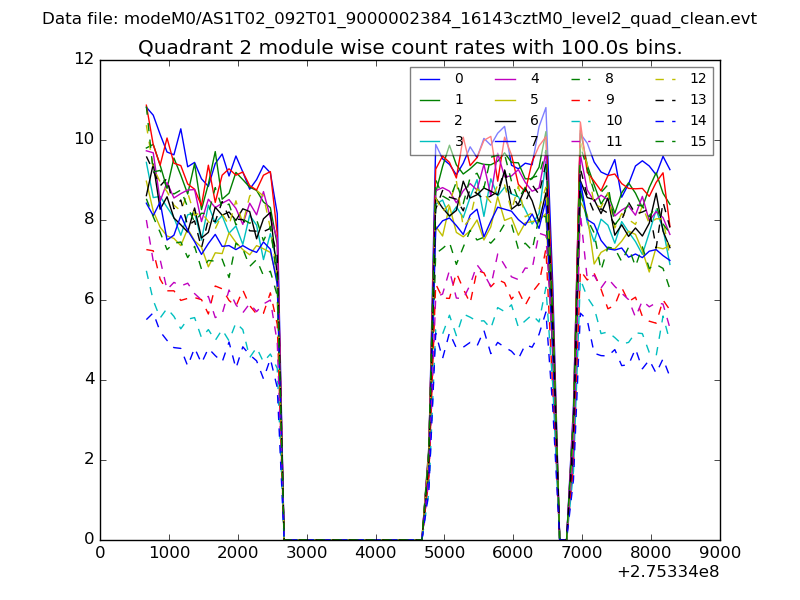
| Module-wise count rates for Quadrant B Data is divided into 100 sec bins |
 |
 |
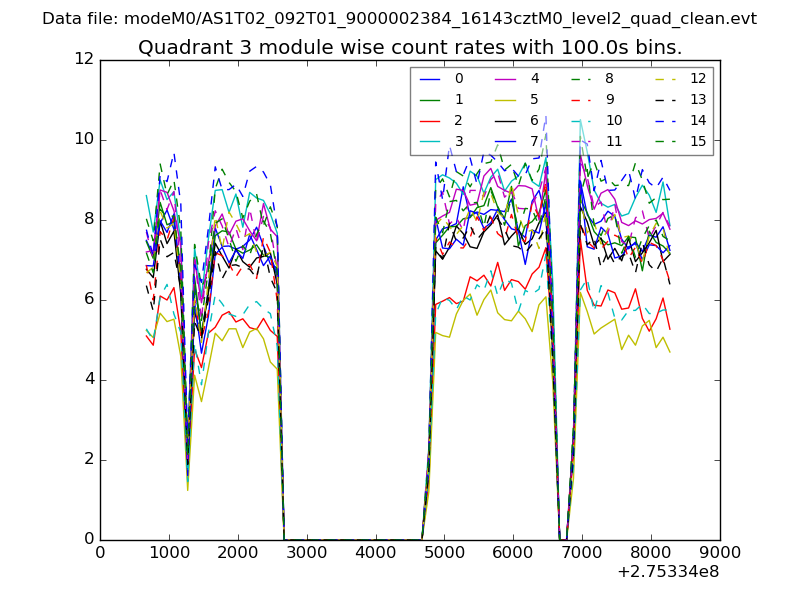
| Module-wise count rates for Quadrant C Data is divided into 100 sec bins |
 |
 |
| Module-wise count rates for Quadrant D Data is divided into 100 sec bins |
 |
 |
| Parameter | Plot |
|---|---|
| CZT HV Monitor | 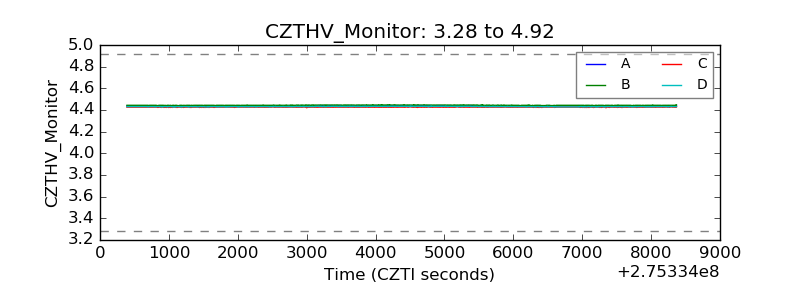 |
| D_VDD | 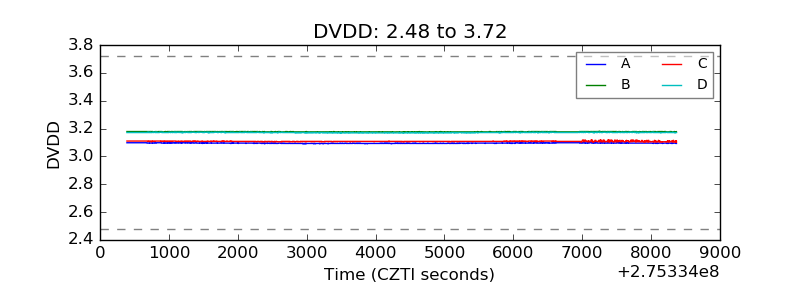 |
| Temperature 1 | 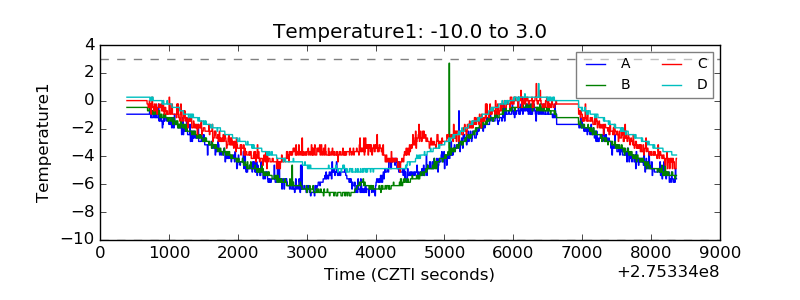 |
| Veto HV Monitor | 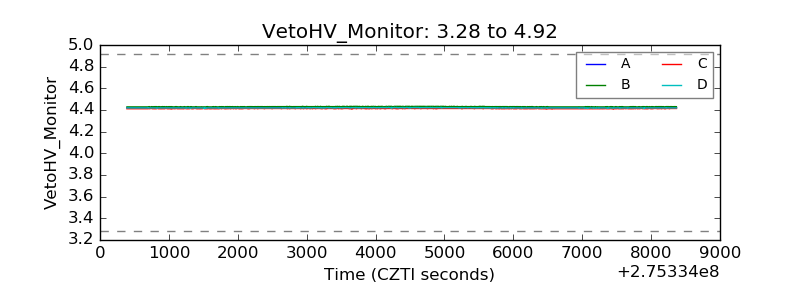 |
| Veto LLD | 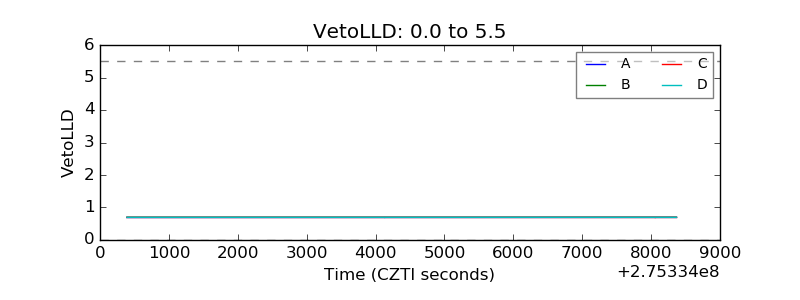 |
| Alpha Counter | 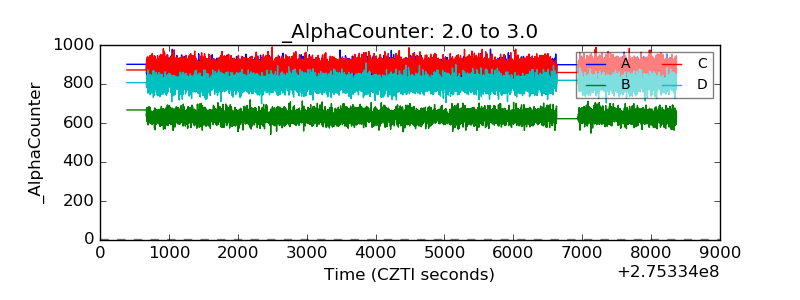 |
| _CPM_Rate | 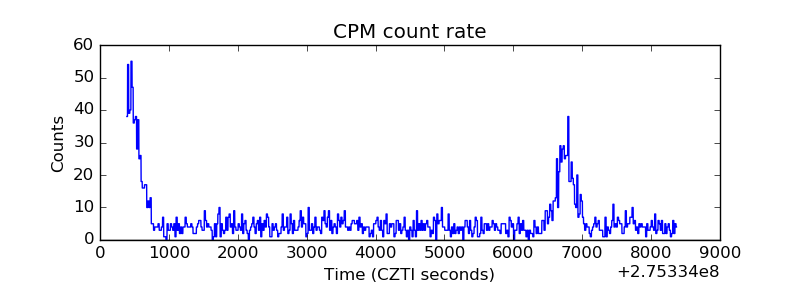 |
| CZT Counter |  |
| +2.5 Volts monitor |  |
| +5 Volts monitor |  |
| _ROLL_ROT | 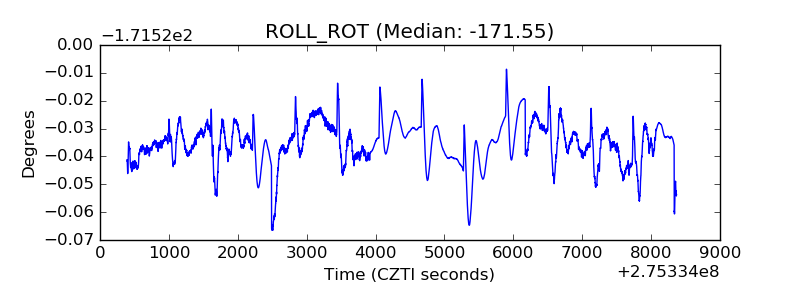 |
| _Roll_DEC | 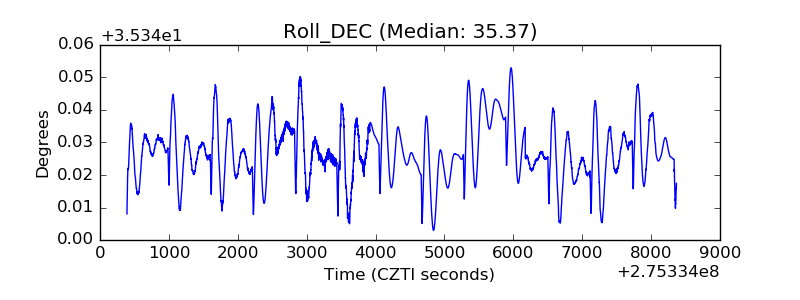 |
| _Roll_RA |  |
| Veto Counter | 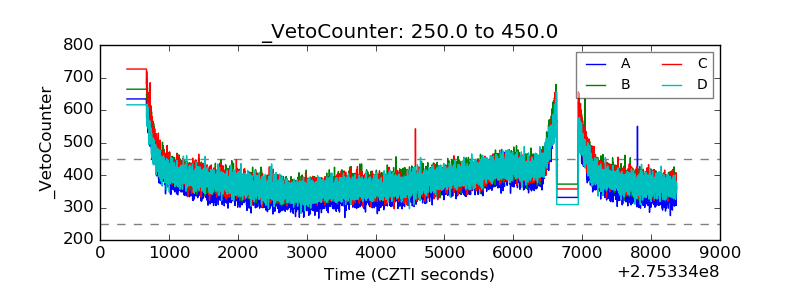 |